-

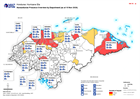
Honduras: Humanitarian Presence - Who is doing What in Department (as at 18th...
Map shows the number of reported activities per Sector, and who is delivering them, per Department in Honduras. Critical and High priority response areas and satellite derived... -

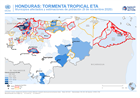
Ulua Basin: areas evacuated for Hurricane Iota, with El Cajón dam overspillin...
The Municipalities indicated were given mandatory evacuation ordres from low lying land near Ulua and Chameleco rivers pre hurricane Iota. Modelling of possible inundation from... -
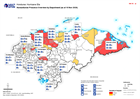
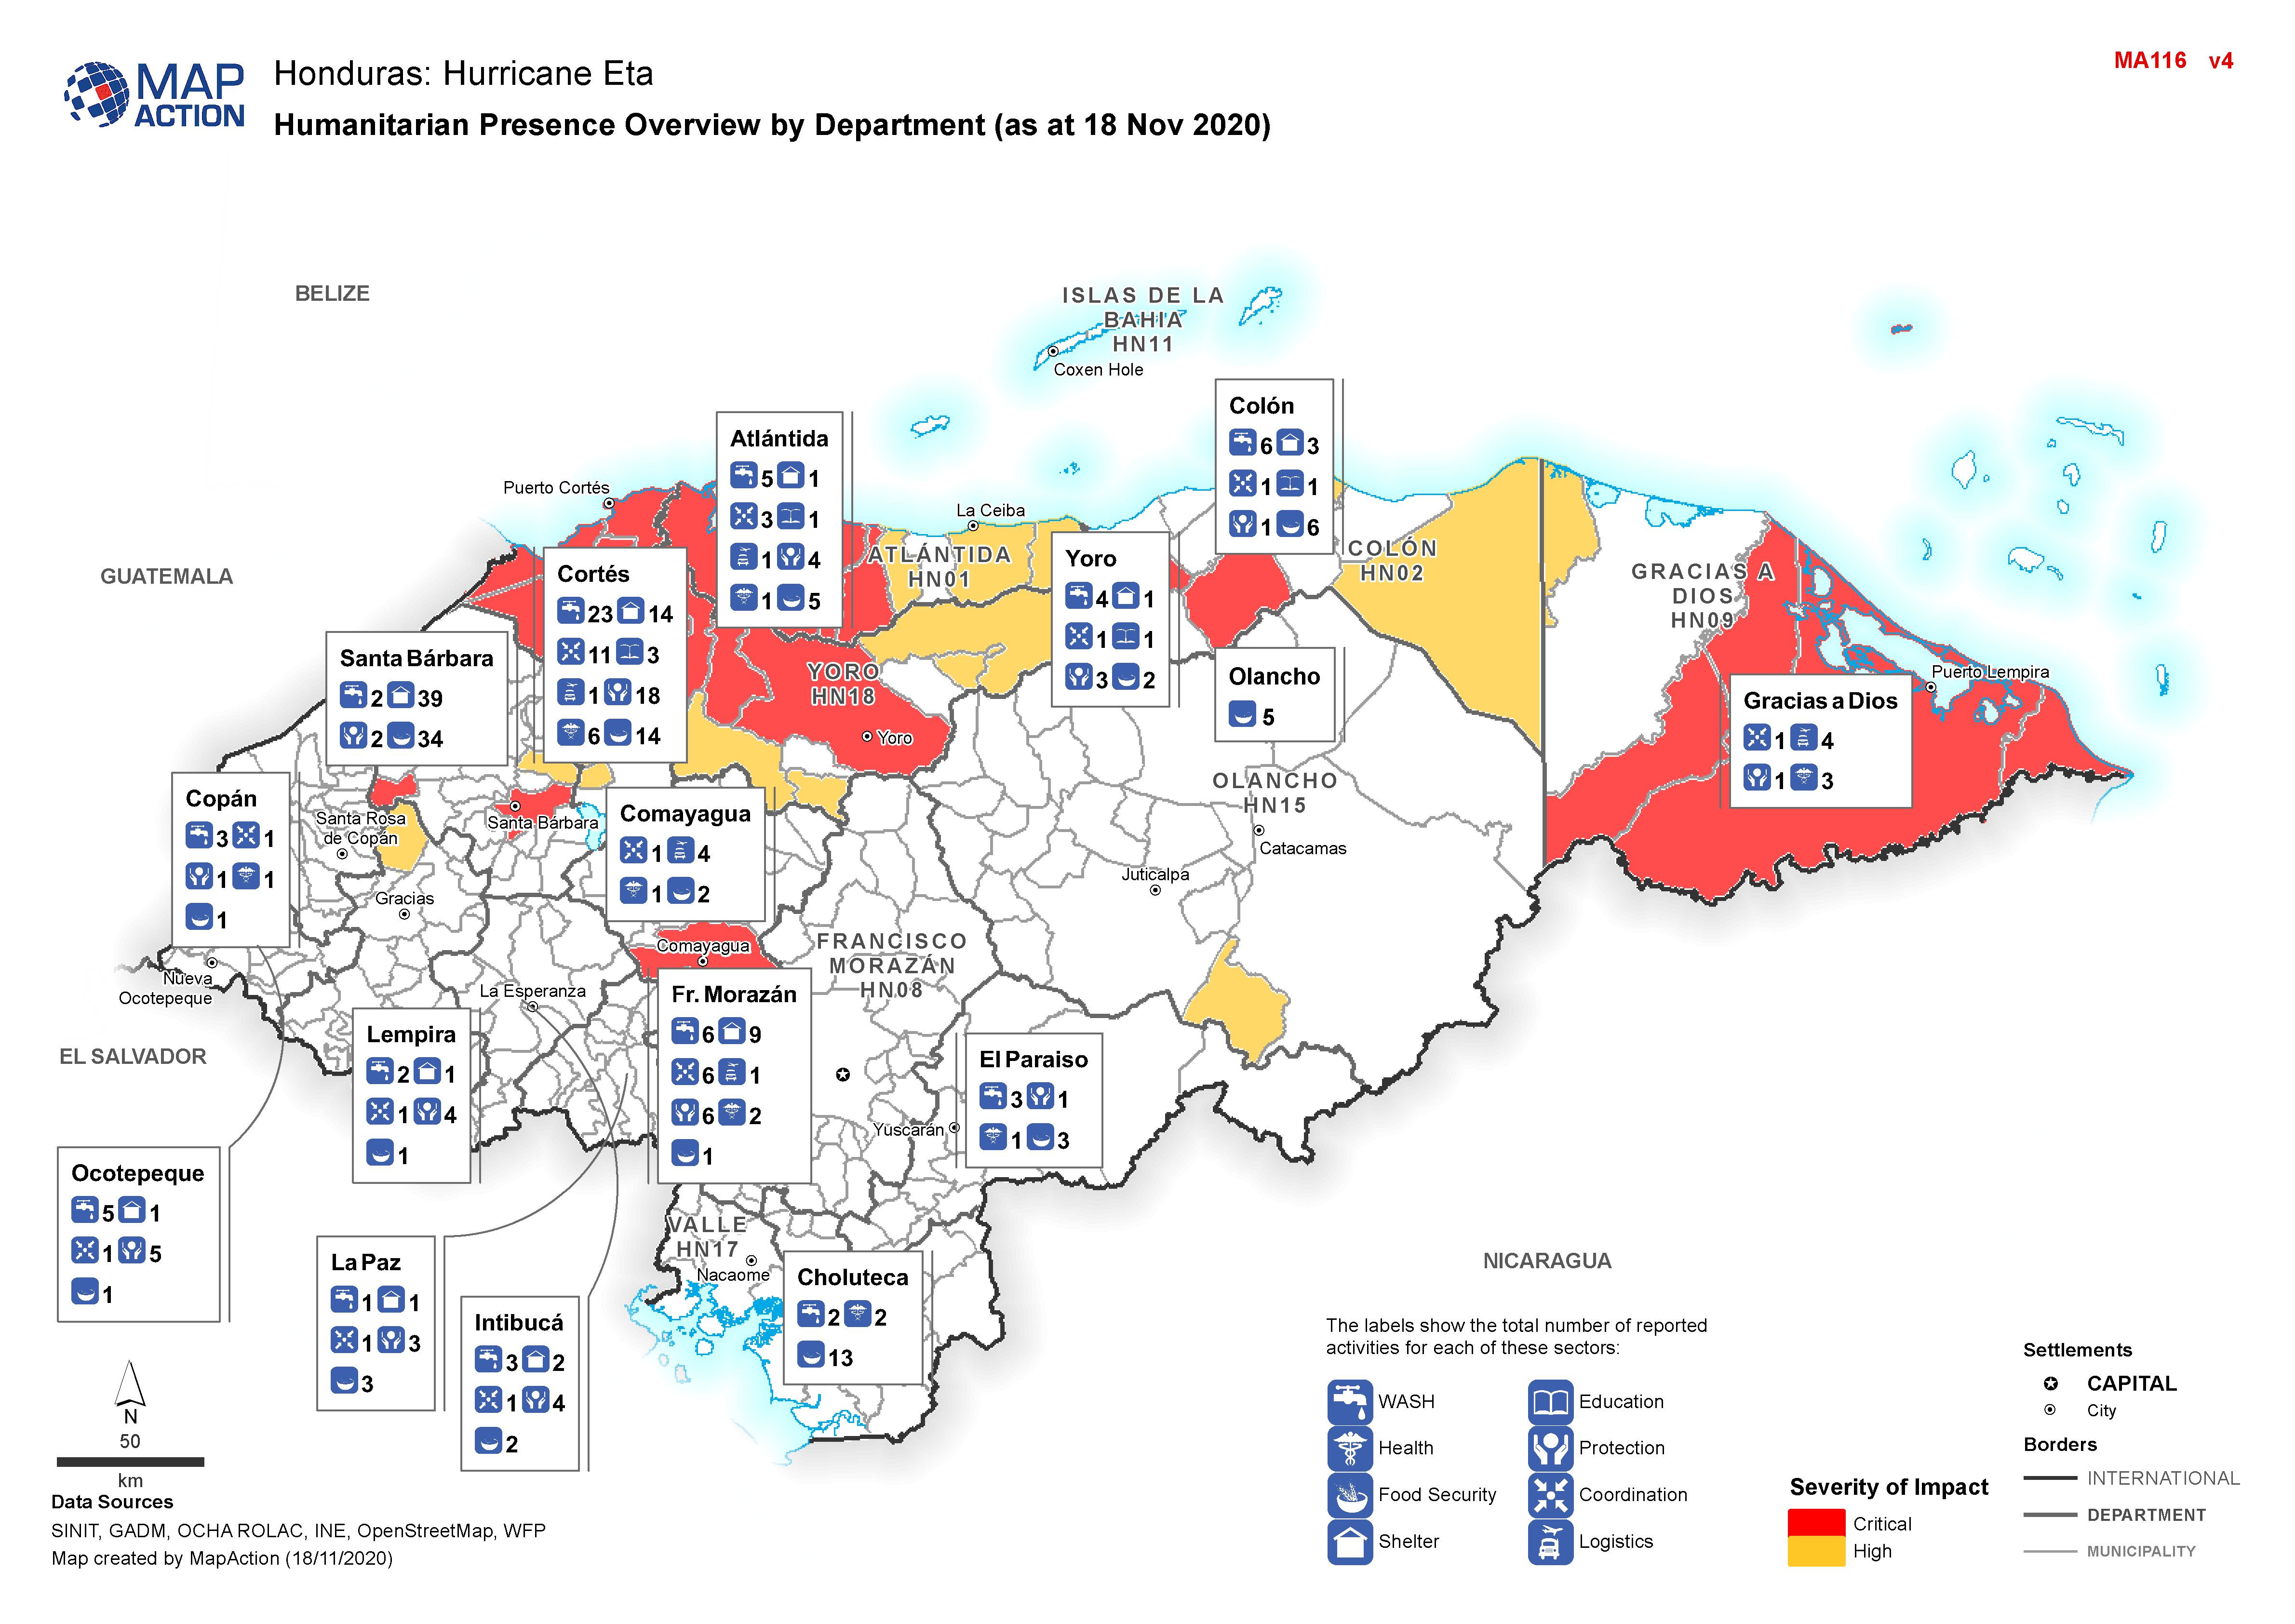
Honduras: Humanitarian Presence Overview by Department (as at 18 Nov 2020)
Map shows the number of reported activities per Sector per Department in Honduras. Critical and High priority response areas are also shown. -

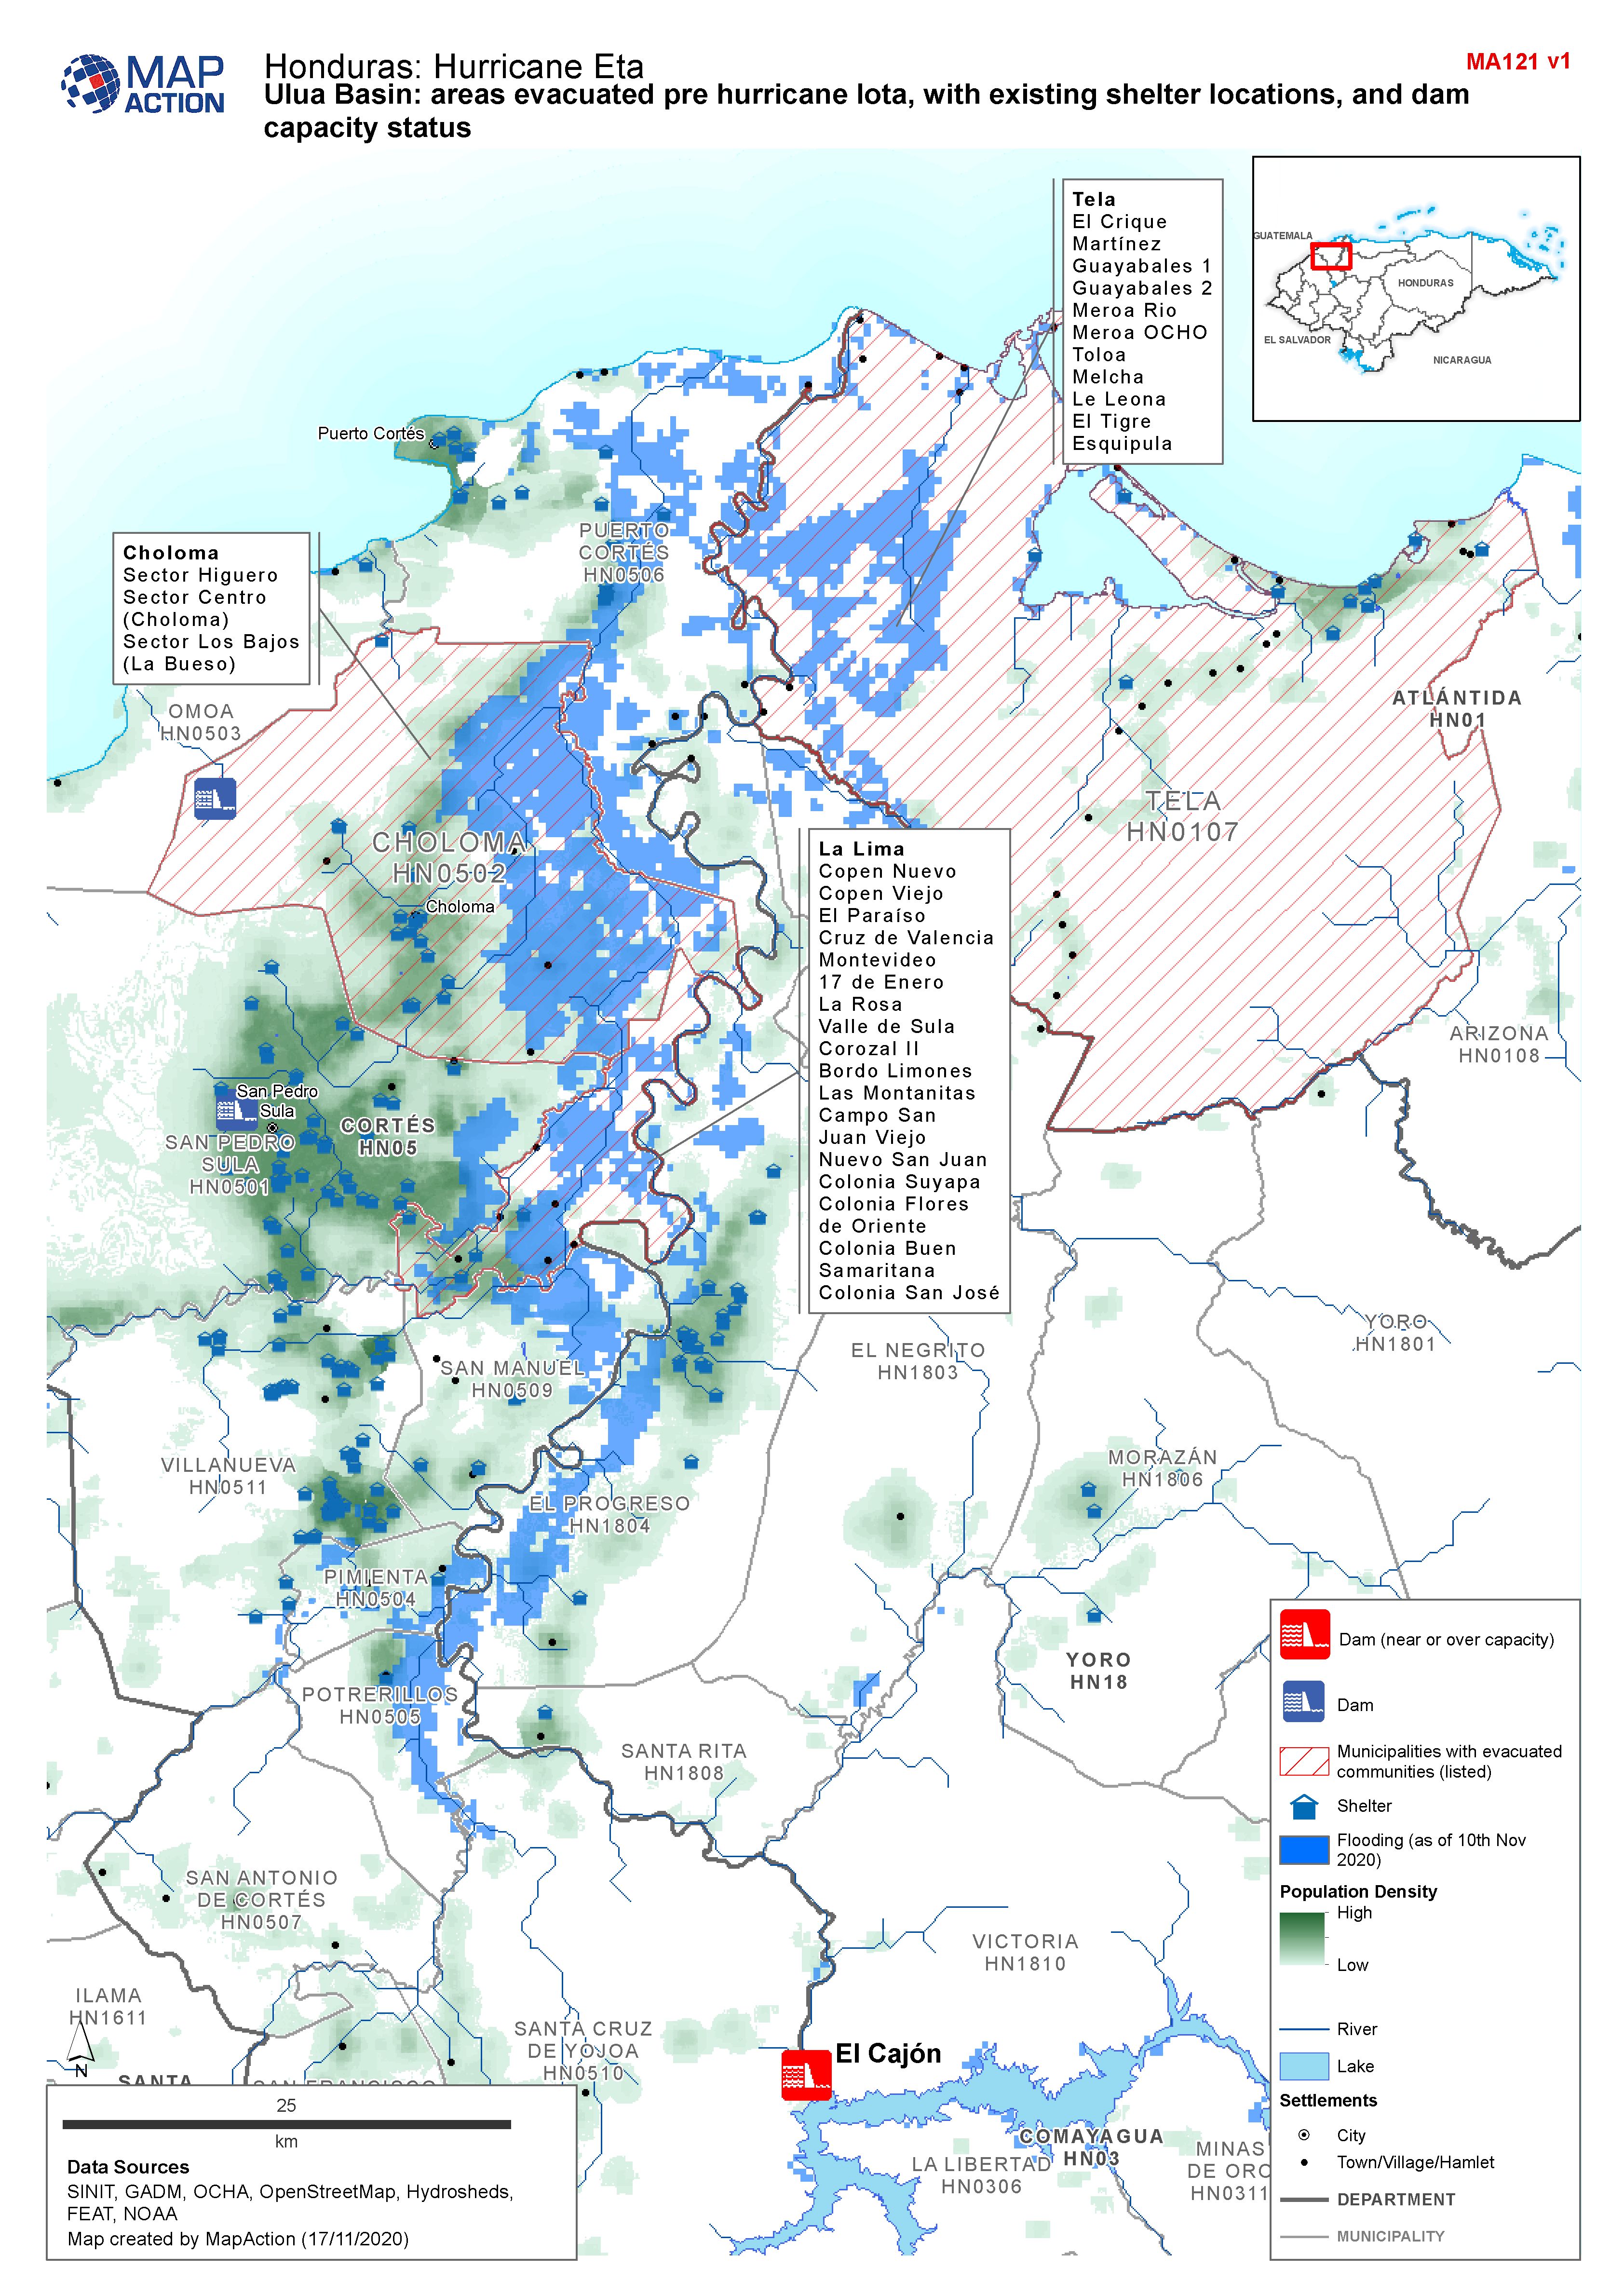
Honduras, Ulua Basin: areas evacuated pre Hurricane Iota, with existing shelt...
Map shows communities evacuated pre hurricane Iota, and existing shelter locations. Population density and capacity status of dams are also shown. -
Honduras: Humanitarian Presence: Who is doing What in Department (as at 16th ...
Map shows the number of reported activities per Sector, and who is delivering them, per Department in Honduras. Critical and High priority response areas and satellite derived... -
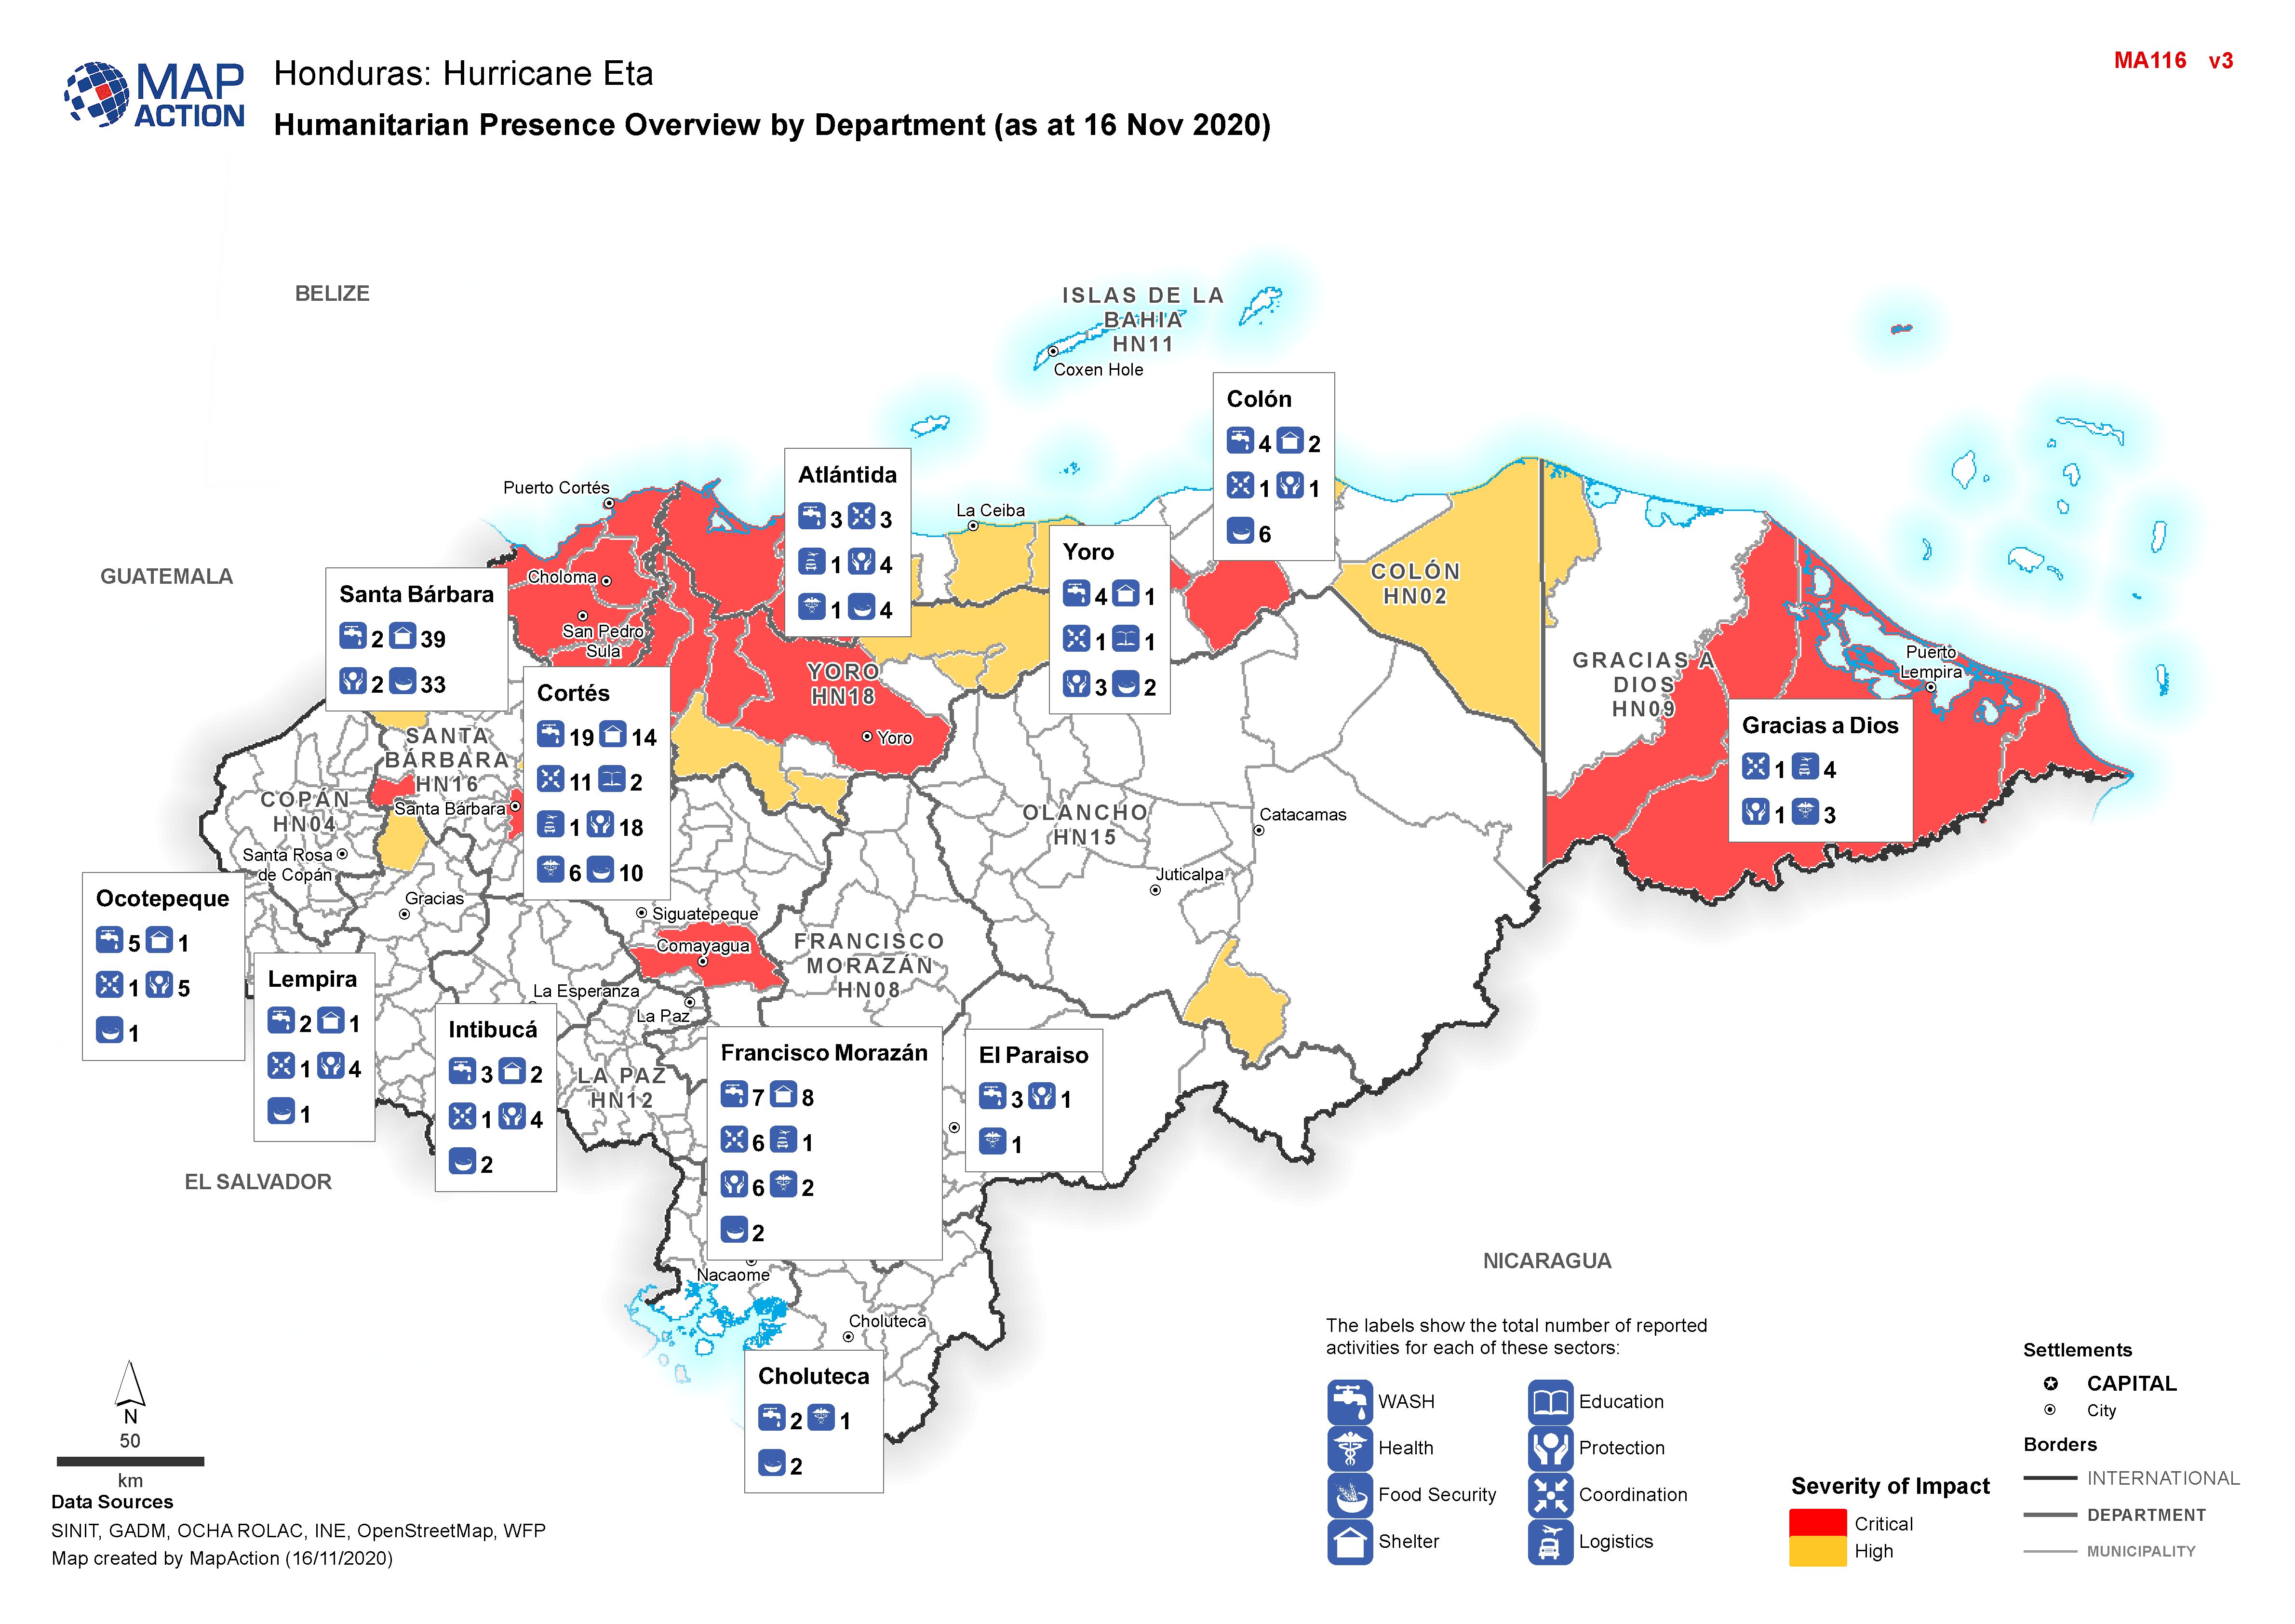
Honduras: Humanitarian Presence Overview by Department (as at 16 Nov 2020)
Map shows the number of reported activities per Sector per Department in Honduras. Critical and High priority response areas are also shown. -
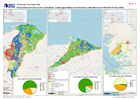
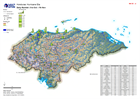
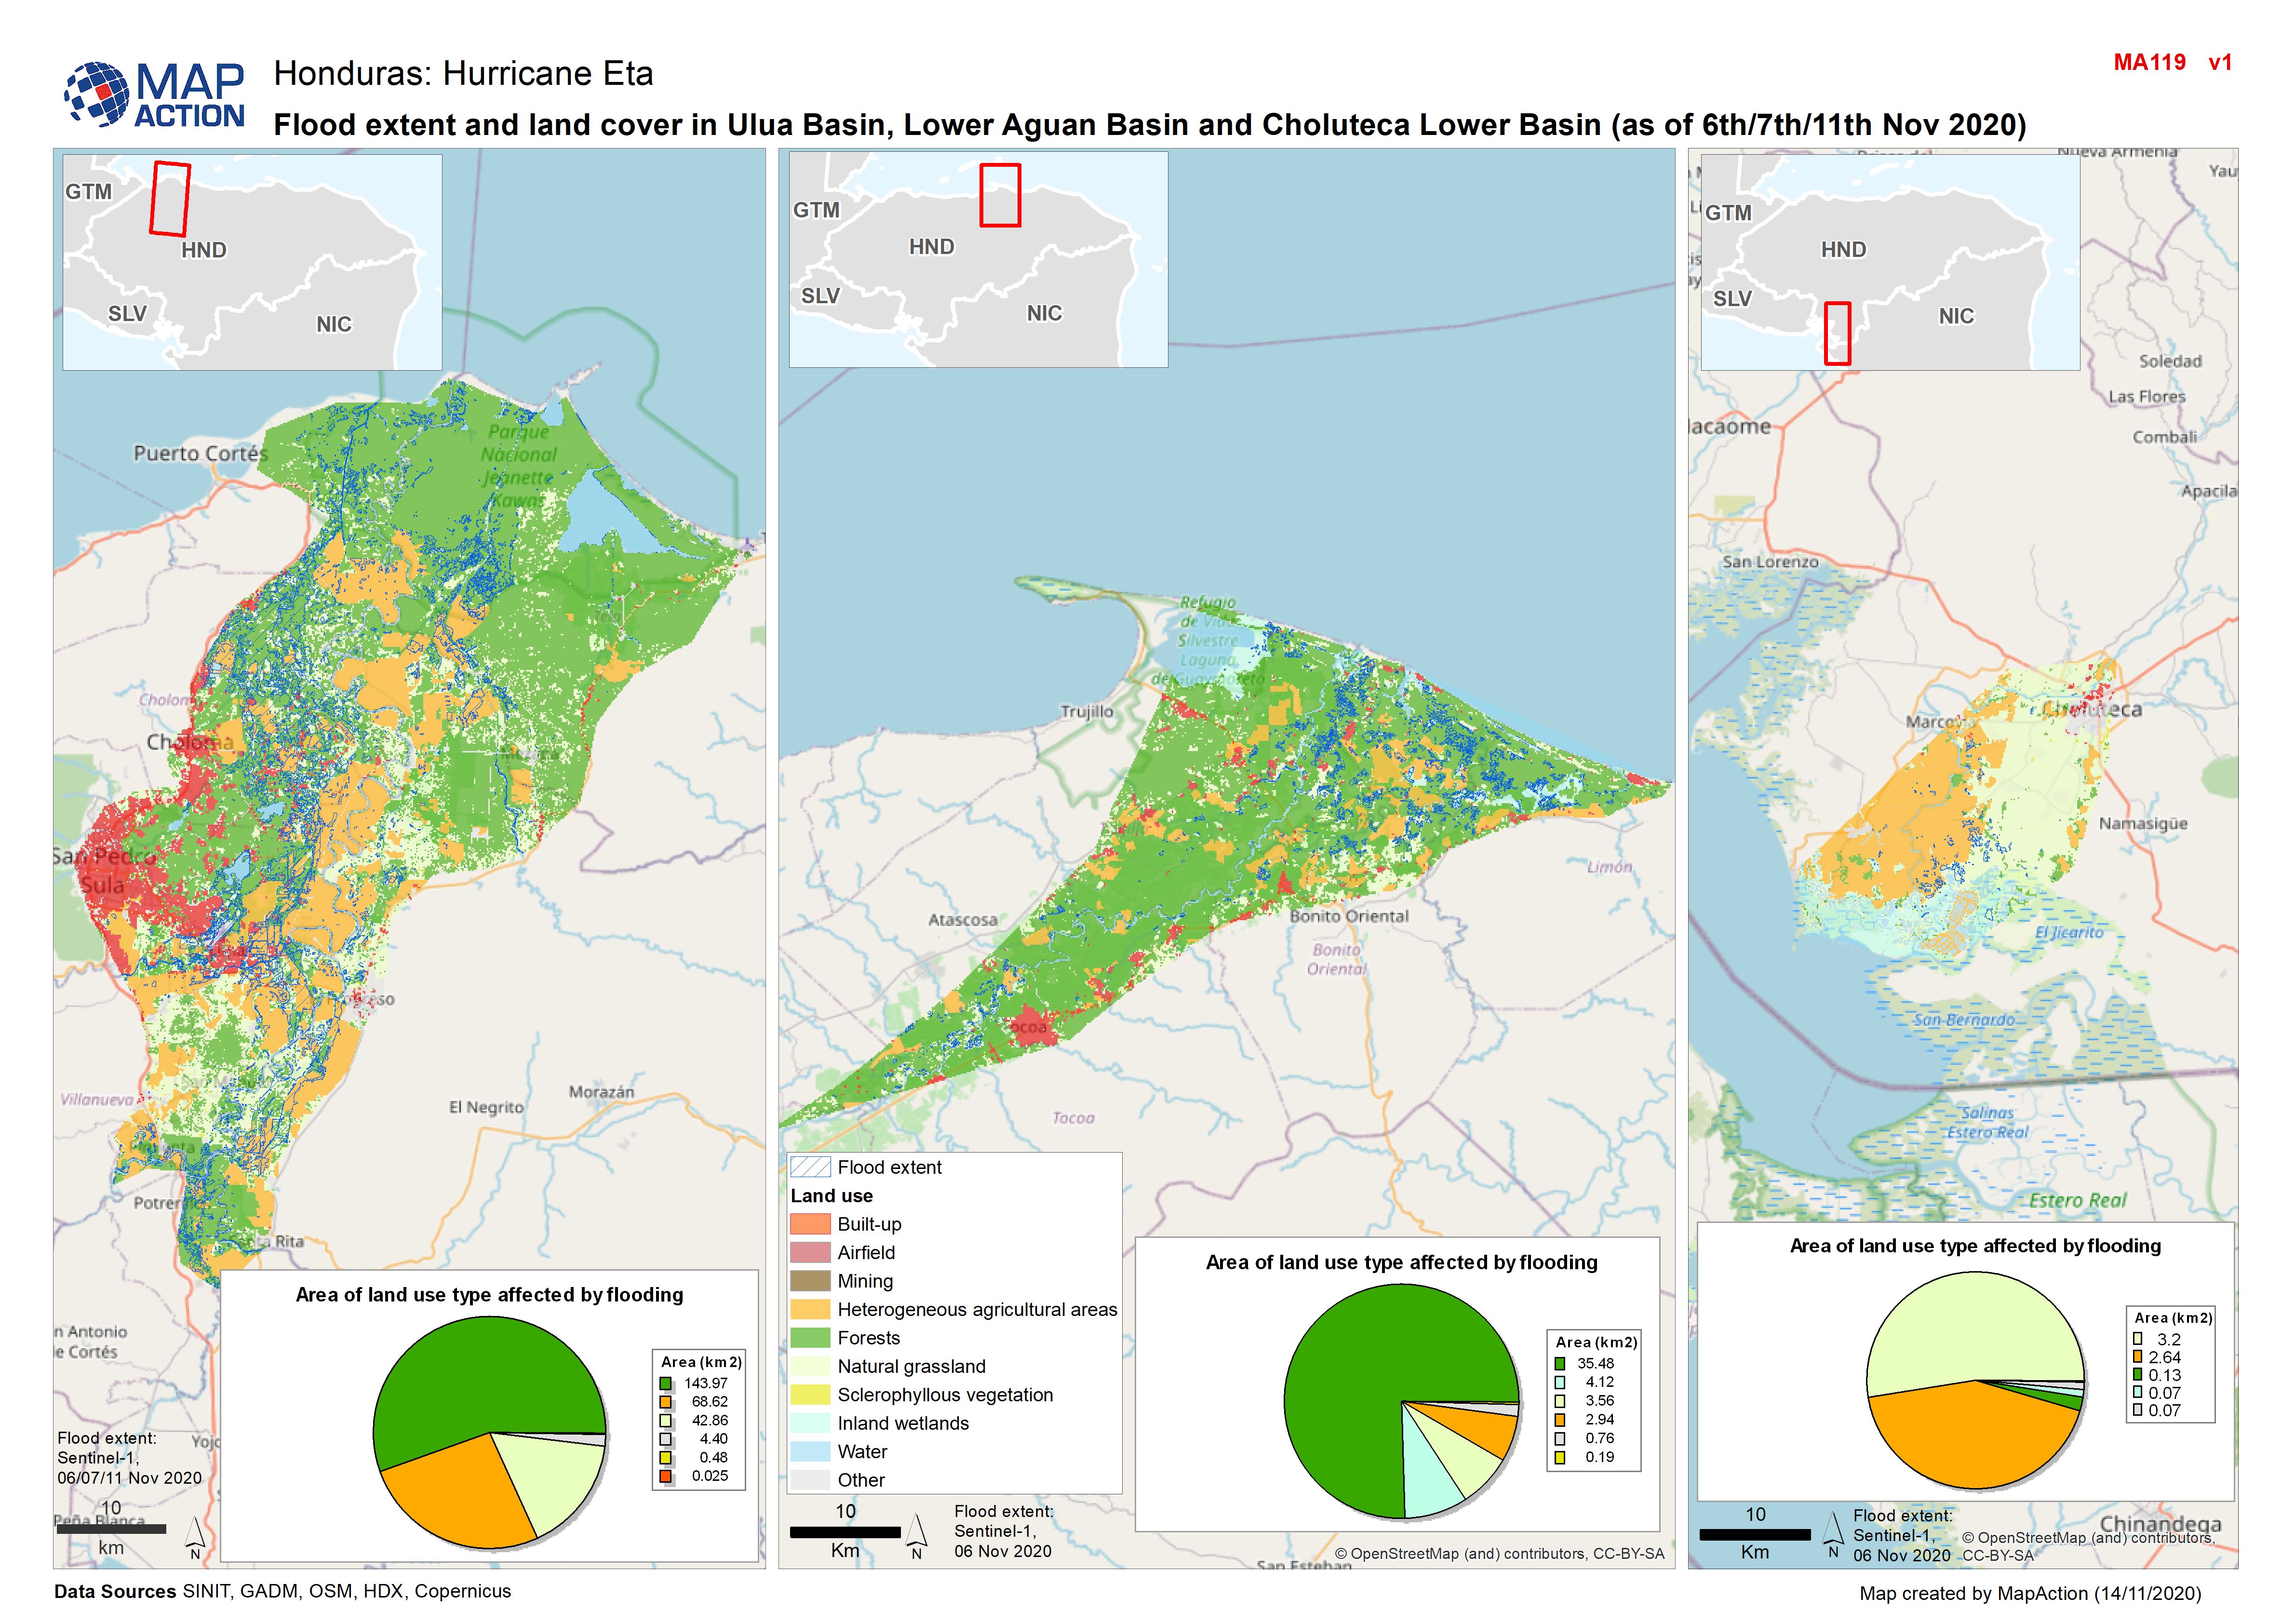
Honduras: Flood extent and land cover in Ulua Basin, Lower Aguan Basin and Ch...
Map shows flood extents and land use in Ulua Basin, Lower Aguan Basin and Choluteca Lower Basin (as at 6th/11th Nov 2020) -
Honduras: Damaged Infrastructure in each Municipality - Department (as at 16 ...
Honduras, Damaged Infrastructure as of 16th Nov 2020 (Displayed per Admin 1 / Department) -
Honduras: Destroyed & Damaged Houses in each Municipality - Department (as at...
Honduras, Destroyed & Damaged Houses per Municipality as of 16th Nov 2020 -
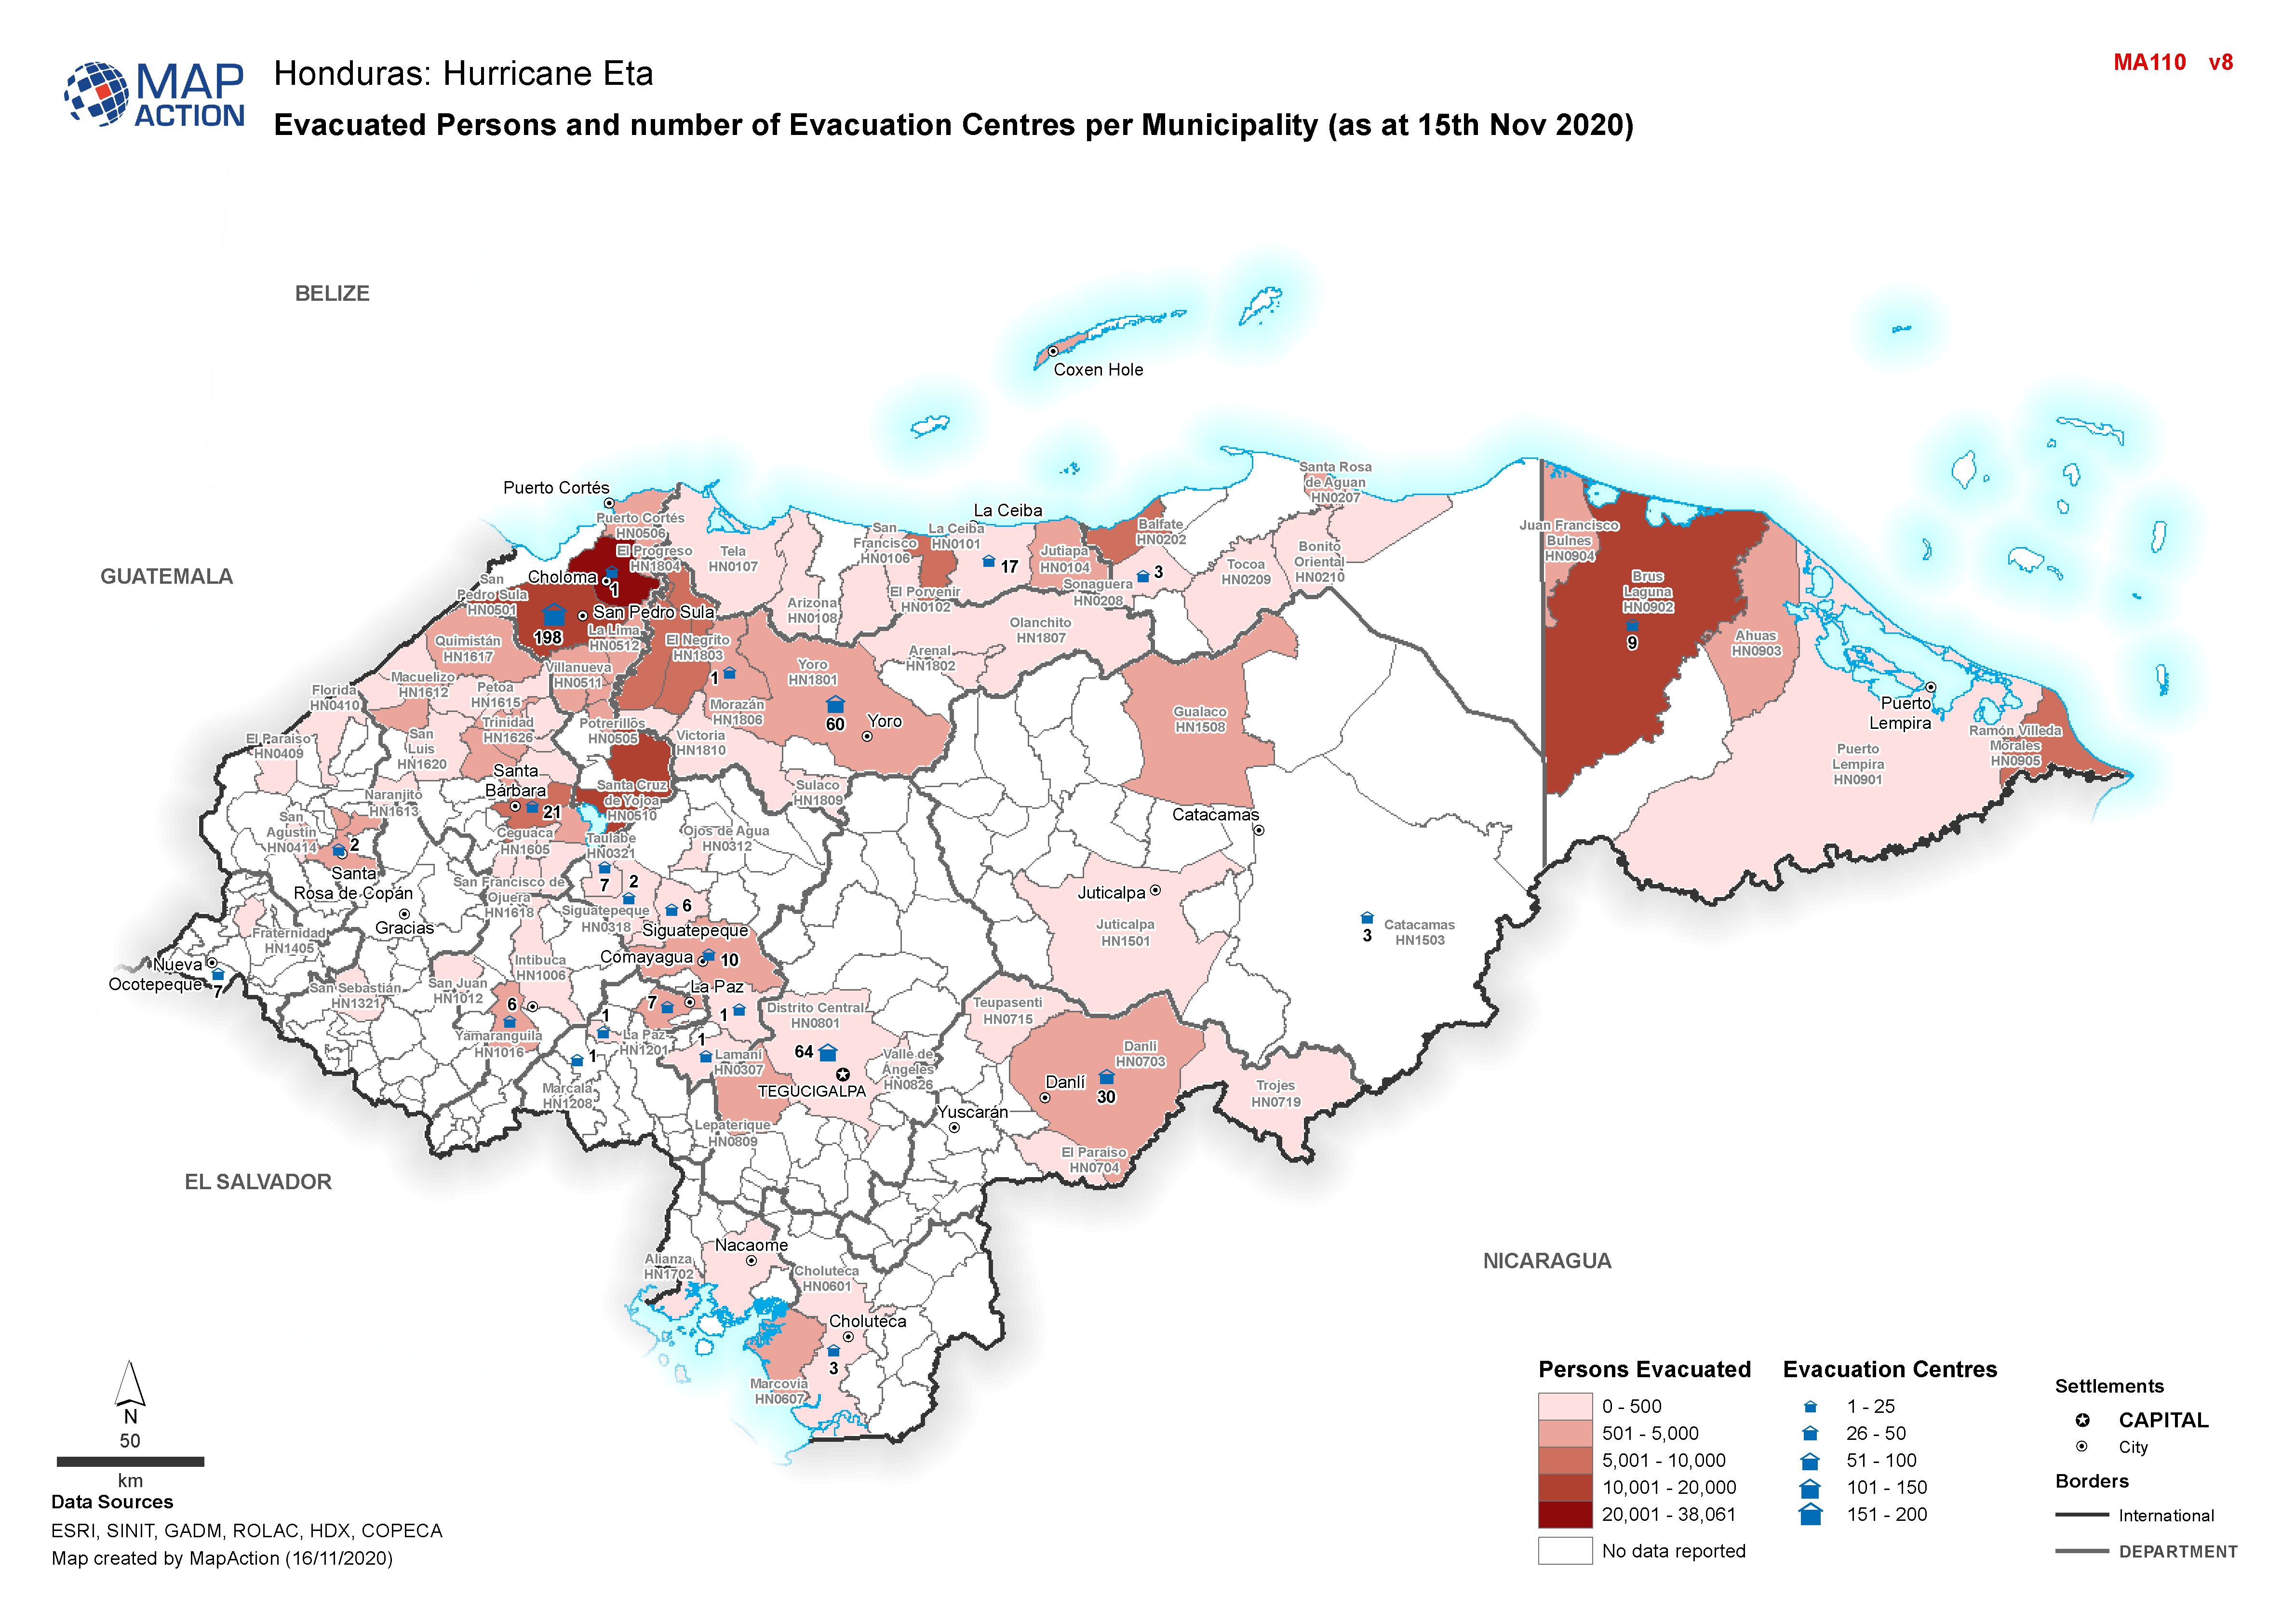
Honduras: Evacuated Persons and number of Evacuation Centres per Municipality...
Map shows evacuated persons and number of evacuation centres per Municipality (as at 16th Nov 2020) -

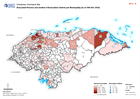
Honduras: Affected Population as at Nov 16th as percentage of baseline popula...
Map shows affected population as at Nov 16th as percentage of baseline population (2020 projected) per Municipality. -
Honduras: Destroyed & Damaged Houses in each Municipality - Department (as at...
Honduras, Destroyed & Damaged Houses per Municipality as of 15th Nov 2020 -
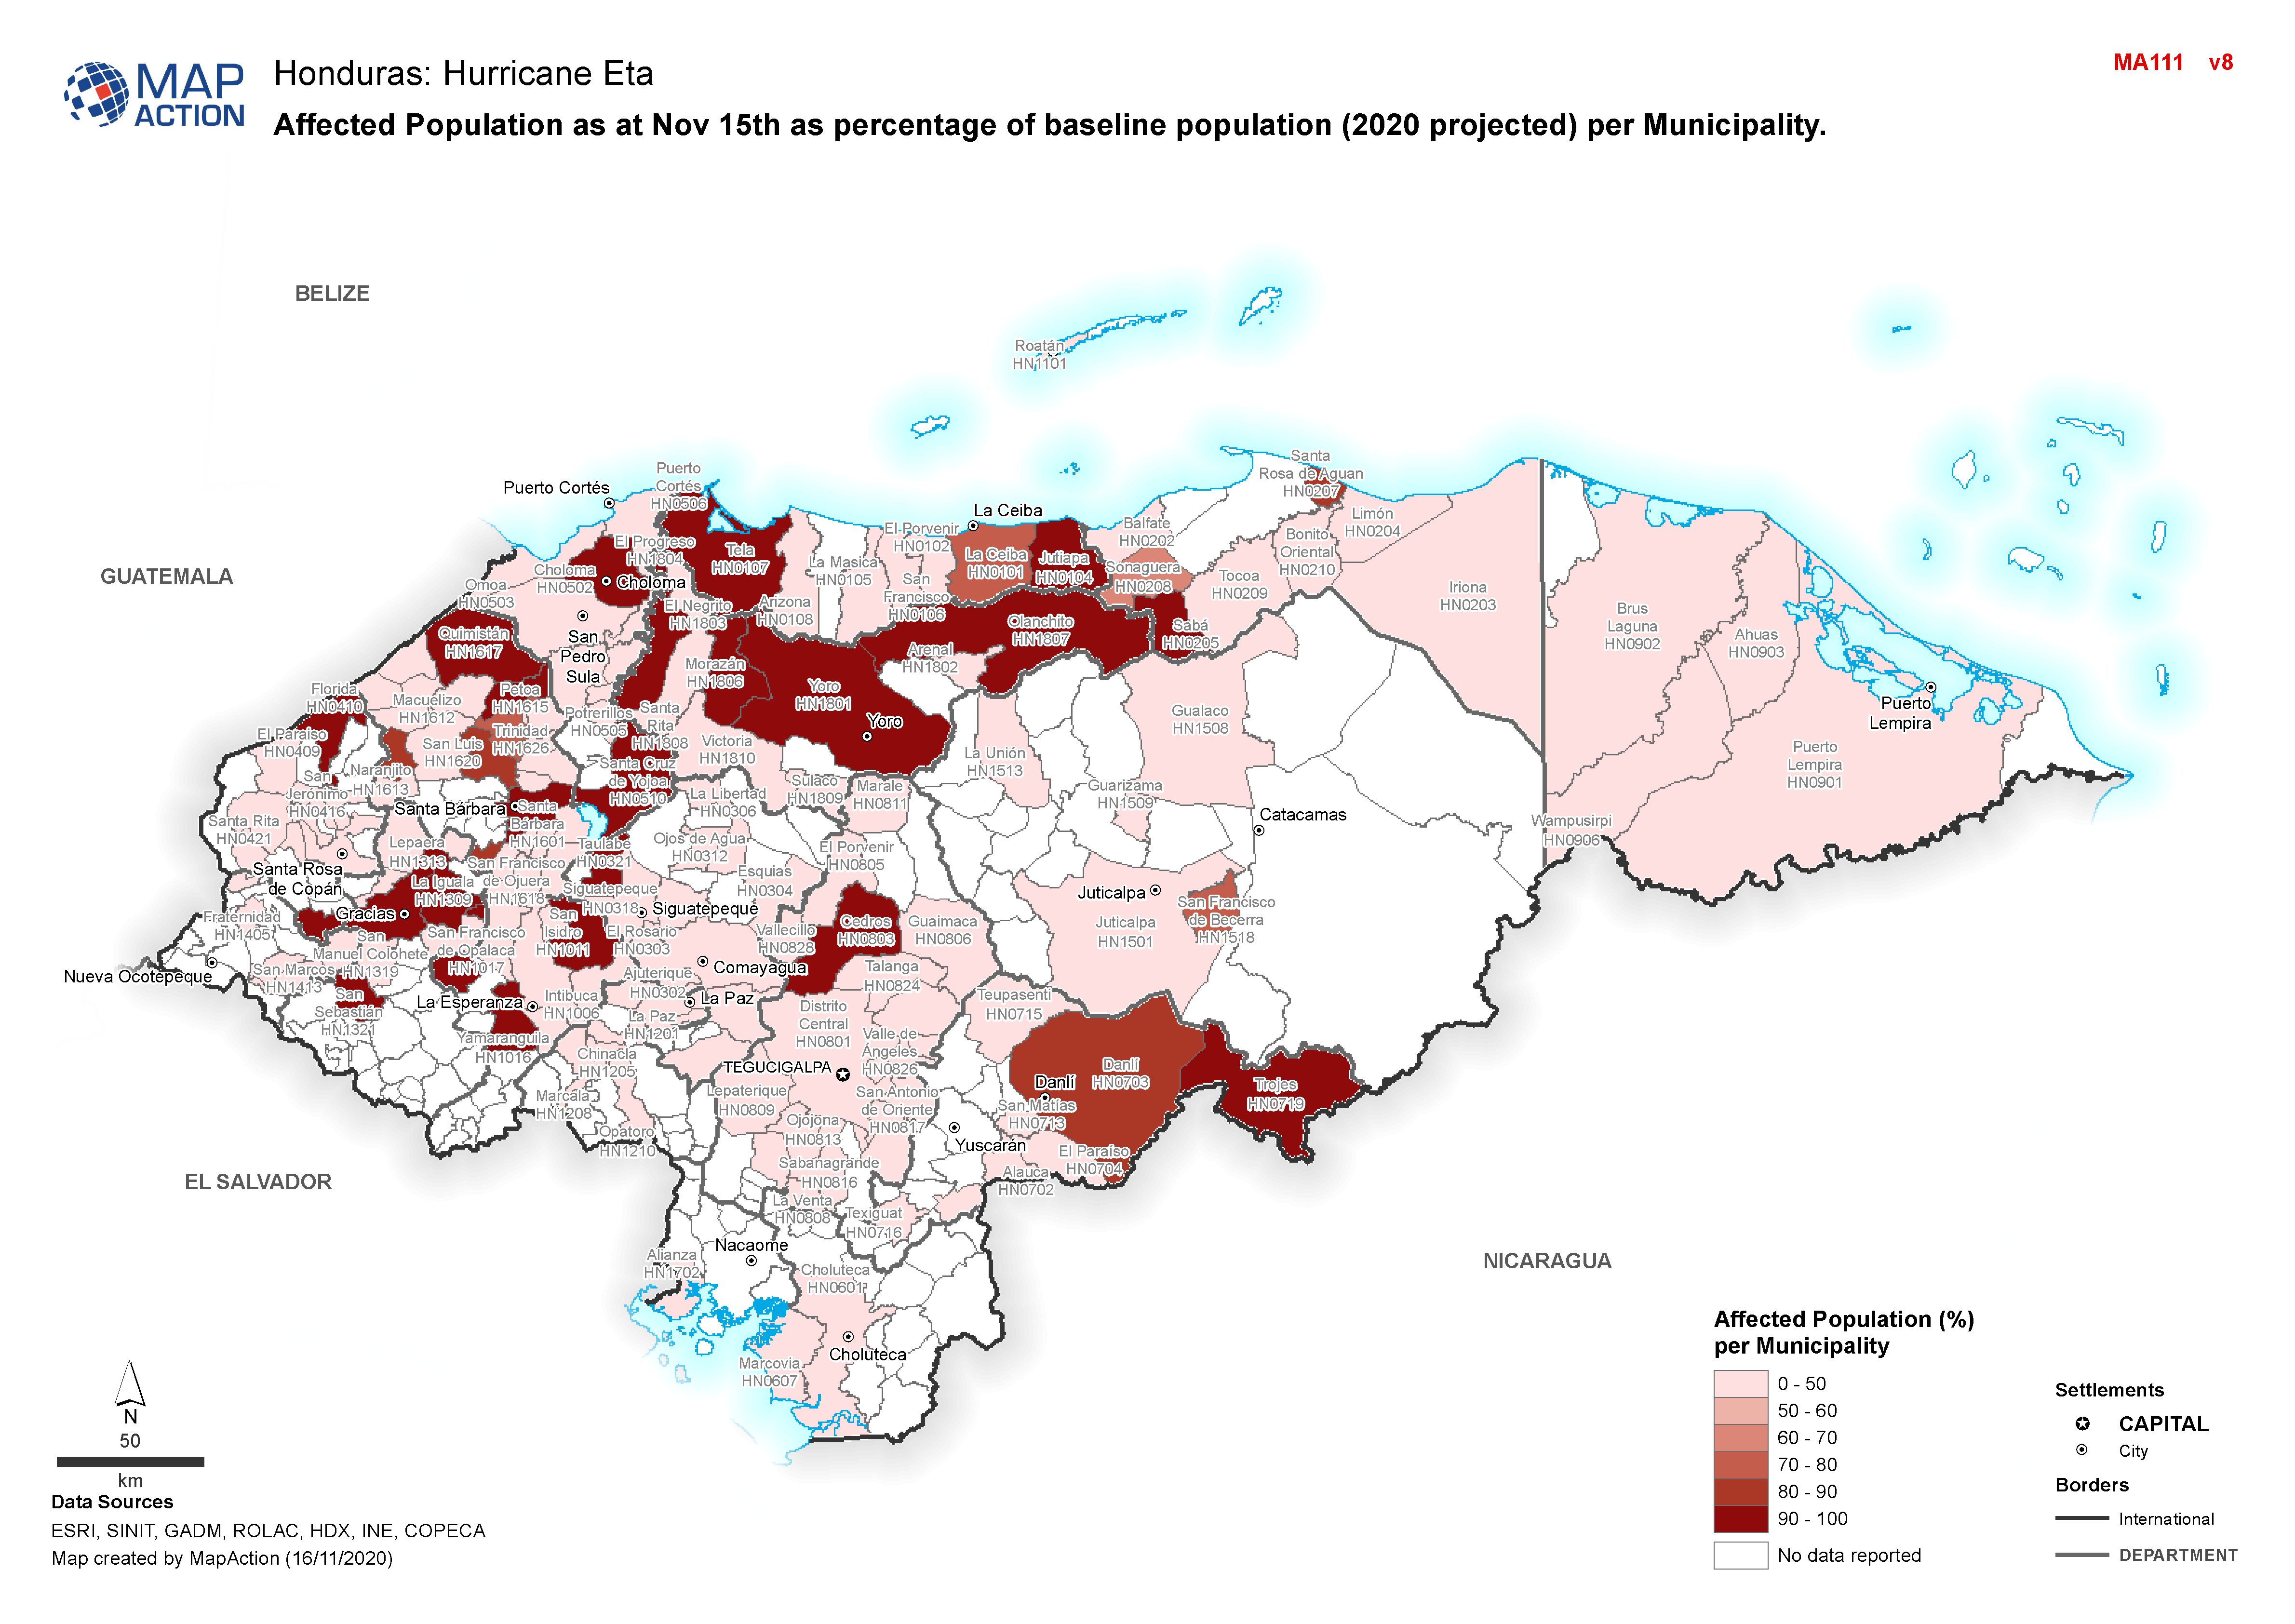
Honduras: Affected Population as at Nov 15th as percentage of baseline popula...
Map shows affected population as at Nov 15th as percentage of baseline population (2020 projected) per Municipality. -
Honduras: Damaged Infrastructure in each Municipality - Department (as at 15 ...
Honduras, Damaged Infrastructure as of 15th Nov 2020 (Displayed per Admin 1 / Department) -

Honduras: Evacuated Persons and number of Evacuation Centres per Municipality...
Map shows evacuated persons and number of evacuation centres per Municipality (as at 14th Nov 2020) -
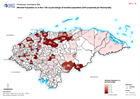
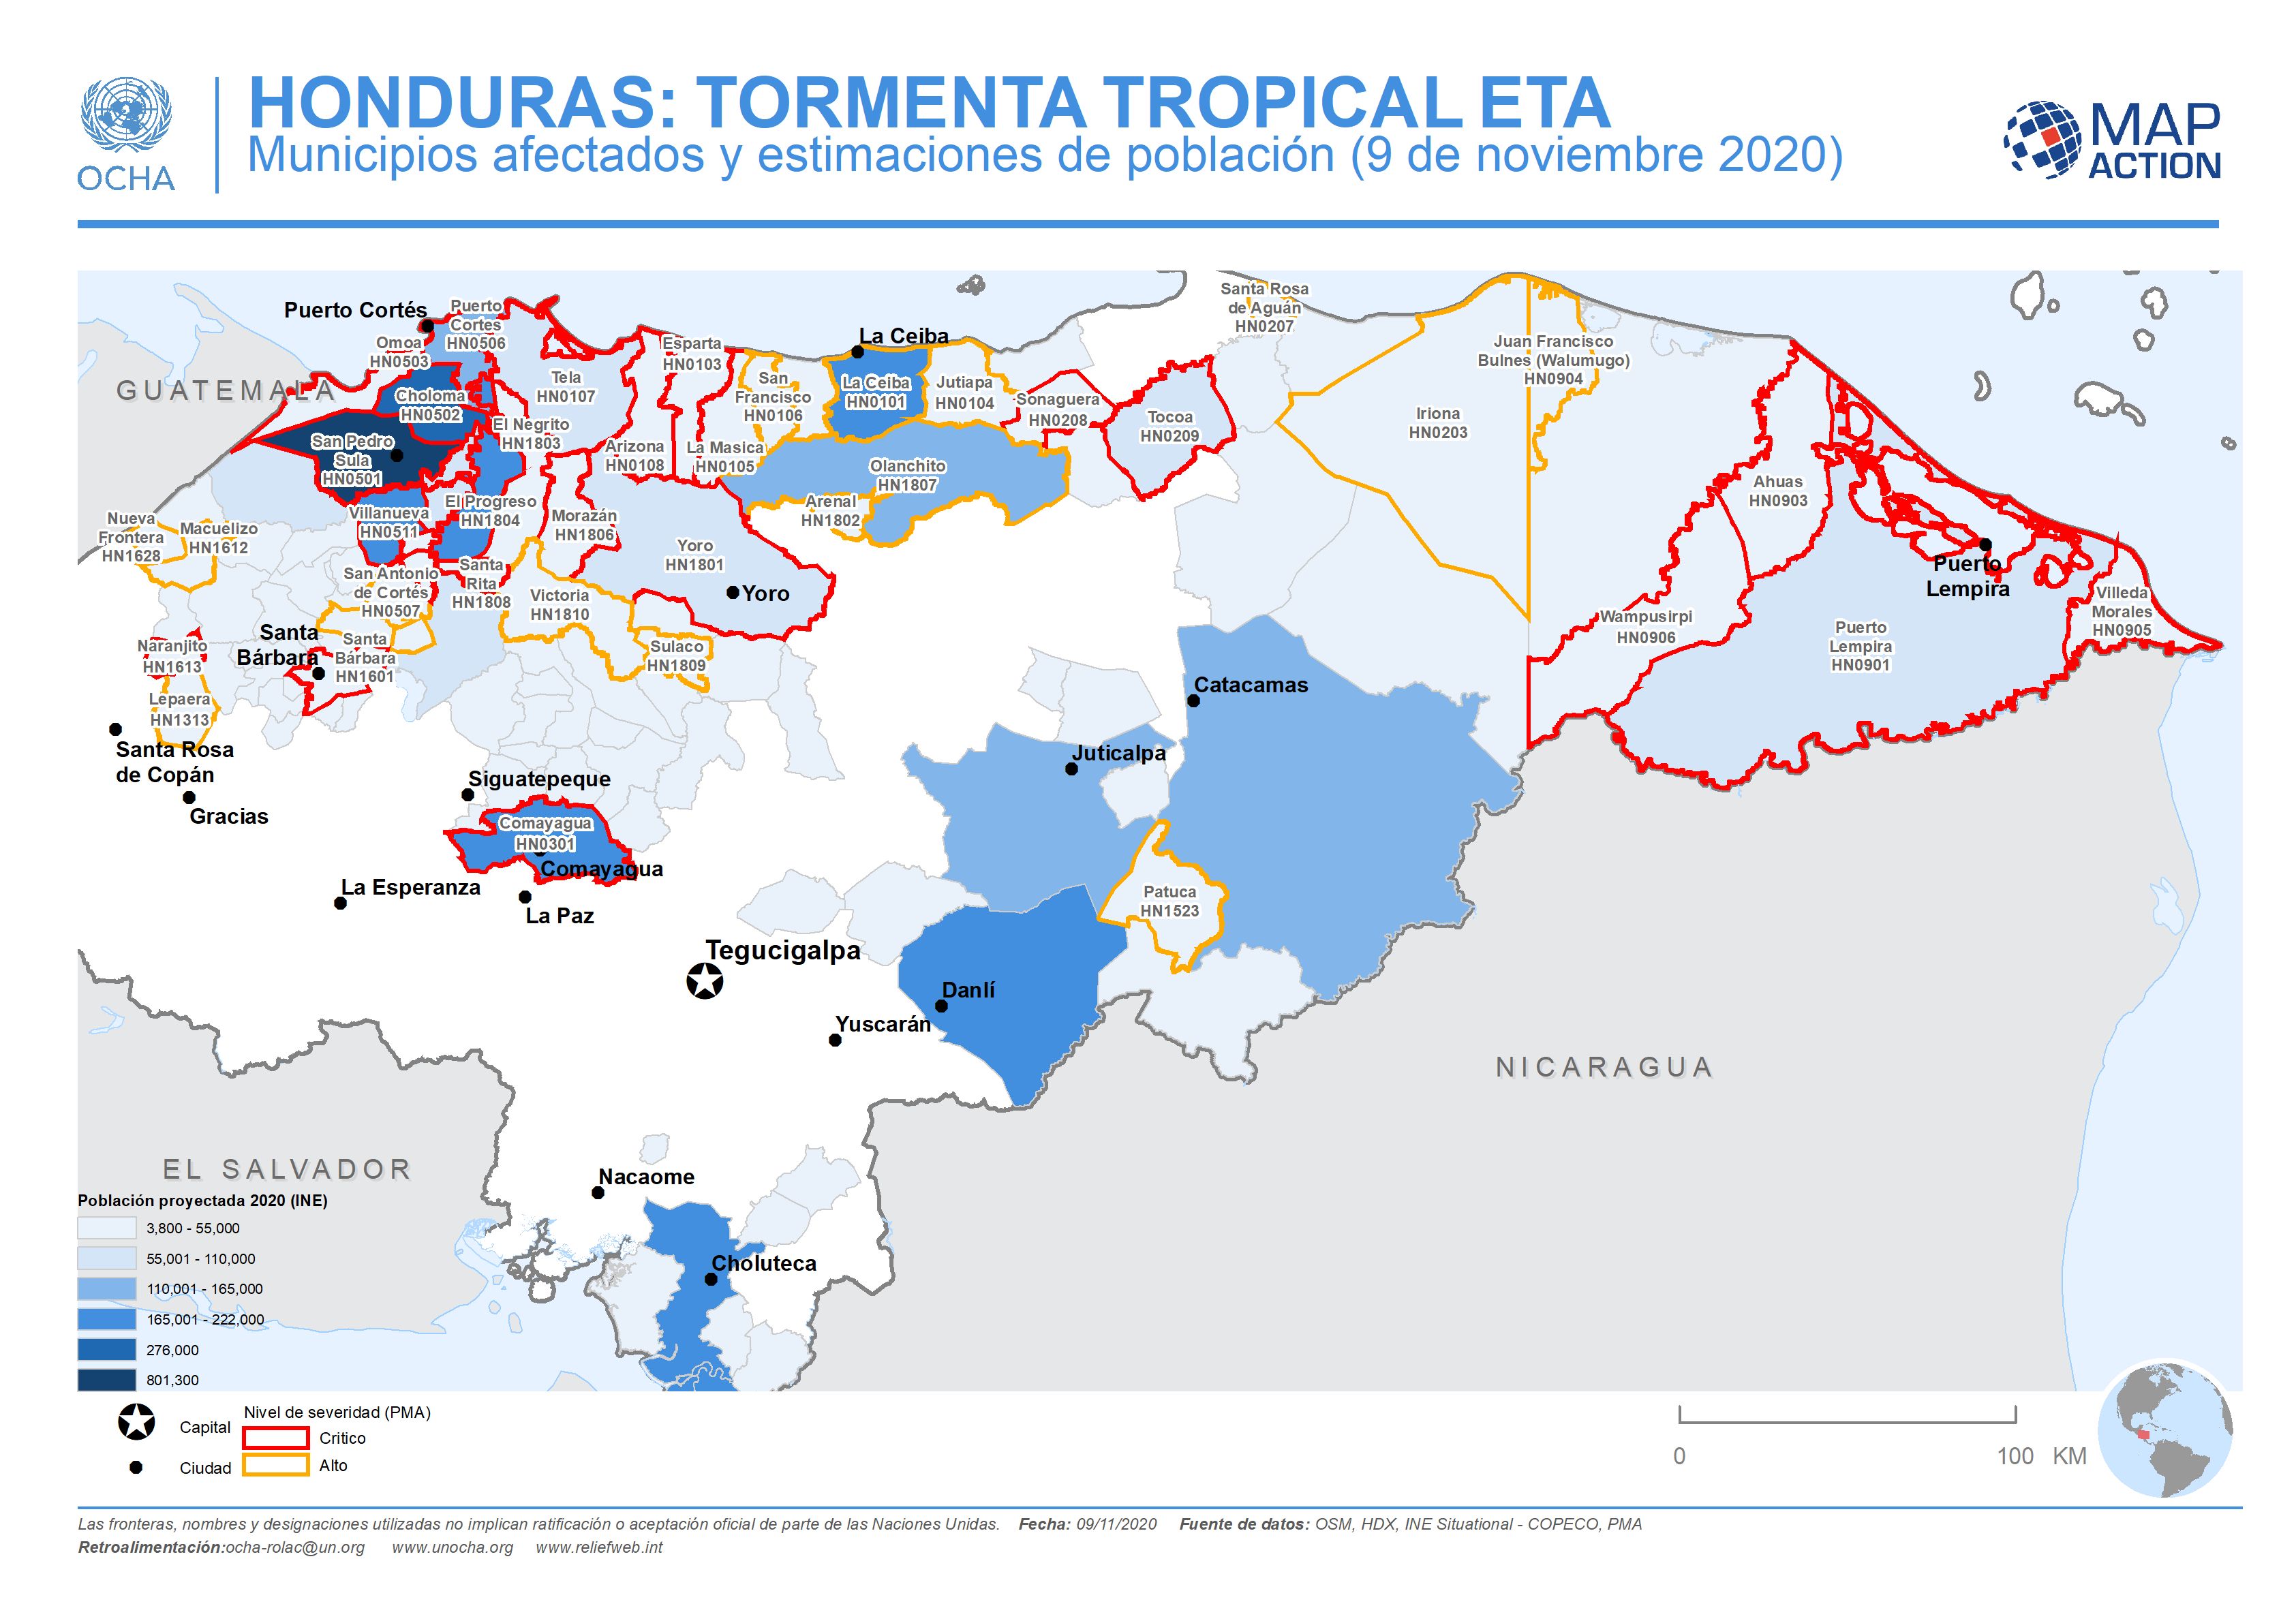
Honduras: Municipios afectados y estimaciones de población (9 de noviembre 2...
This map shows the affected administration level 2 municipalities for Honduras, with projected population 2020 (INE) and the level of severity (critical or high) for affected... -
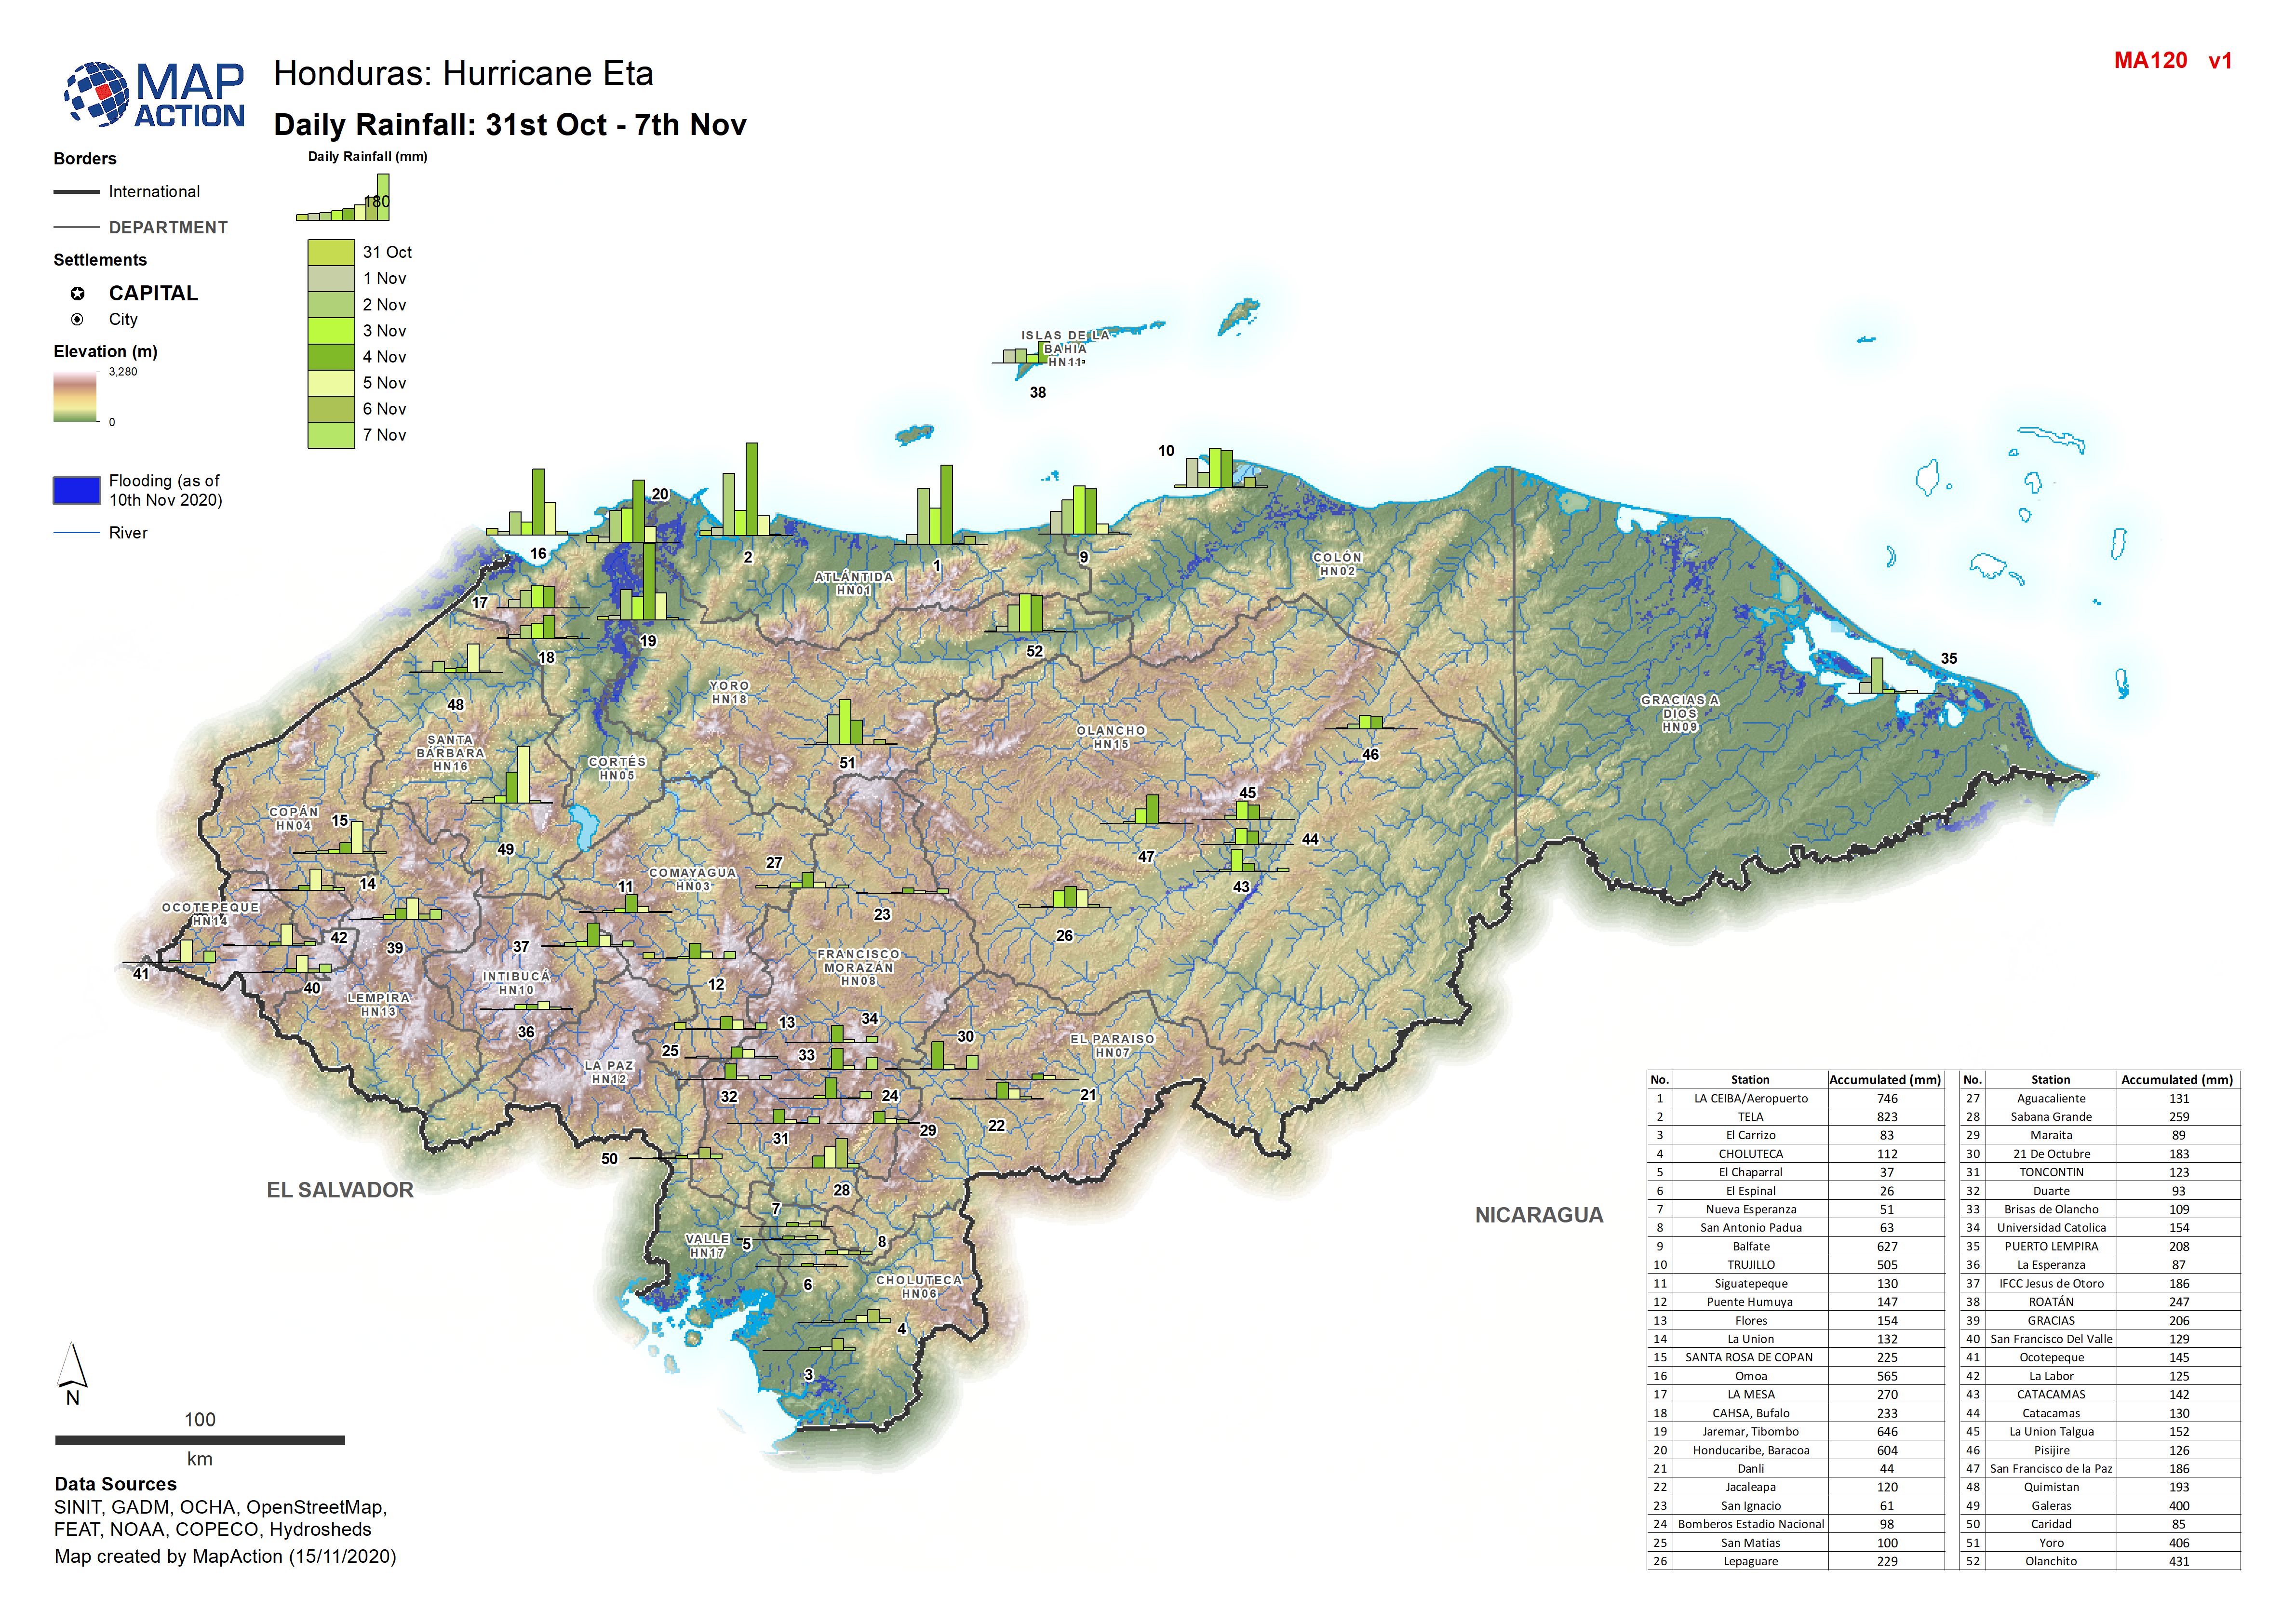
Honduras: Daily Rainfall: 31st Oct - 7th Nov 2020
Honduras: Daily Rainfall: 31st Oct - 7th Nov by weather station -

Honduras: Humanitarian Presence Overview by Department (as at 14 Nov 2020)
Map shows the number of reported activities per Sector per Department in Honduras. Critical and High priority response areas are also shown. -
Honduras: Humanitarian Presence: Who is doing What by Department (as at 14th ...
Map shows the number of reported activities per Sector, and who is delivering them, per Department in Honduras. Critical and High priority response areas and satellite derived... -
Honduras: Destroyed & Damaged Houses in each Municipality - Department (as at...
Honduras, Destroyed & Damaged Houses per Municipality as of 14th Nov 2020