-
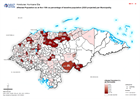
Honduras: Affected Population as at Nov 10th as percentage of baseline popula...
Map shows affected population as at Nov 10th as percentage of baseline population (2020 projected) per Municipality. -

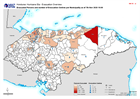
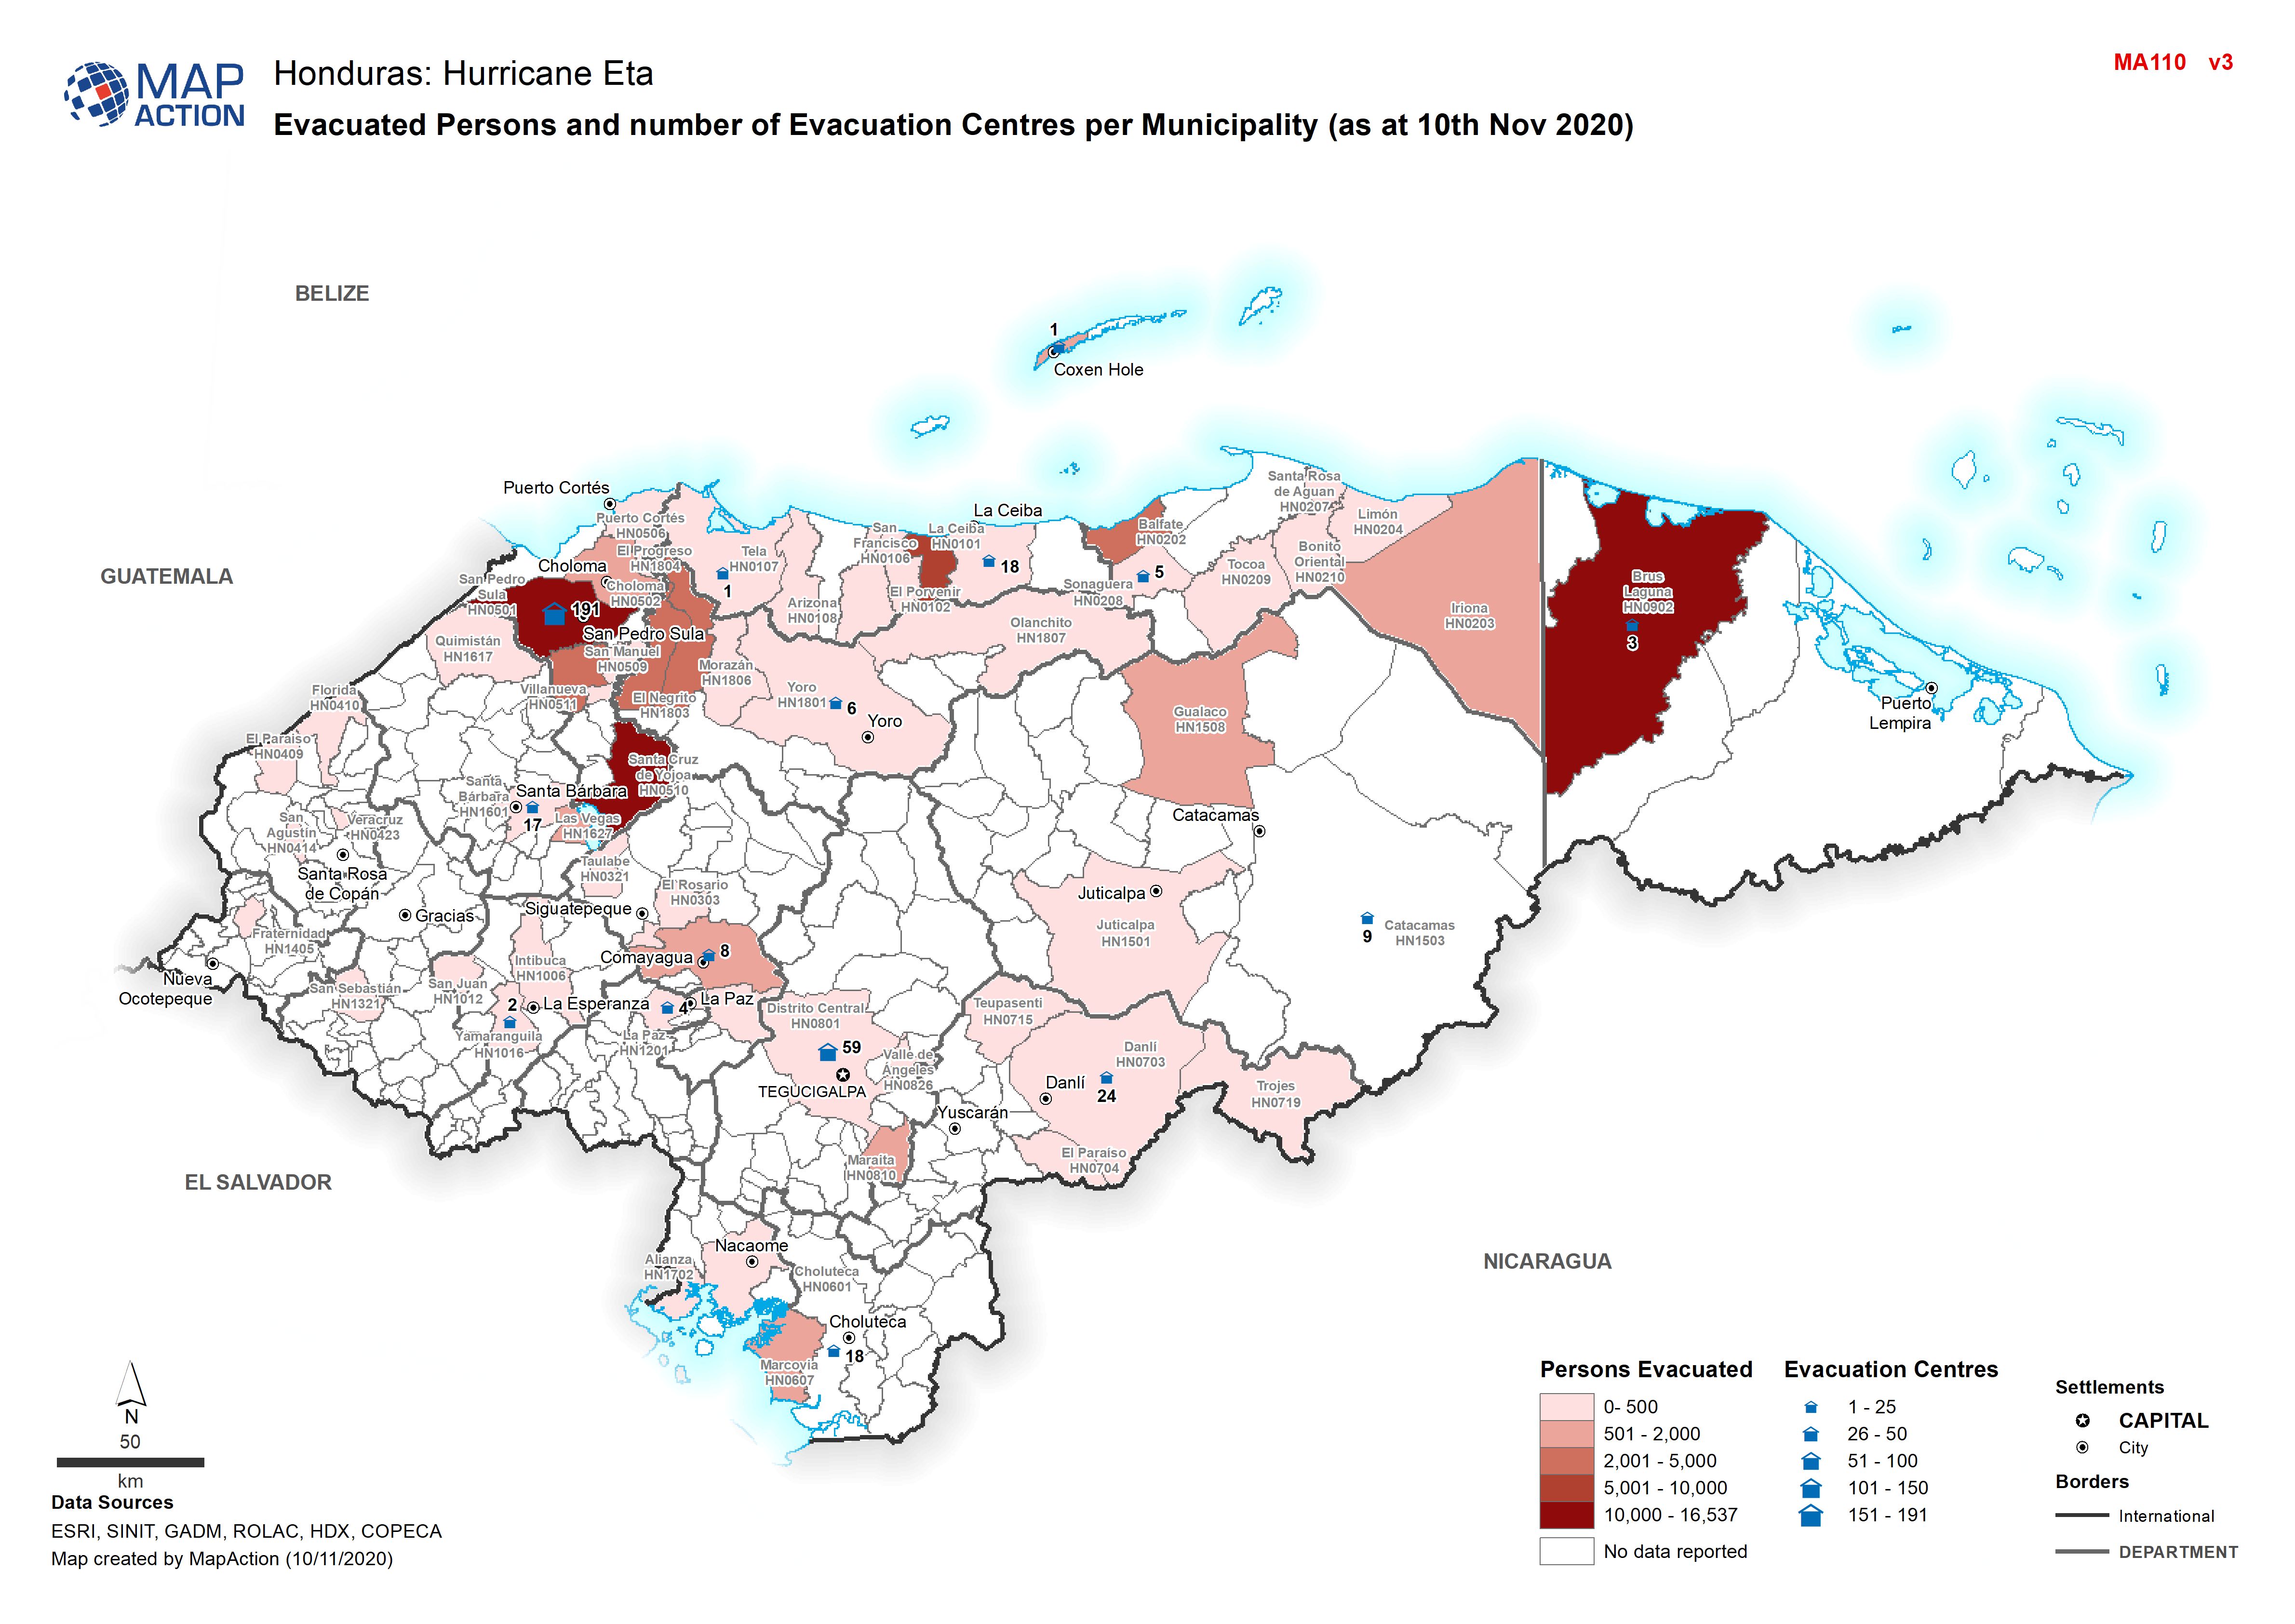
Honduras: Evacuated Persons and number of Evacuation Centres per Municipality...
Map shows evacuated persons and number of evacuation centres per Municipality (as at 10th Nov 2020) -

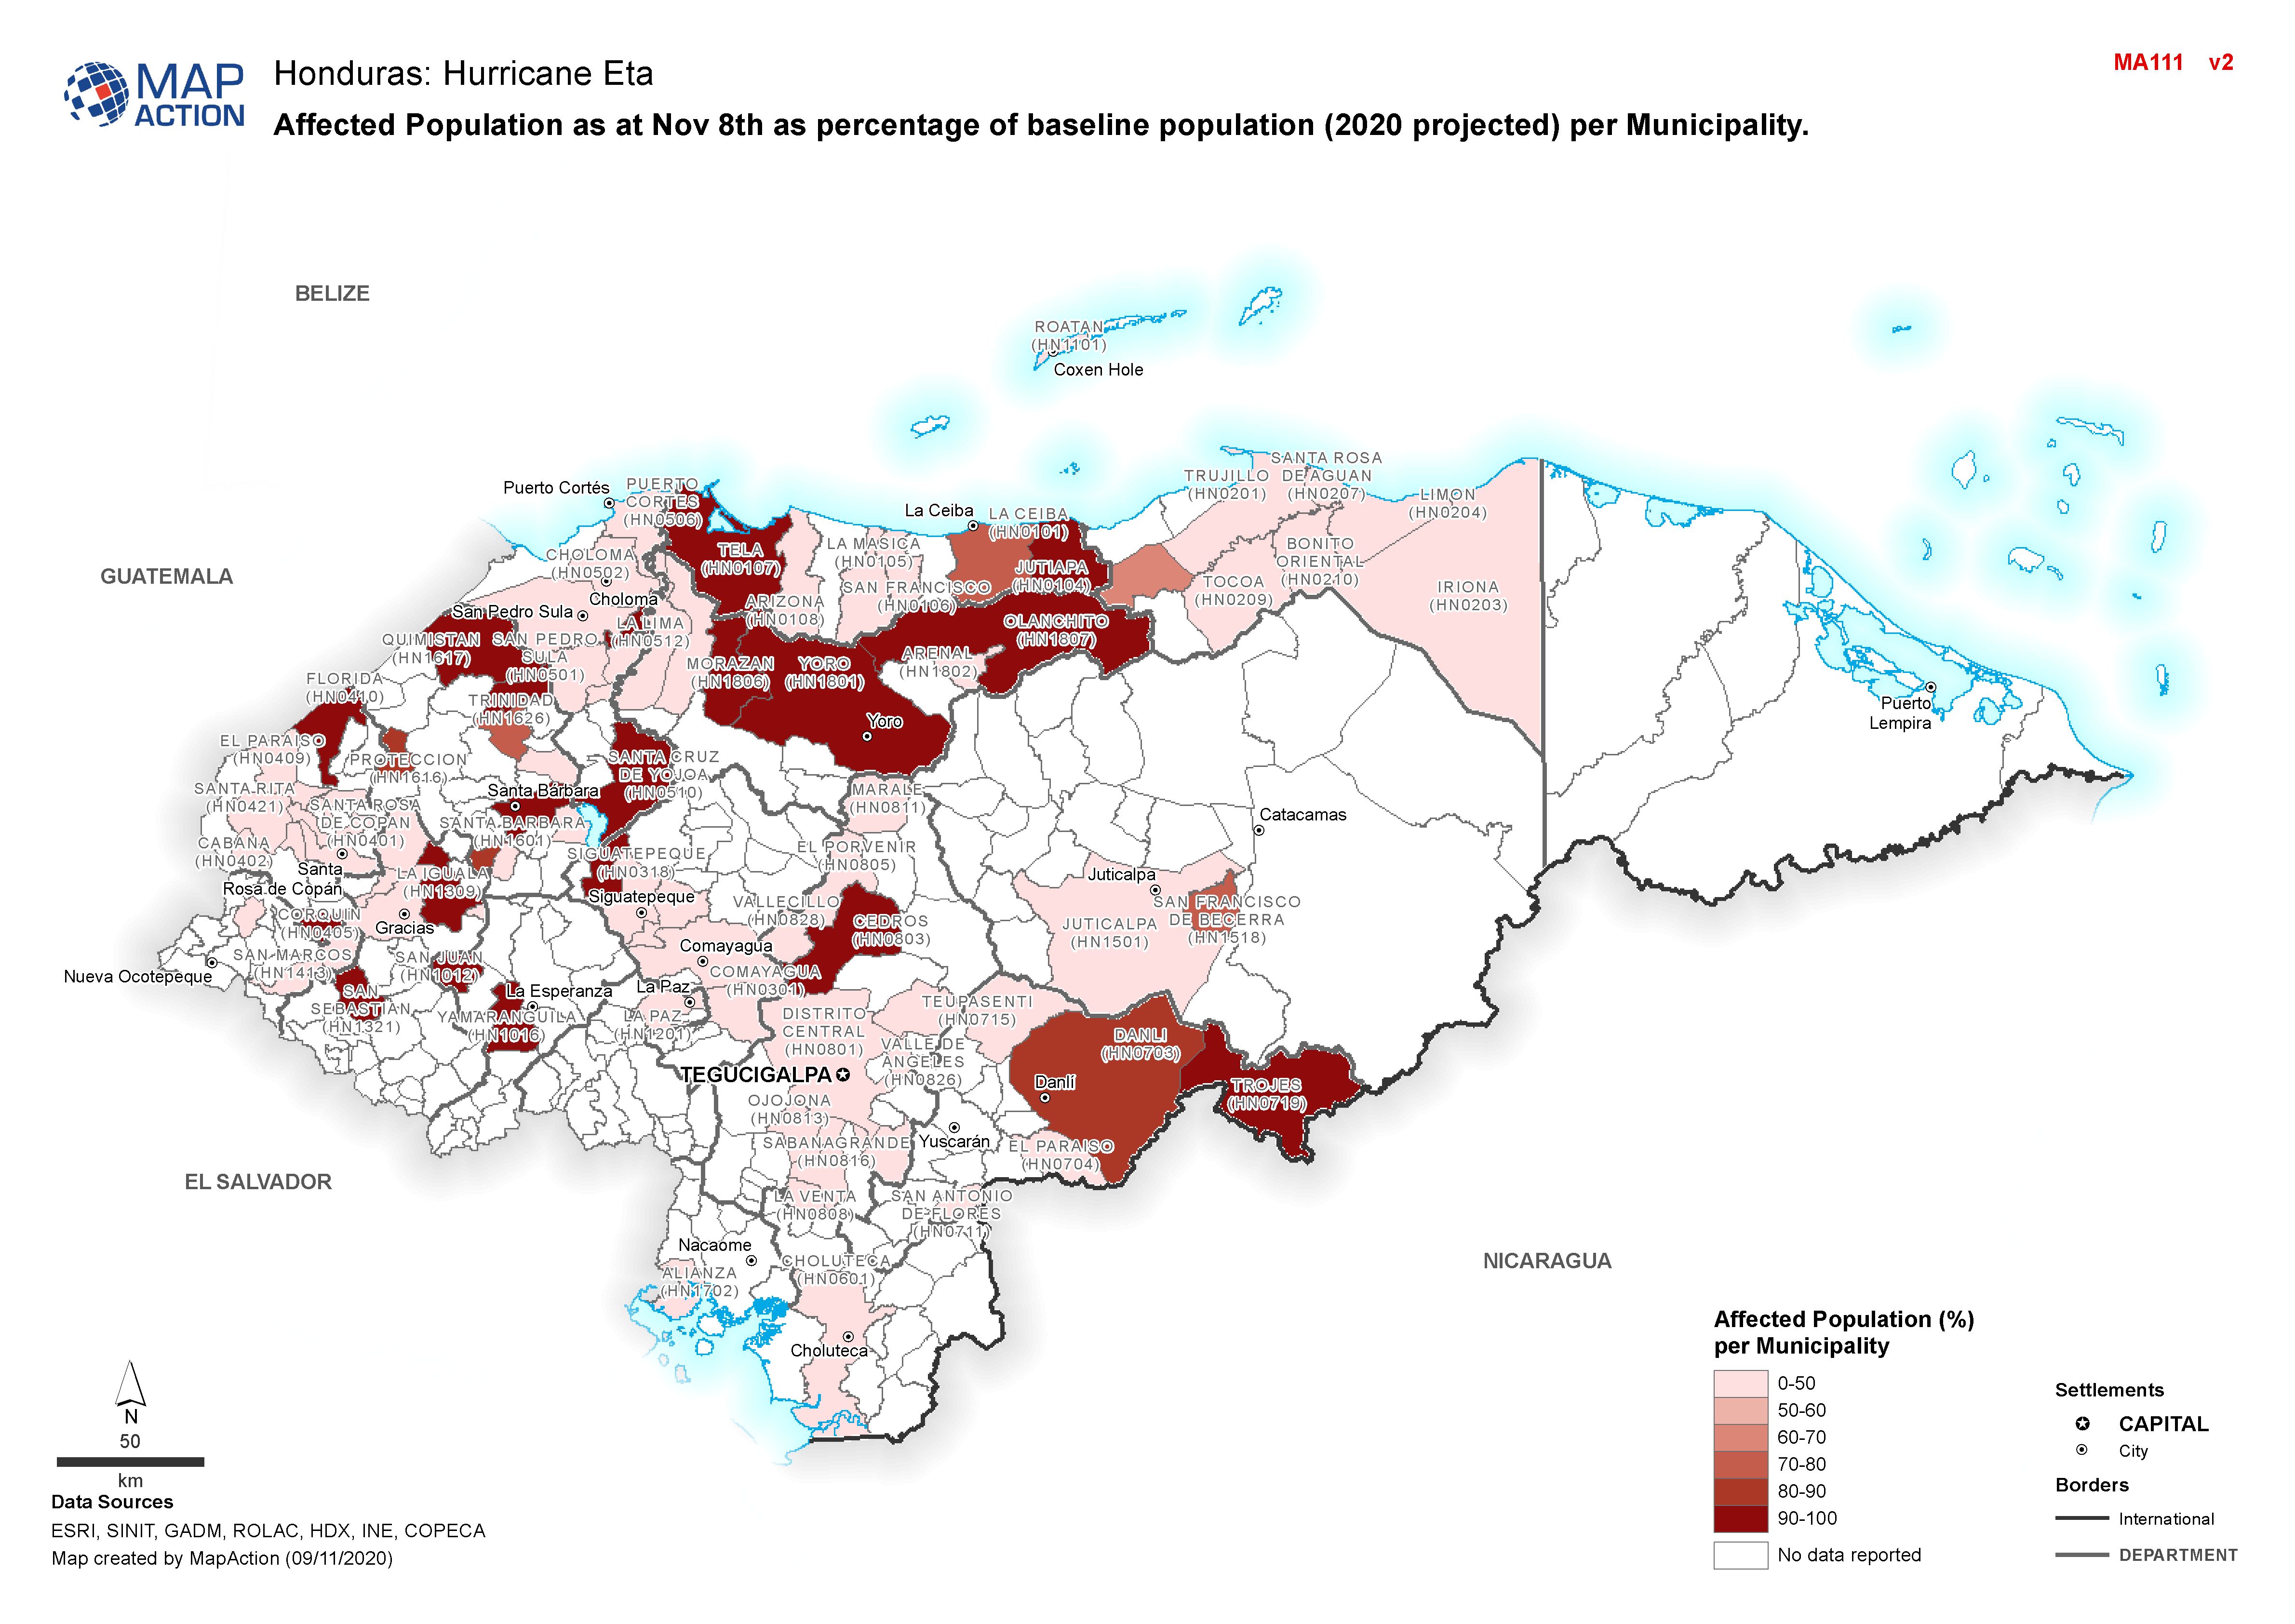
Honduras: Affected Population as at Nov 8th as percentage of baseline populat...
Map shows affected population as at Nov 8th as percentage of baseline population (2020 projected) per Municipality. -

Honduras: Evacuated Persons and number of Evacuation Centres per Municipality...
Map shows evacuated persons and number of evacuation centres per Municipality (as at 8th Nov 2020) -
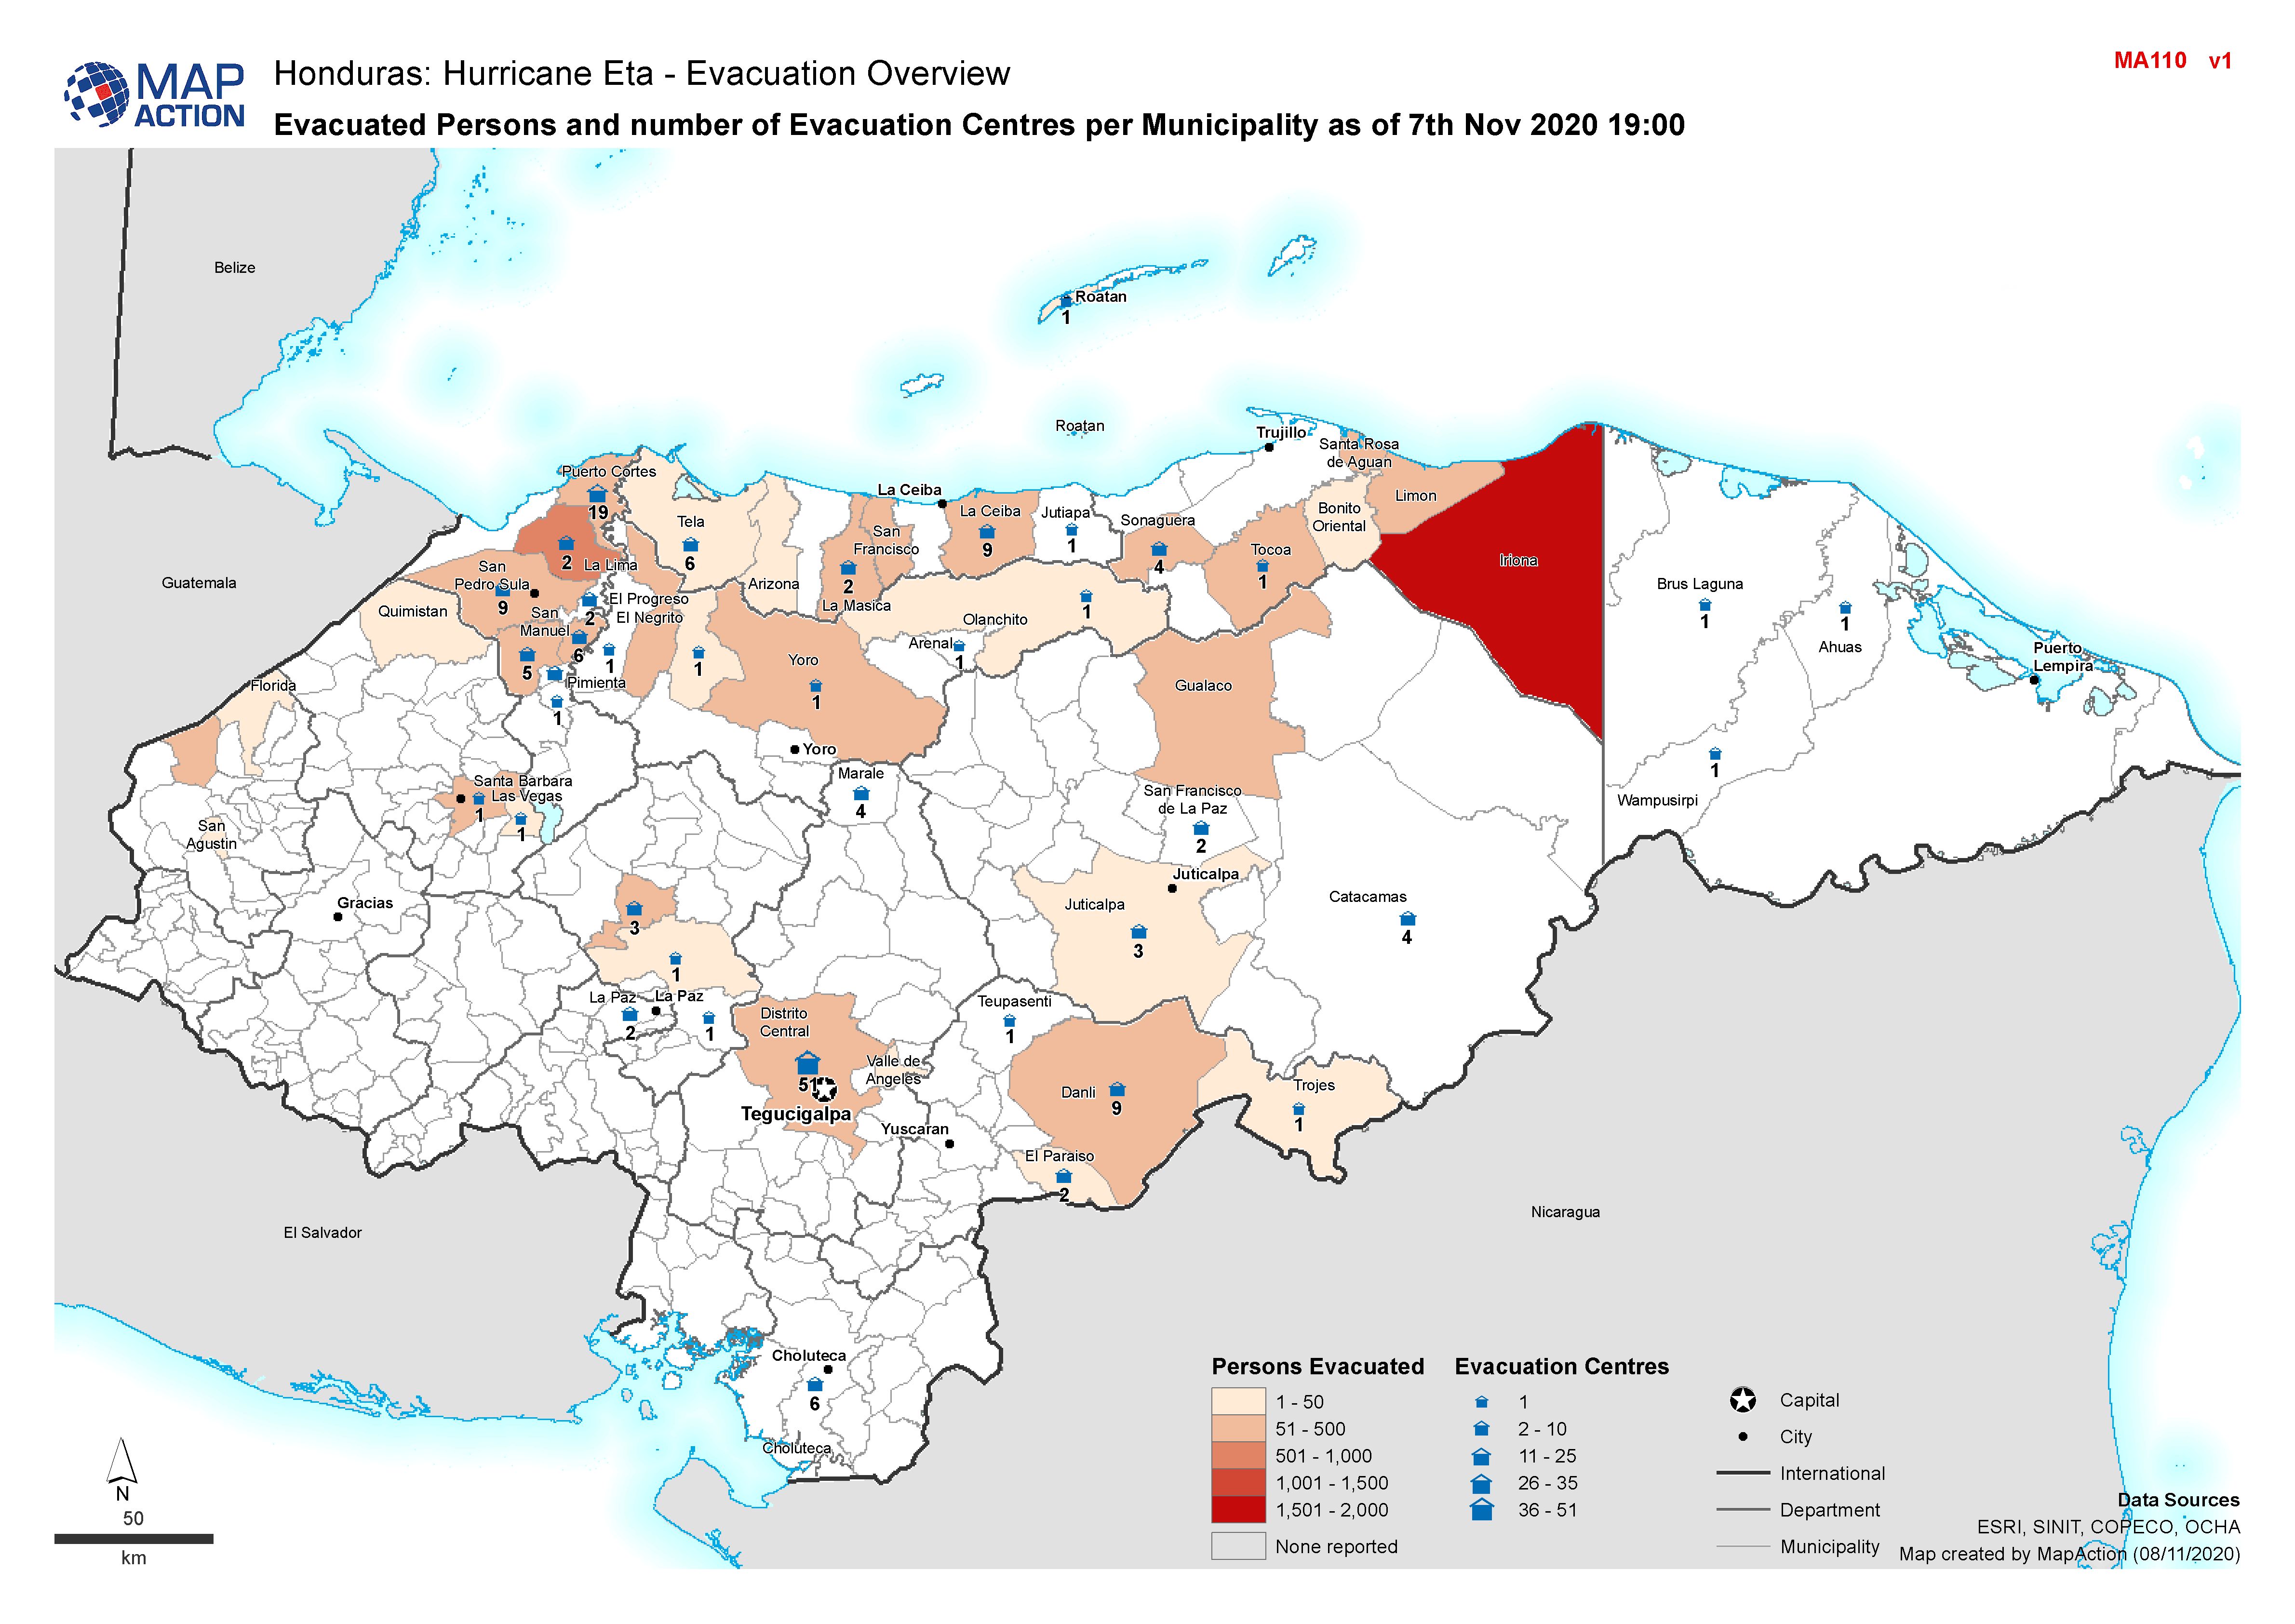
Honduras: Evacuated Persons and number of Evacuation Centres per Municipality...
Honduras, Evacuated Persons and number of Evacuation Centres per Municipality as of 7th Nov 2020 19:00 -

The Philippines: Typhoon Goni (Rolly) - Affected population by Municipality (...
Map shows the number of reported affected people per Municipality. -

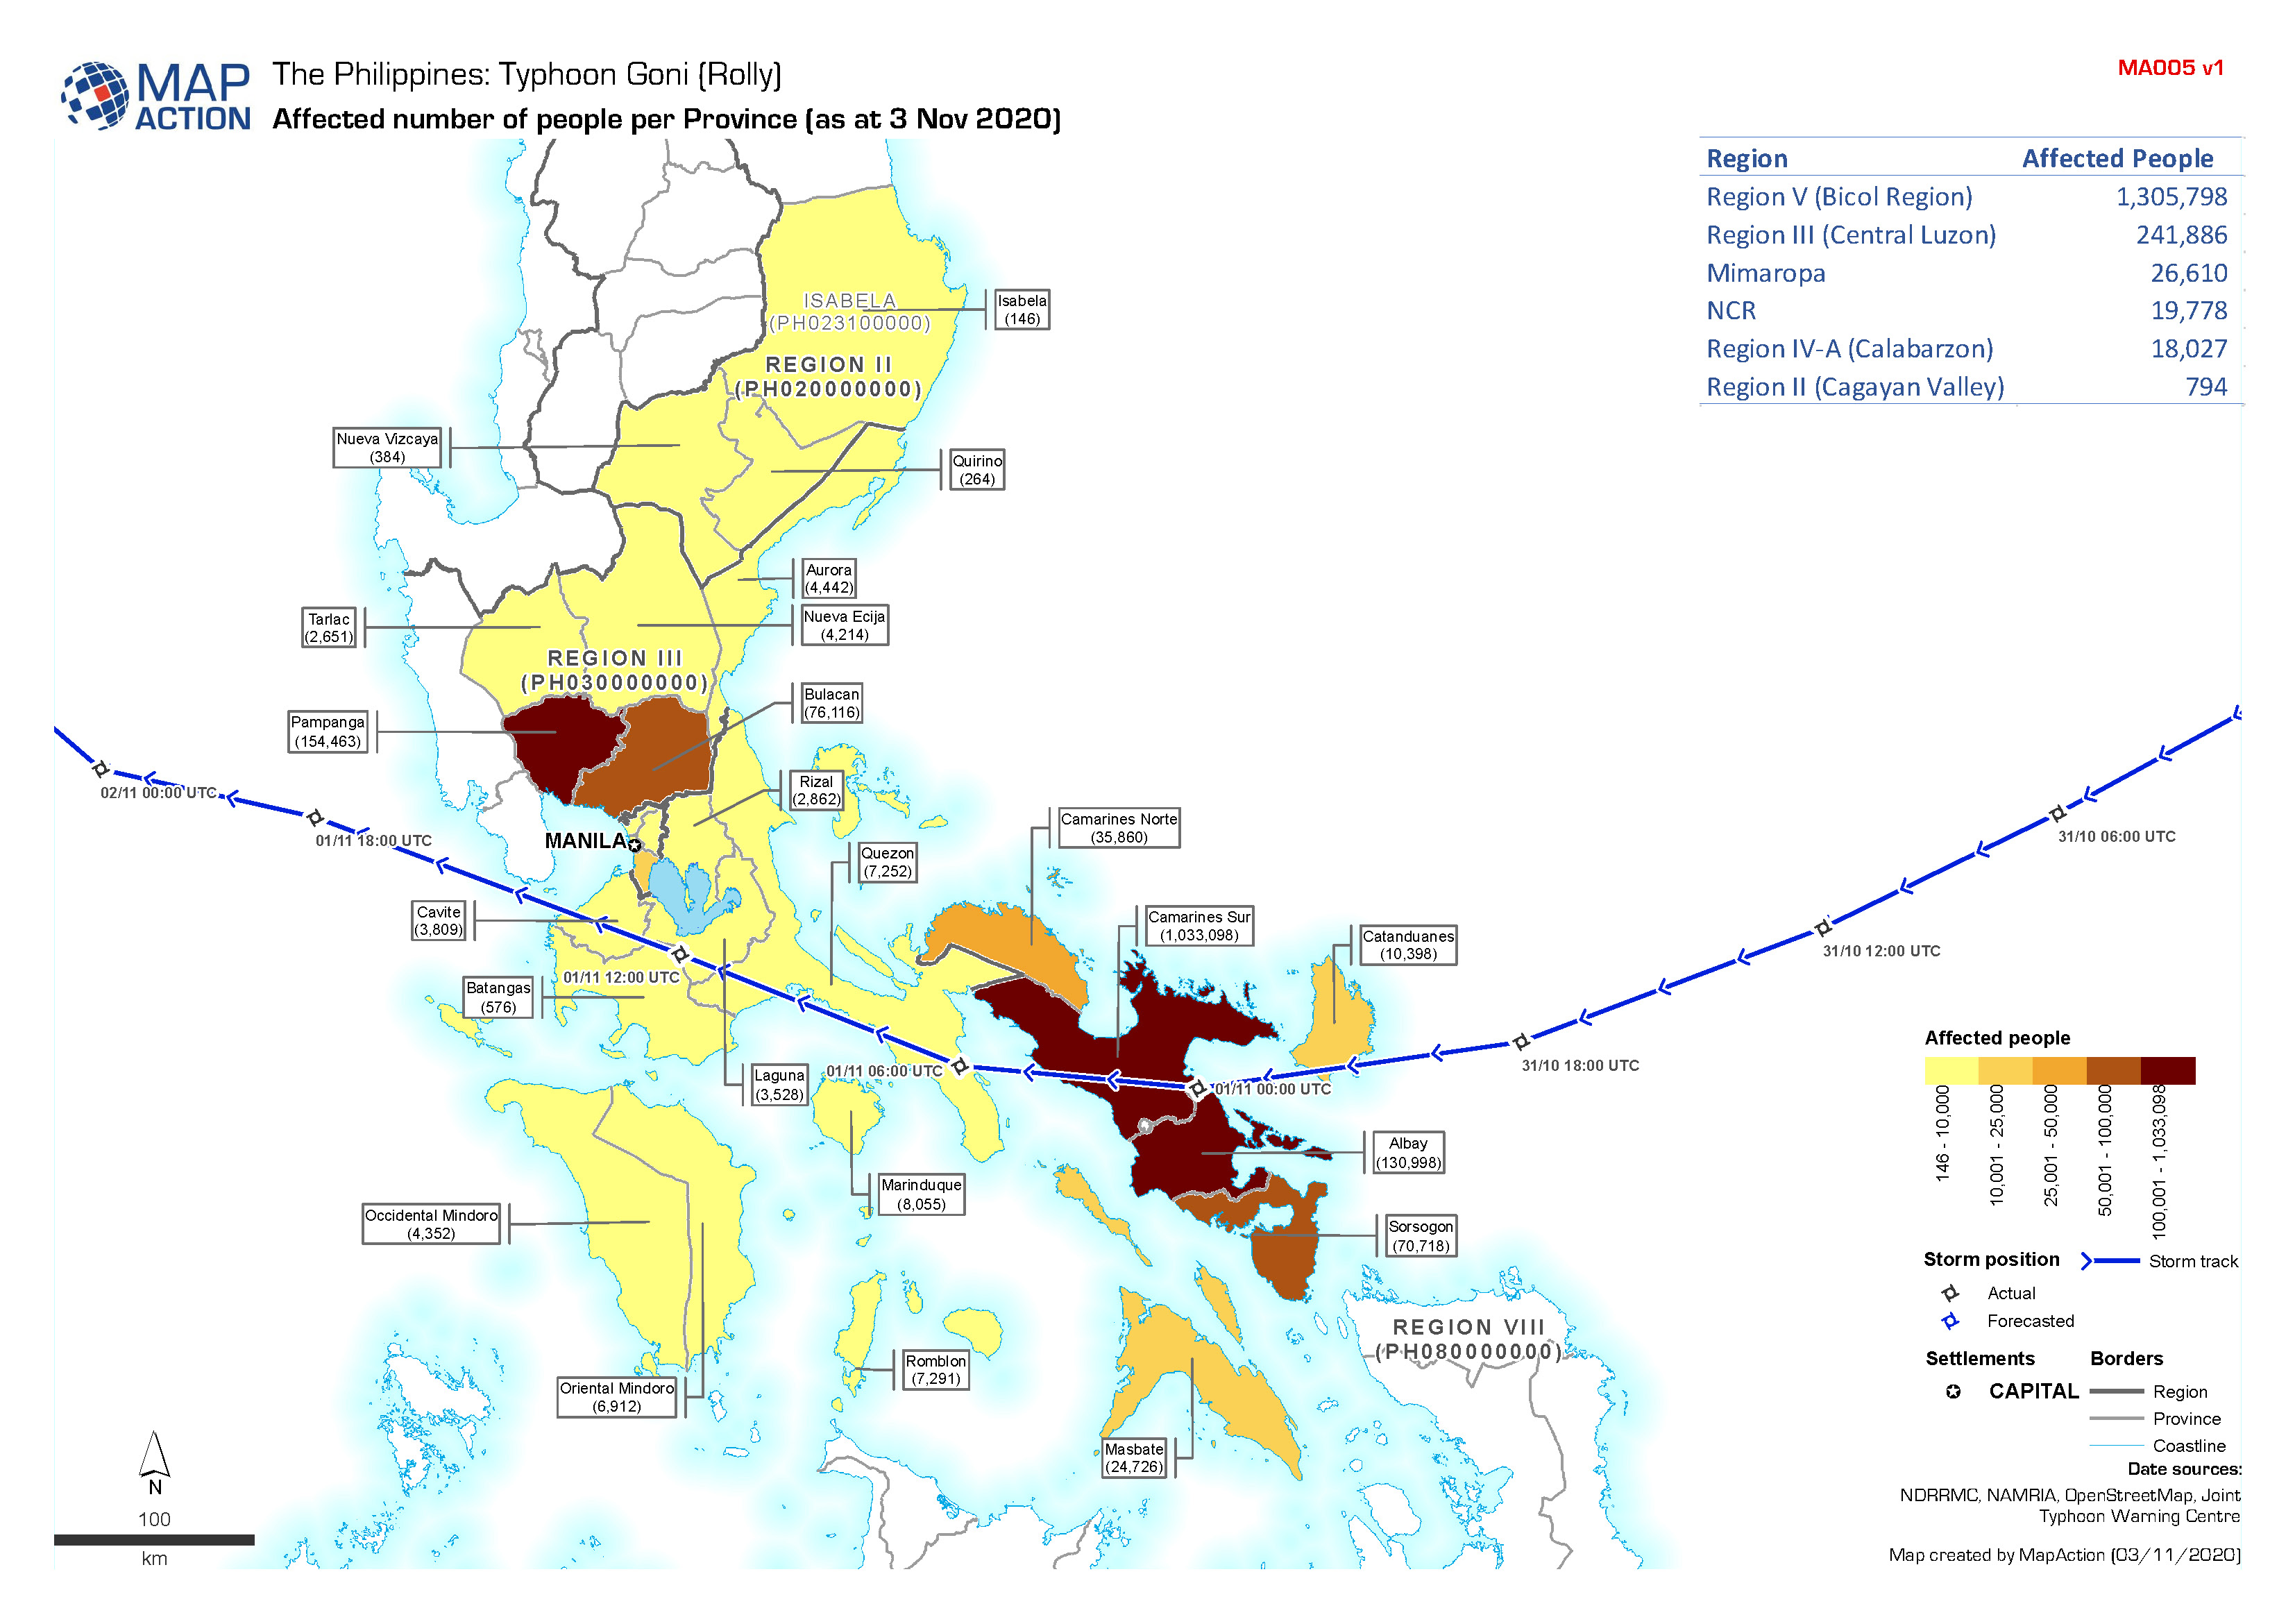
The Philippines: Typhoon Goni (Rolly) - Affected number of people (as at 3 No...
Map shows the number of affected people per Province. -
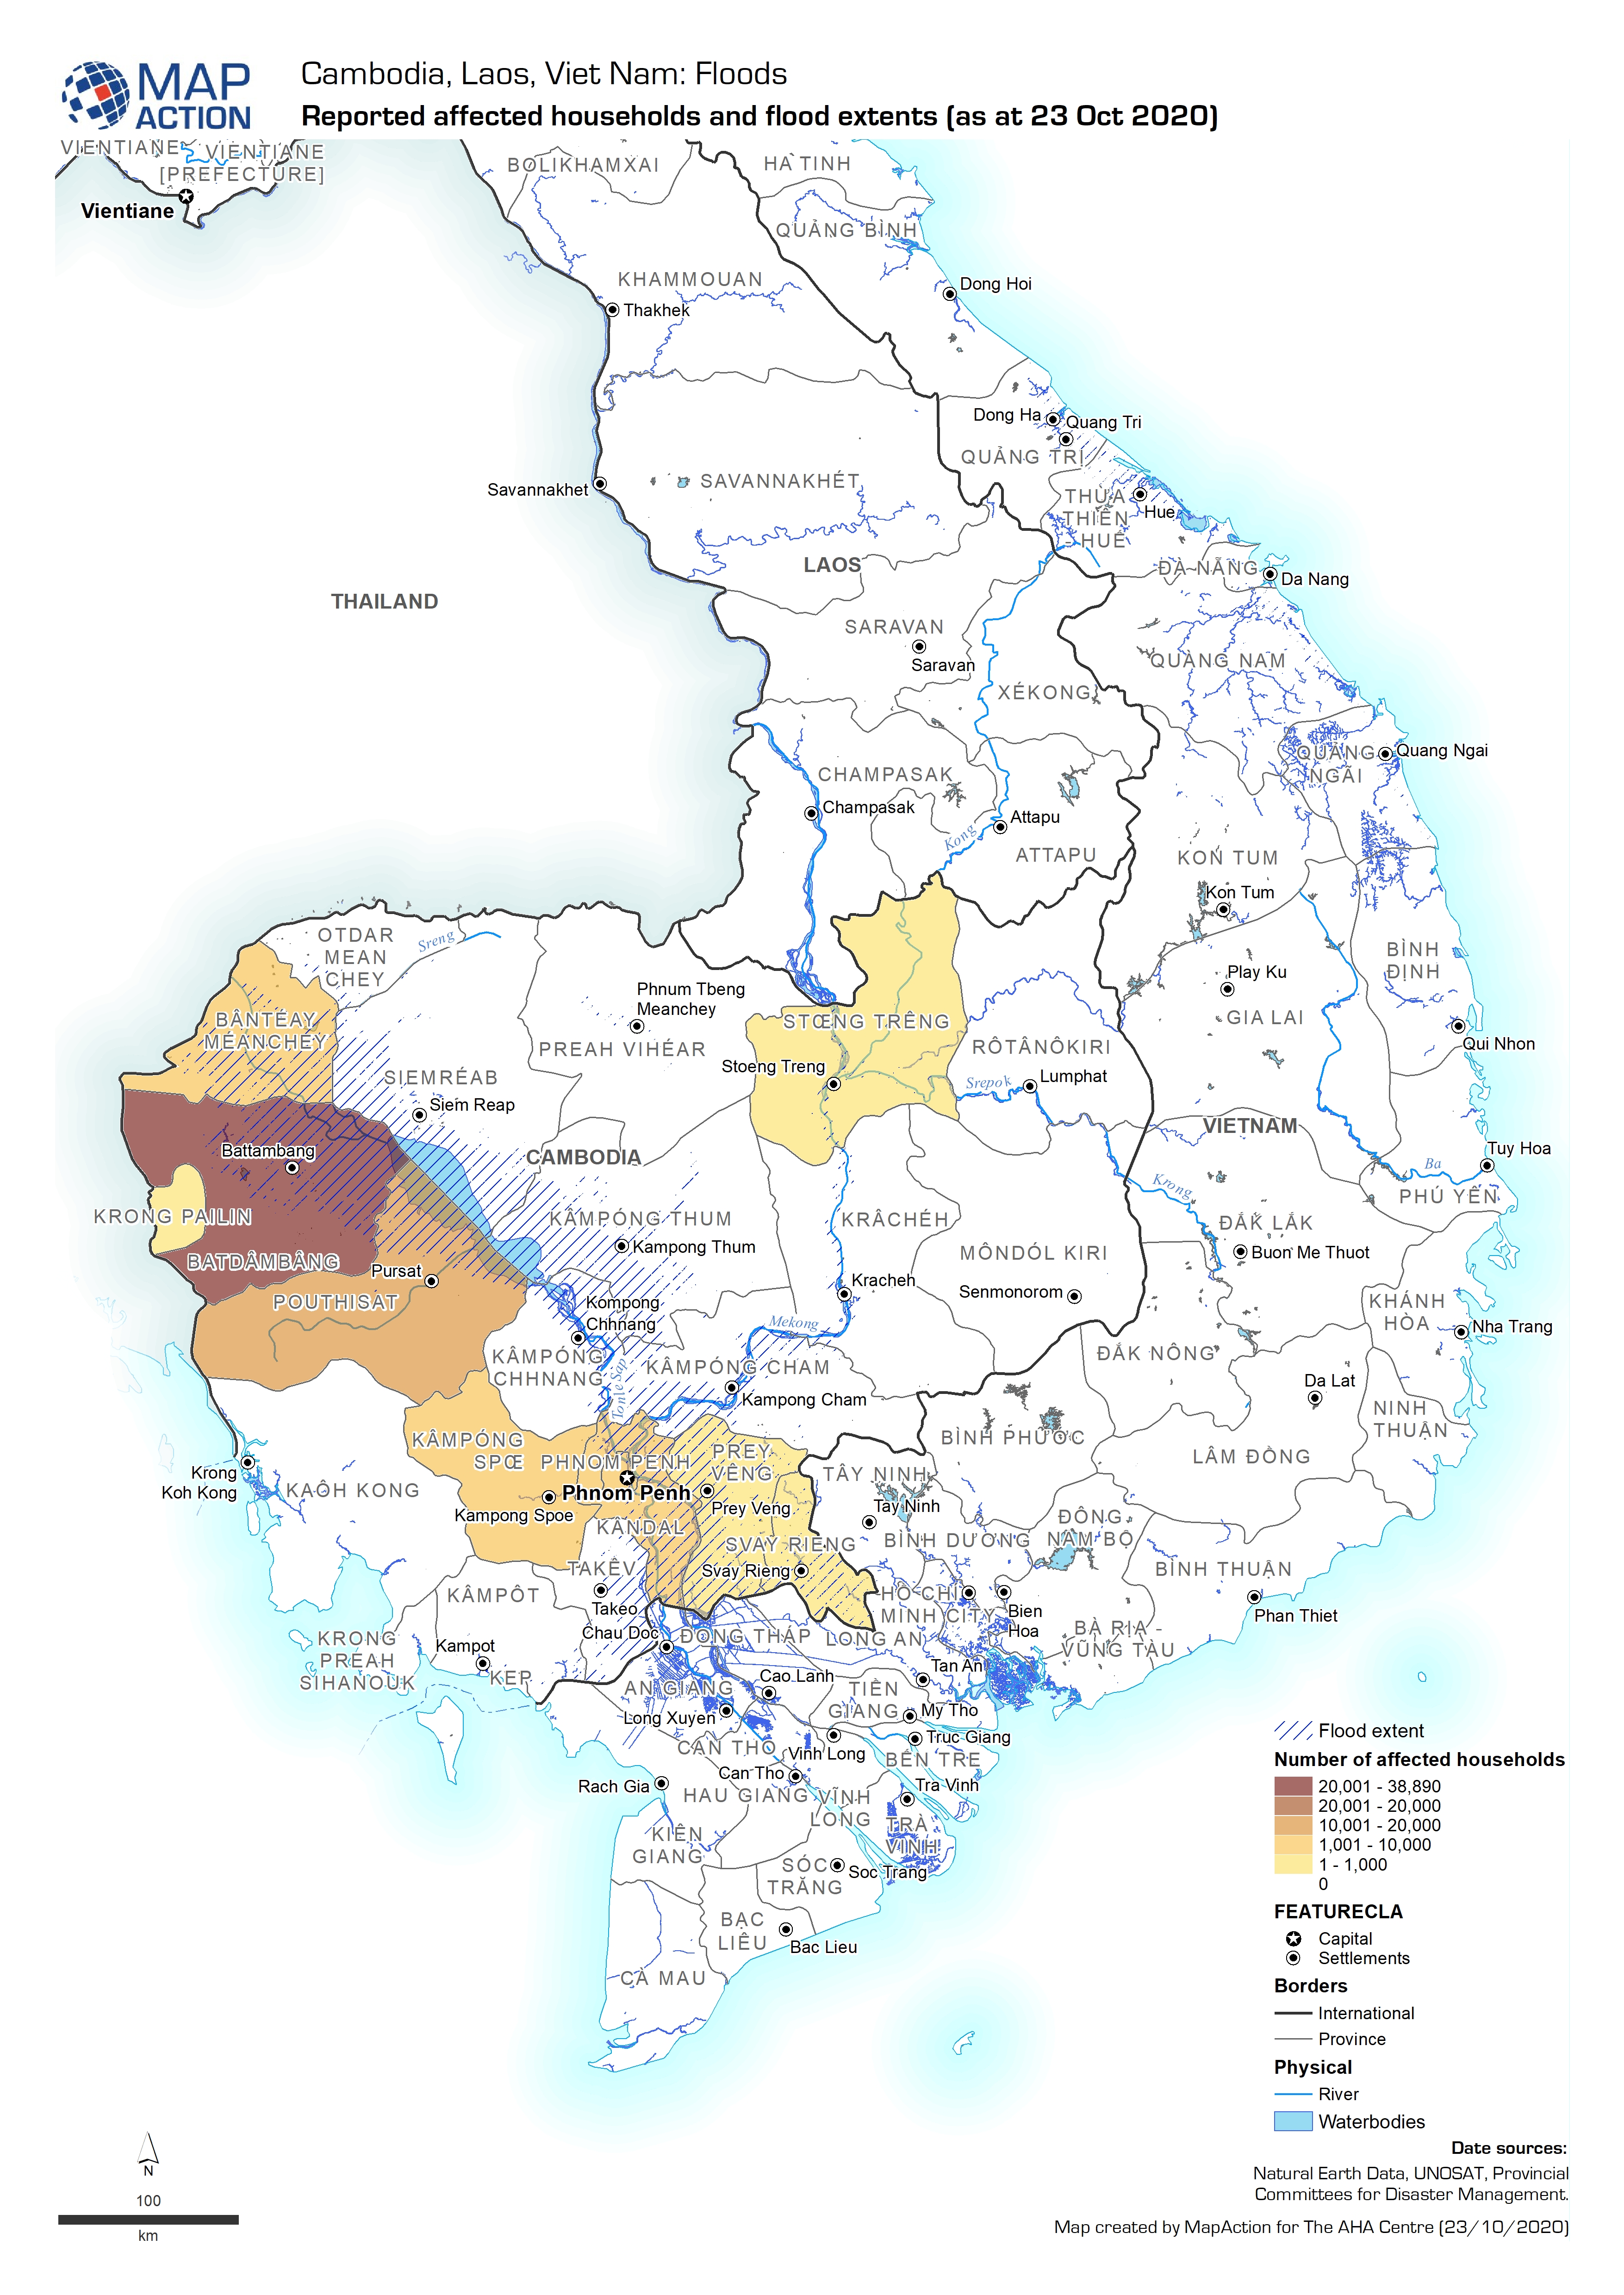
Reported affected households and flood extents (as at 23 Oct 2020)
Map shows the reported number of households affected by flooding in Cambodia. -
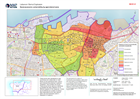
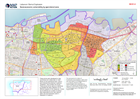
Socio-economic vulnerability by operational zone
The socio-economic status of households living pre-blast in each zone was estimated by UN-Habitat based on (1) a national ranking of 498 disadvantaged area undertaken to inform... -

Socio-economic vulnerability by operational zone
The socio-economic status of households living pre-blast in each zone was estimated by UN-Habitat based on (1) a national ranking of 498 disadvantaged area undertaken to inform... -
Socio-economic vulnerability by operational zone
The socio-economic status of households living pre-blast in each zone was estimated by UN-Habitat based on (1) a national ranking of 498 disadvantaged area undertaken to inform... -

Socio-economic vulnerability by operational zone
The socio-economic status of households living pre-blast in each zone was estimated by UN-Habitat based on (1) a national ranking of 498 disadvantaged areas undertaken to inform... -

Beirut Total Population by Cadasters (March 2020)
Map shows Beirut total population by Cadasters (March 2020) -
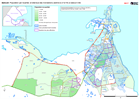
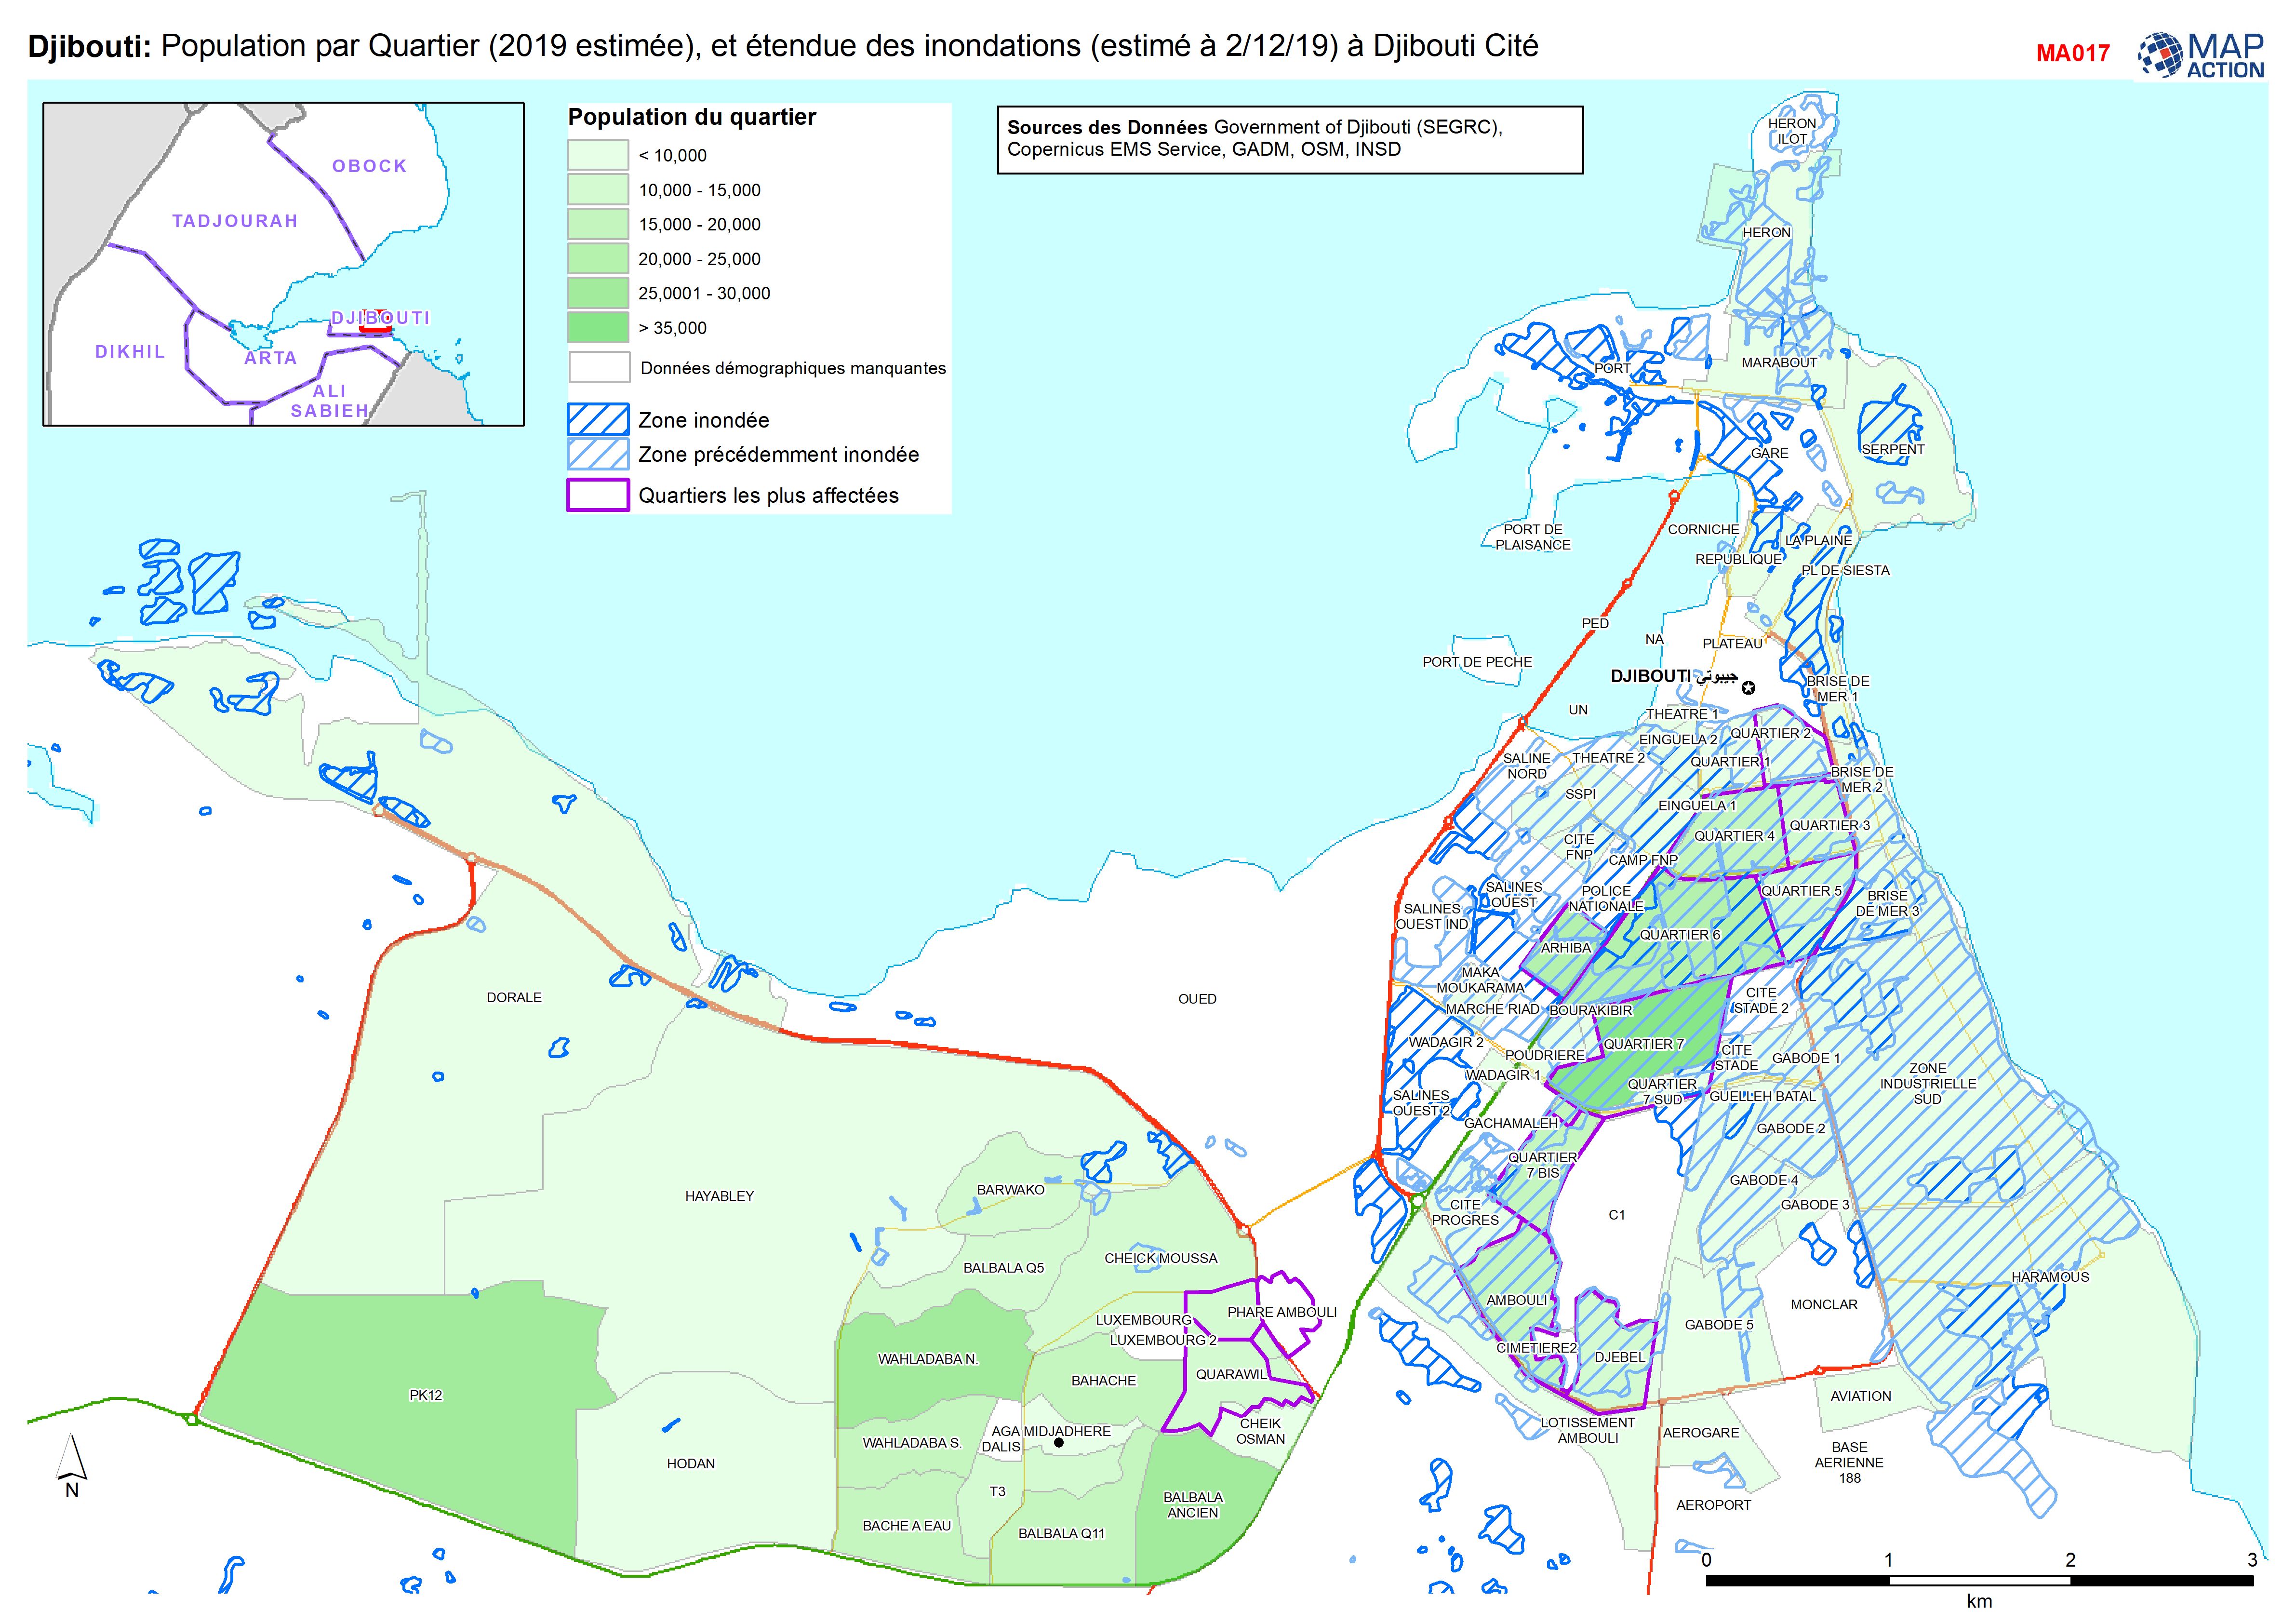
Djibouti: Population par Quartier (2019 estimée), et étendue des inondations ...
Population par Quartier (2019, estimée), et étendue des inondations (estimé à 2/12/19) à Djibouti Cité -

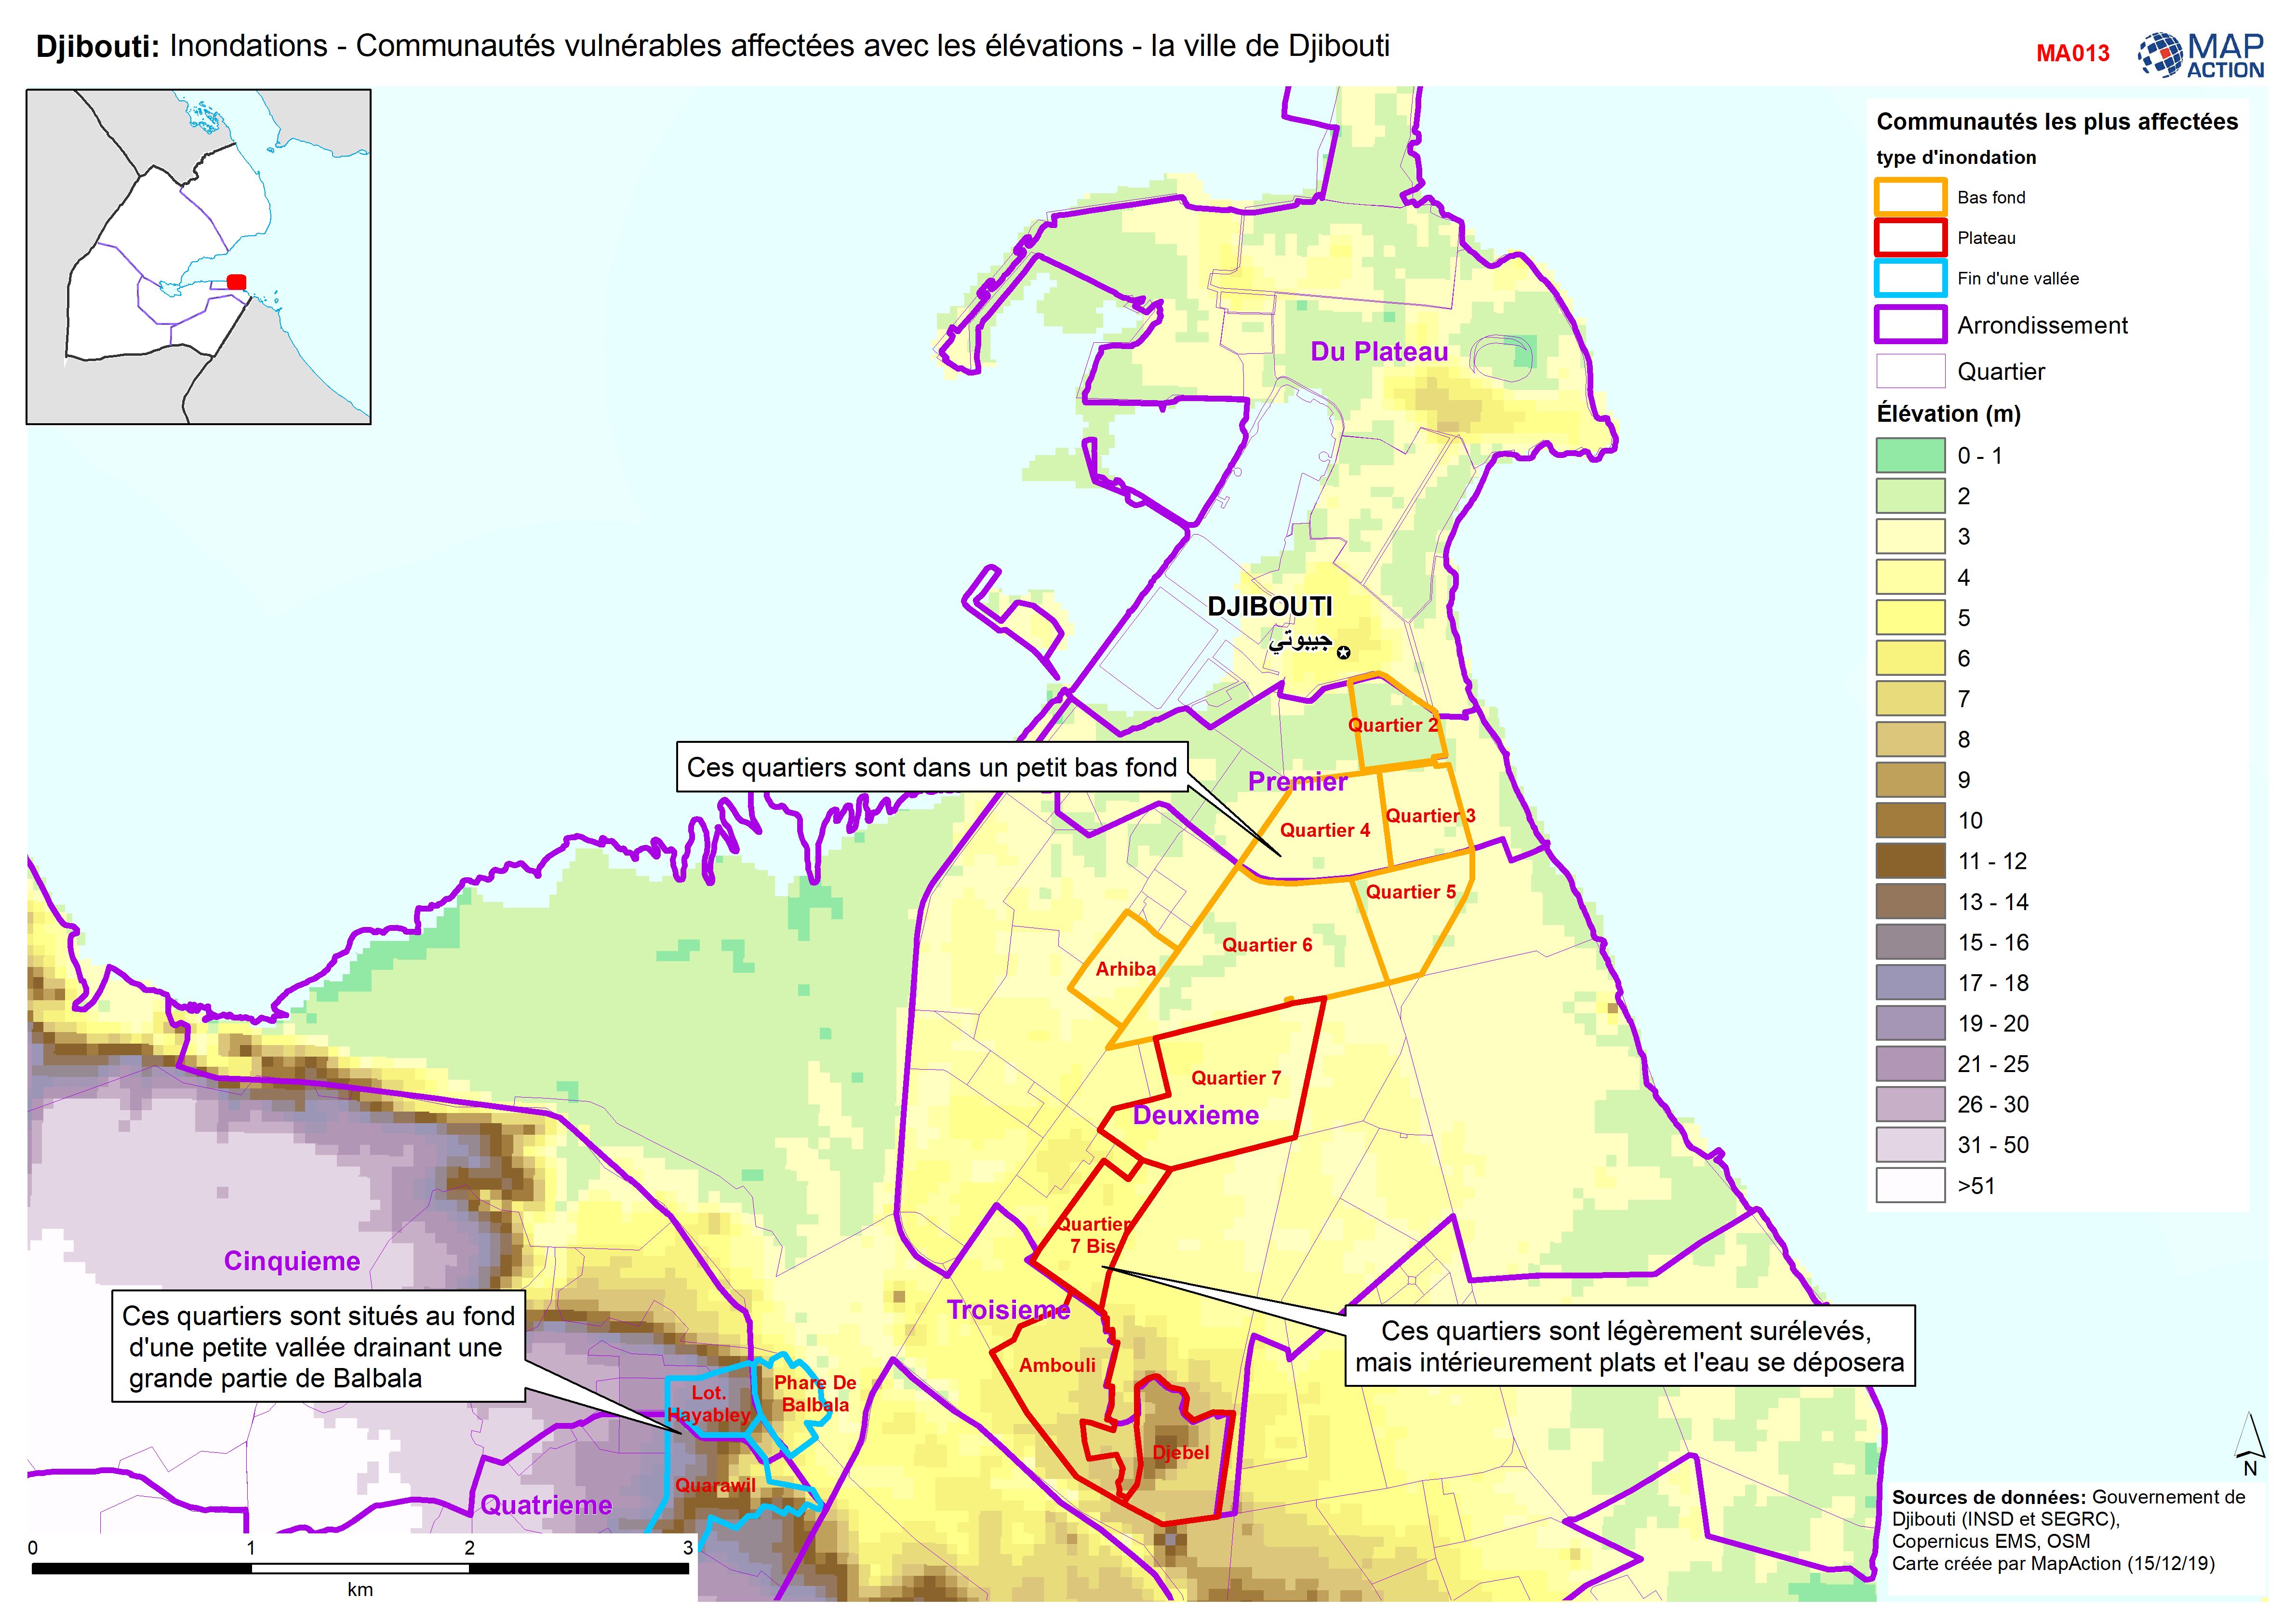
Djibouti: Inondations - Communautés vulnérables affectées avec les élévations...
Djibouti City - Map shows the most affected flooded communities, containing the most vulnerable populations, alongside elevation data to demonstrate the effects of elevation and... -

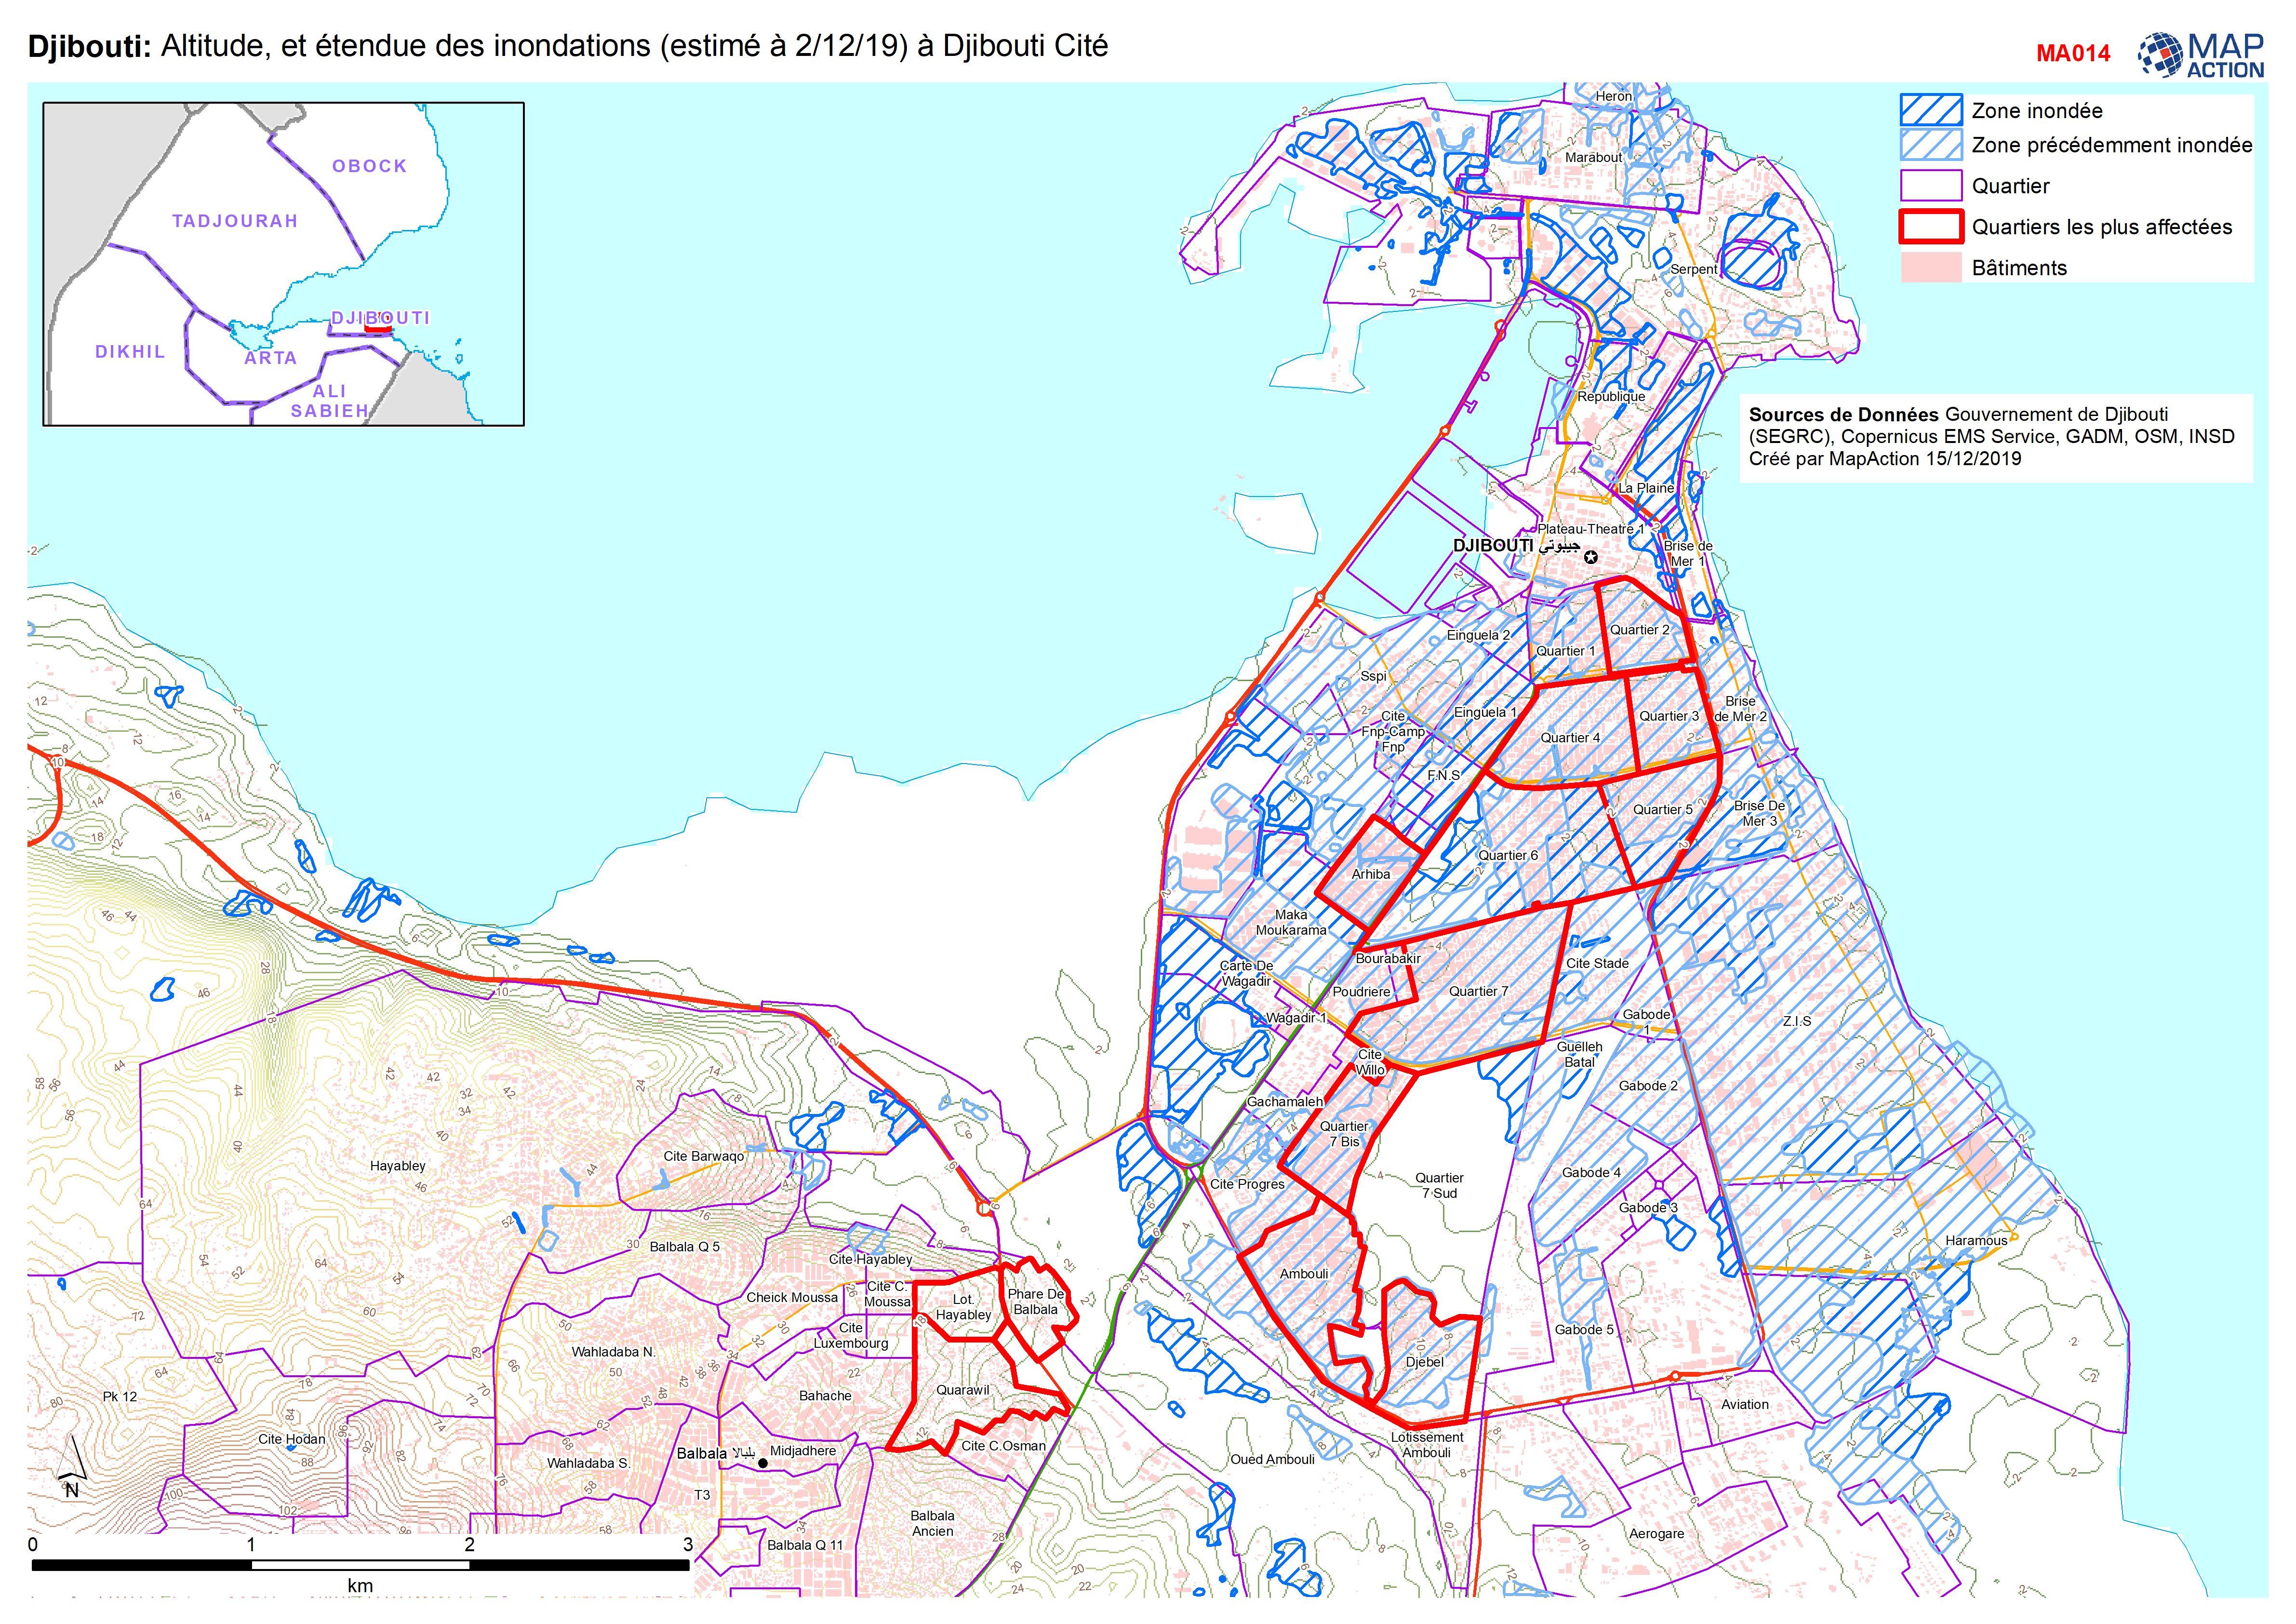
Djibouti: Altitude, et étendue des inondations (estimé à 2/12/19) à Djibouti ...
Flood extent and elevation in Djibouti city -

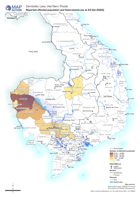
Djibouti: Floods - Affected Locations Countrywide and in Djibouti City
Country level map shows numbers of families affected in villages and towns across Central and South Djibouti (no reports from north) and by Quartiers in Djibouti City. Map for... -

Djibouti: Inondations - Djibouti Ville - quartiers affectés (nombre ménages) ...
Djibouti - Inondations - Commune, arrondissement et quartiers de Djibouti avec PCODES -
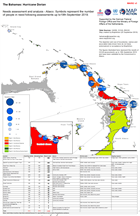
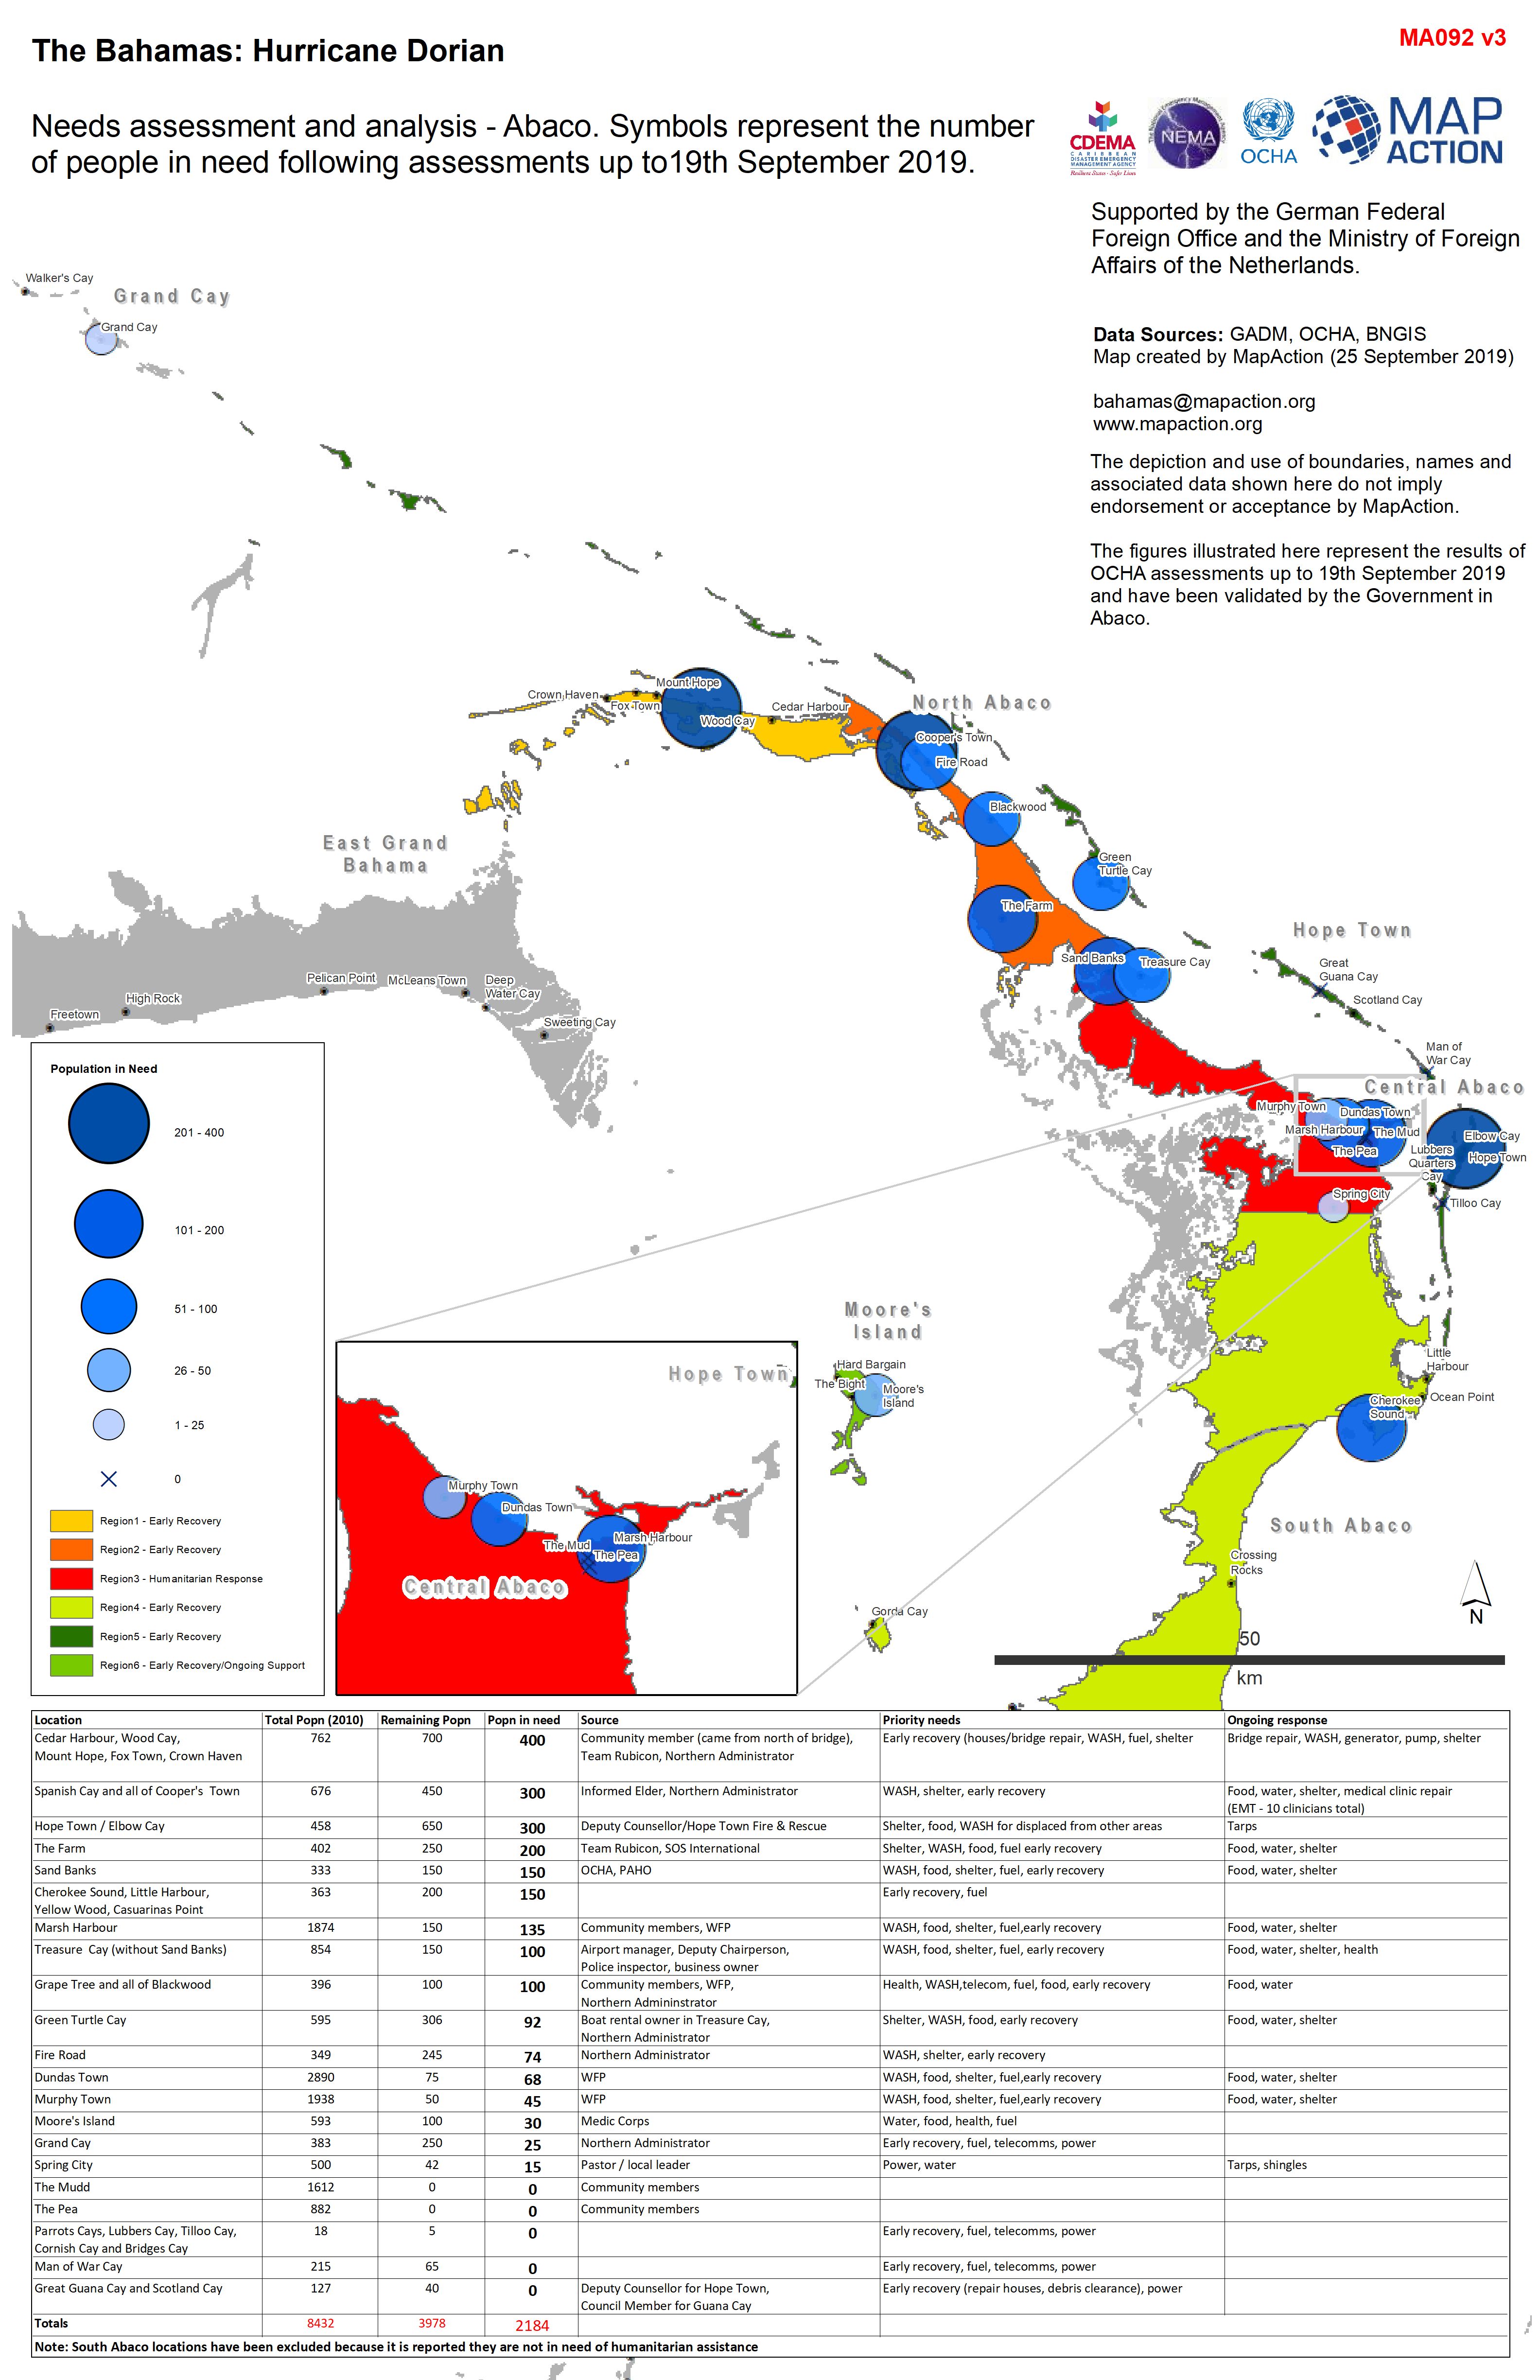
Needs assessment and analysis - Abaco. Symbols represent the number of people...
Needs assessment and analysis - Abaco. Symbols represent the number of people in need following assessment as of 19th Spetember 2019 -

Needs assessment and analysis - Abaco. Symbols represent the number of people...
Needs assessment and analysis - Abaco. Symbols represent the number of people in need following assessment as of 19th Spetember 2019