Datasets
-

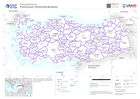
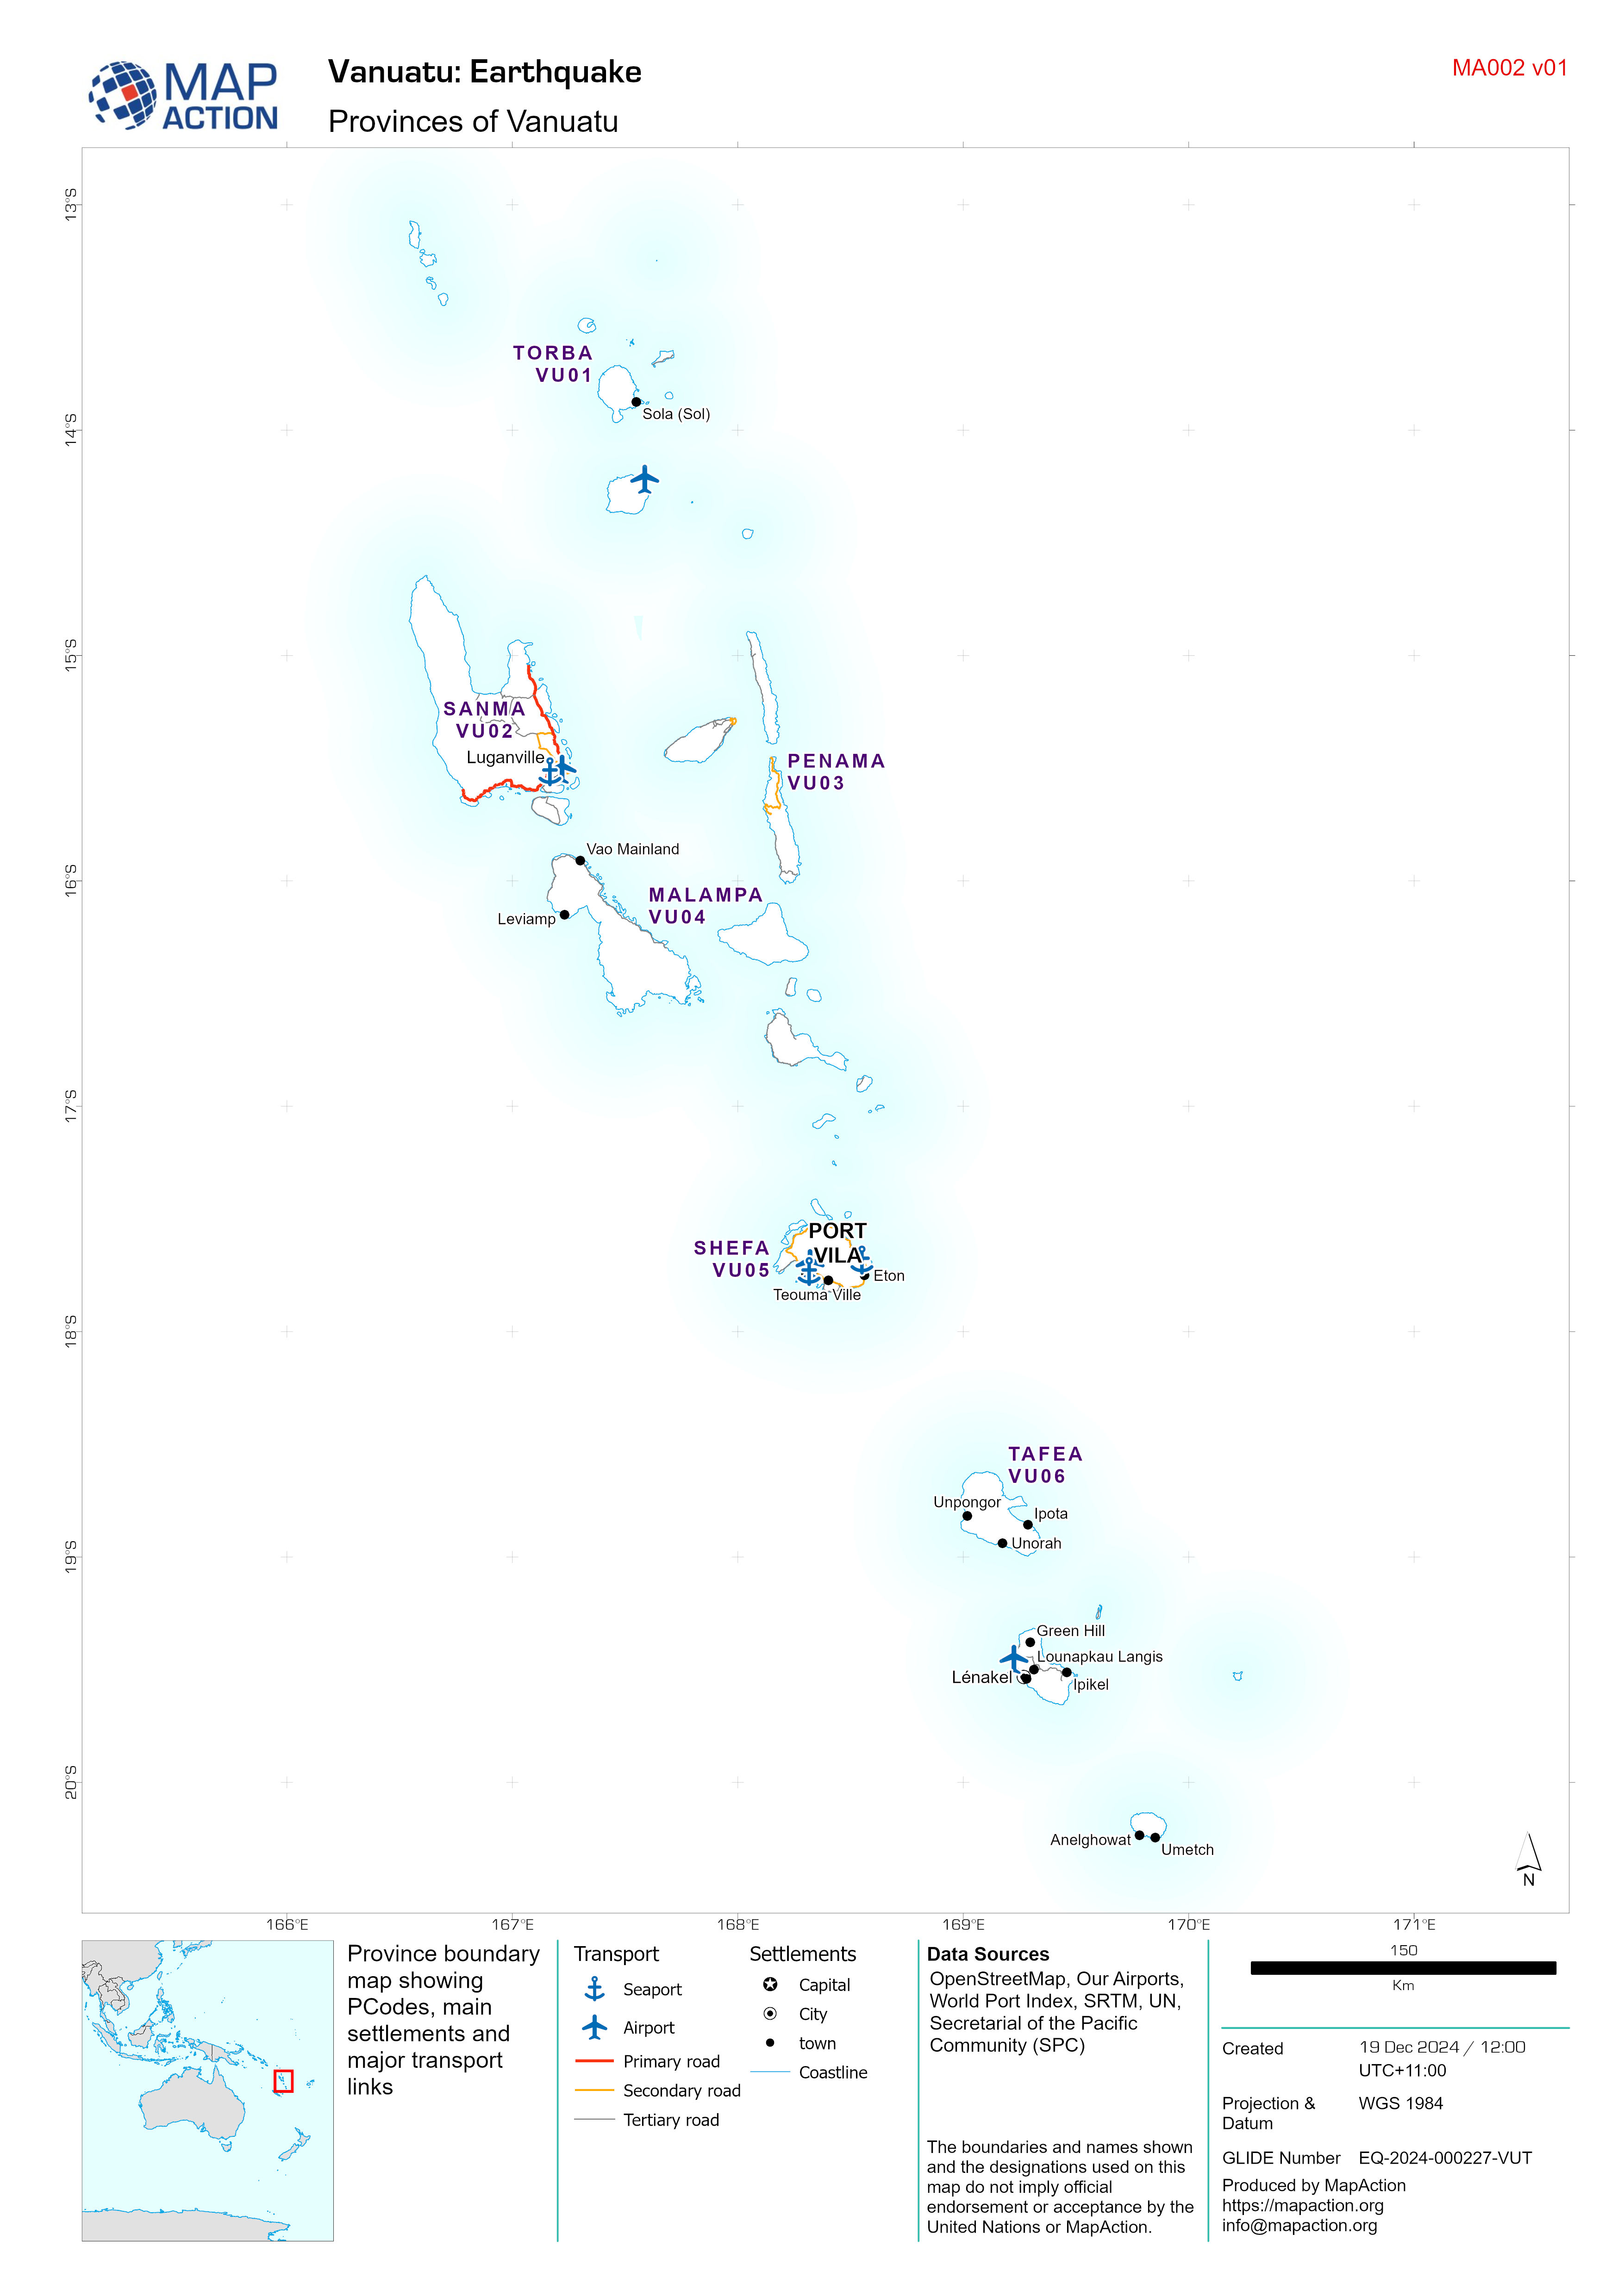
Provinces of Vanuatu
Province boundary map showing PCodes, main settlements and major transport links -

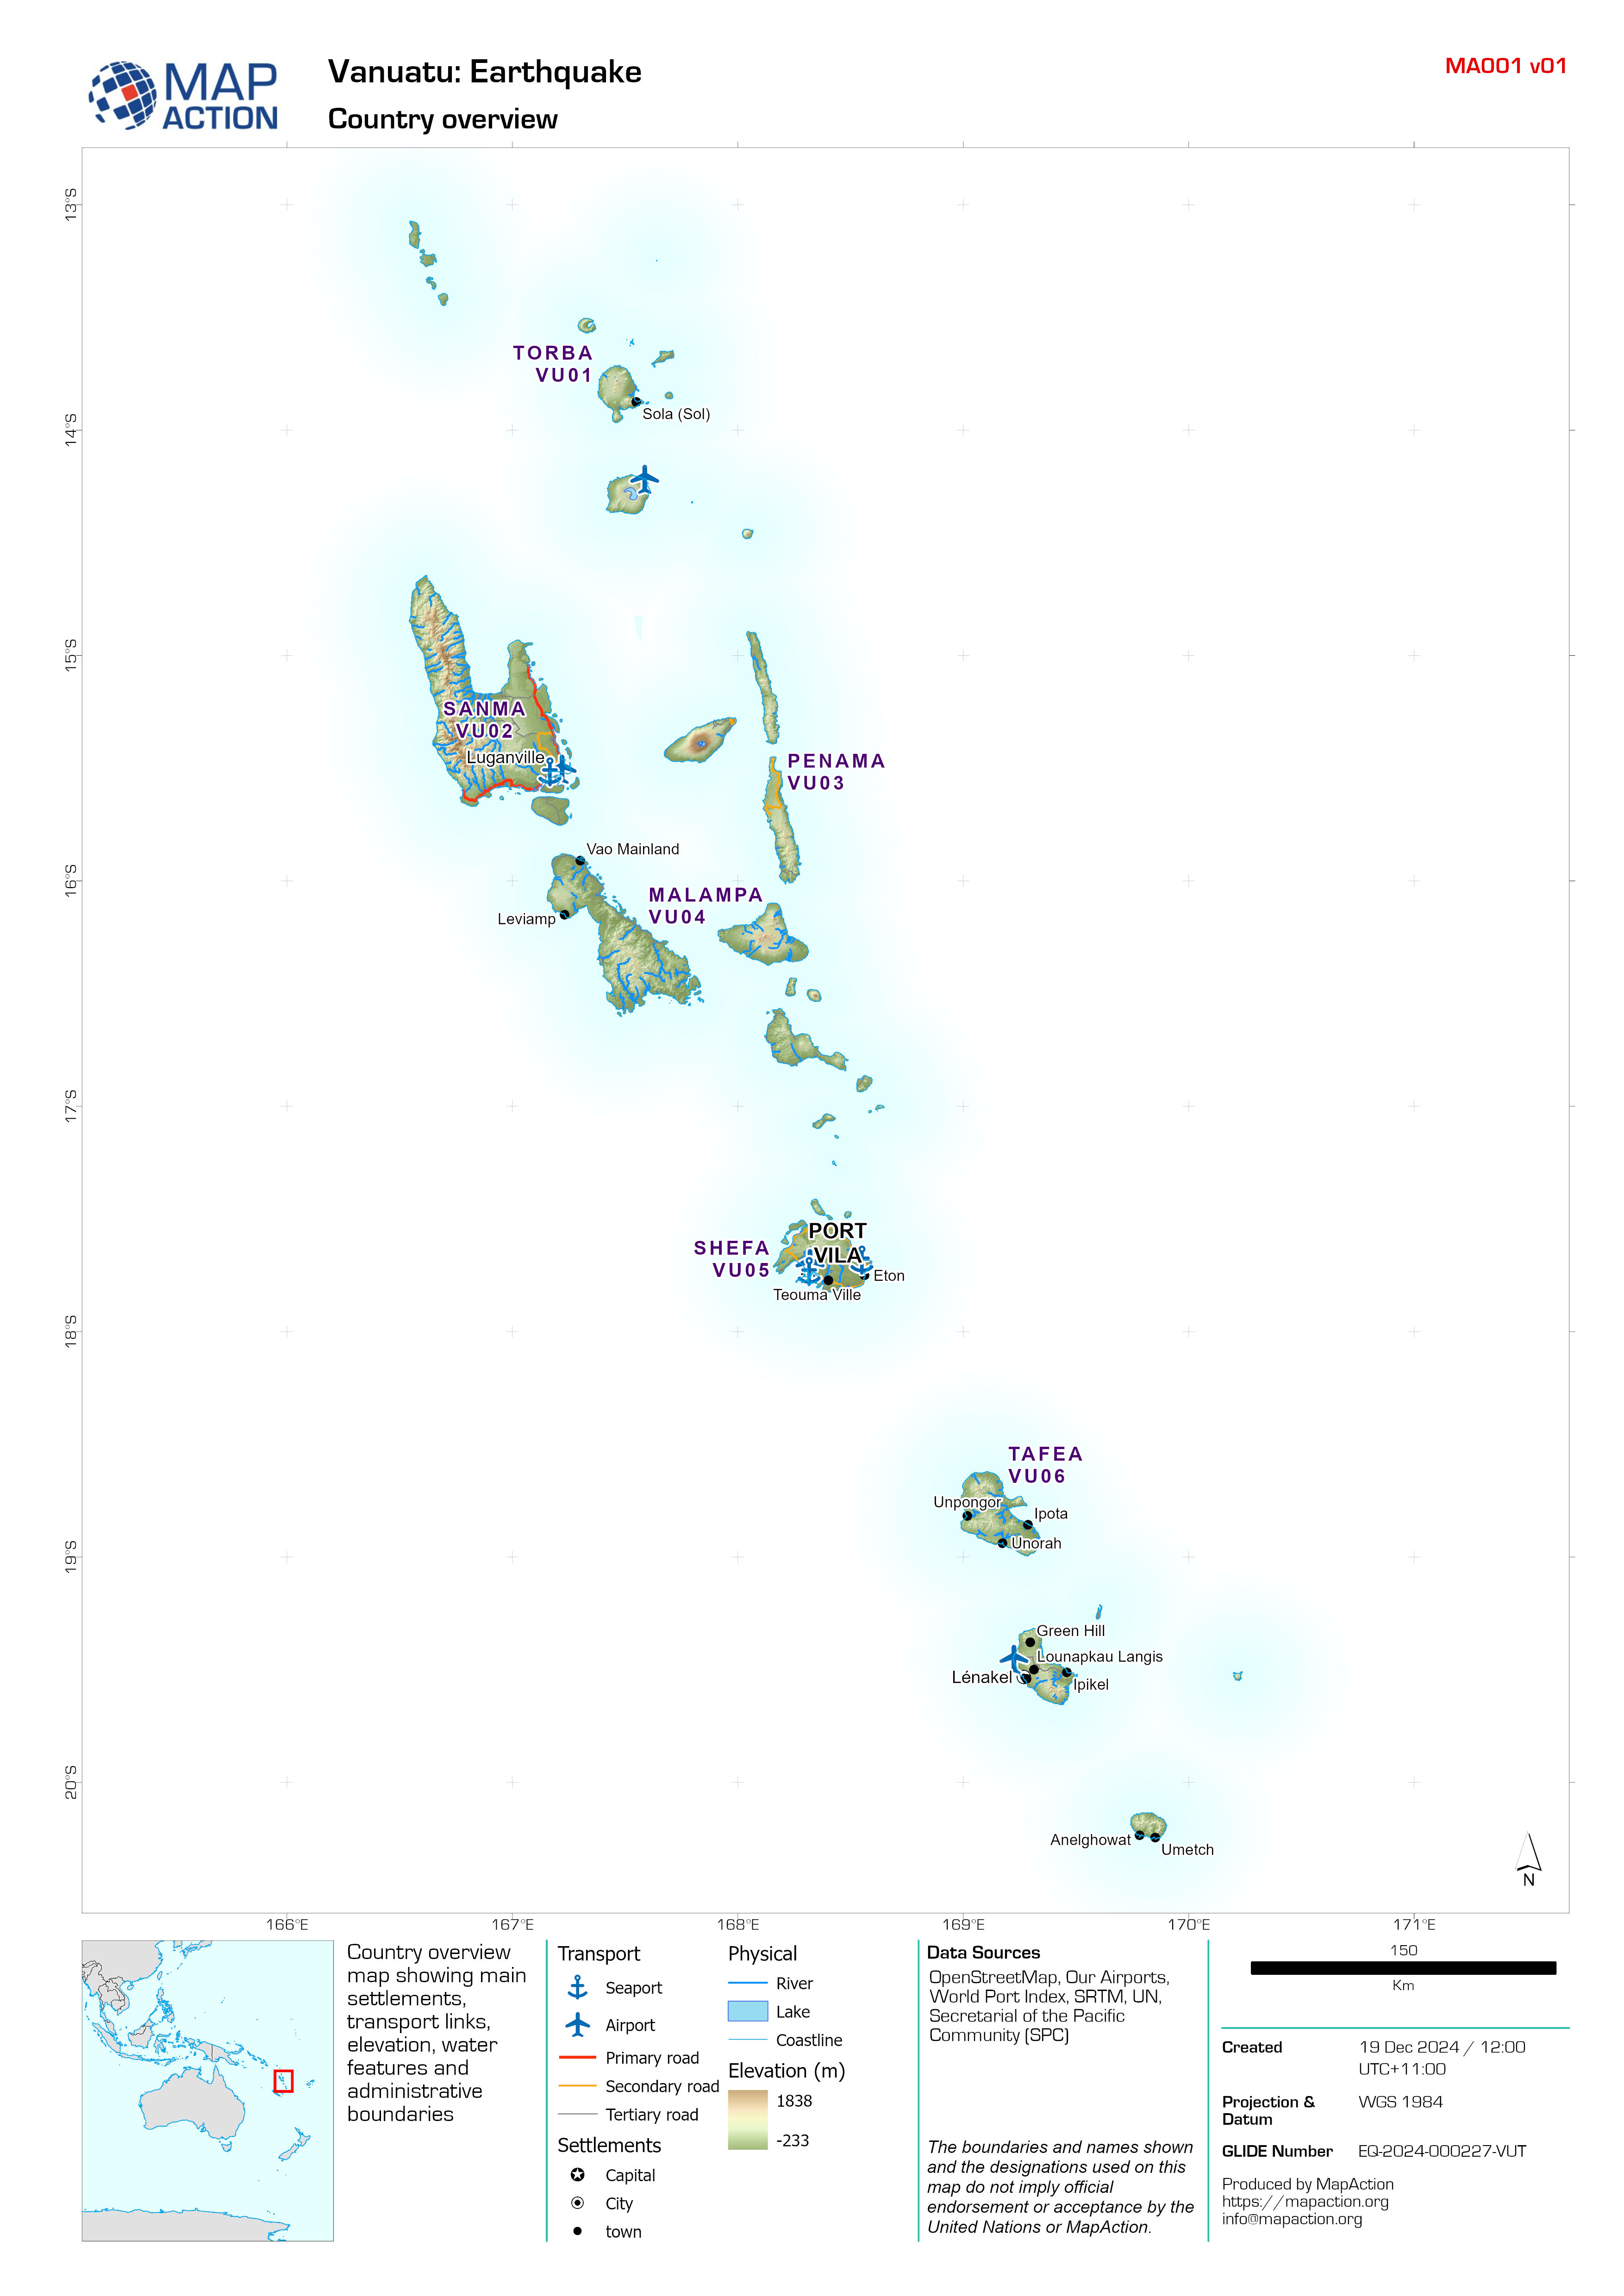
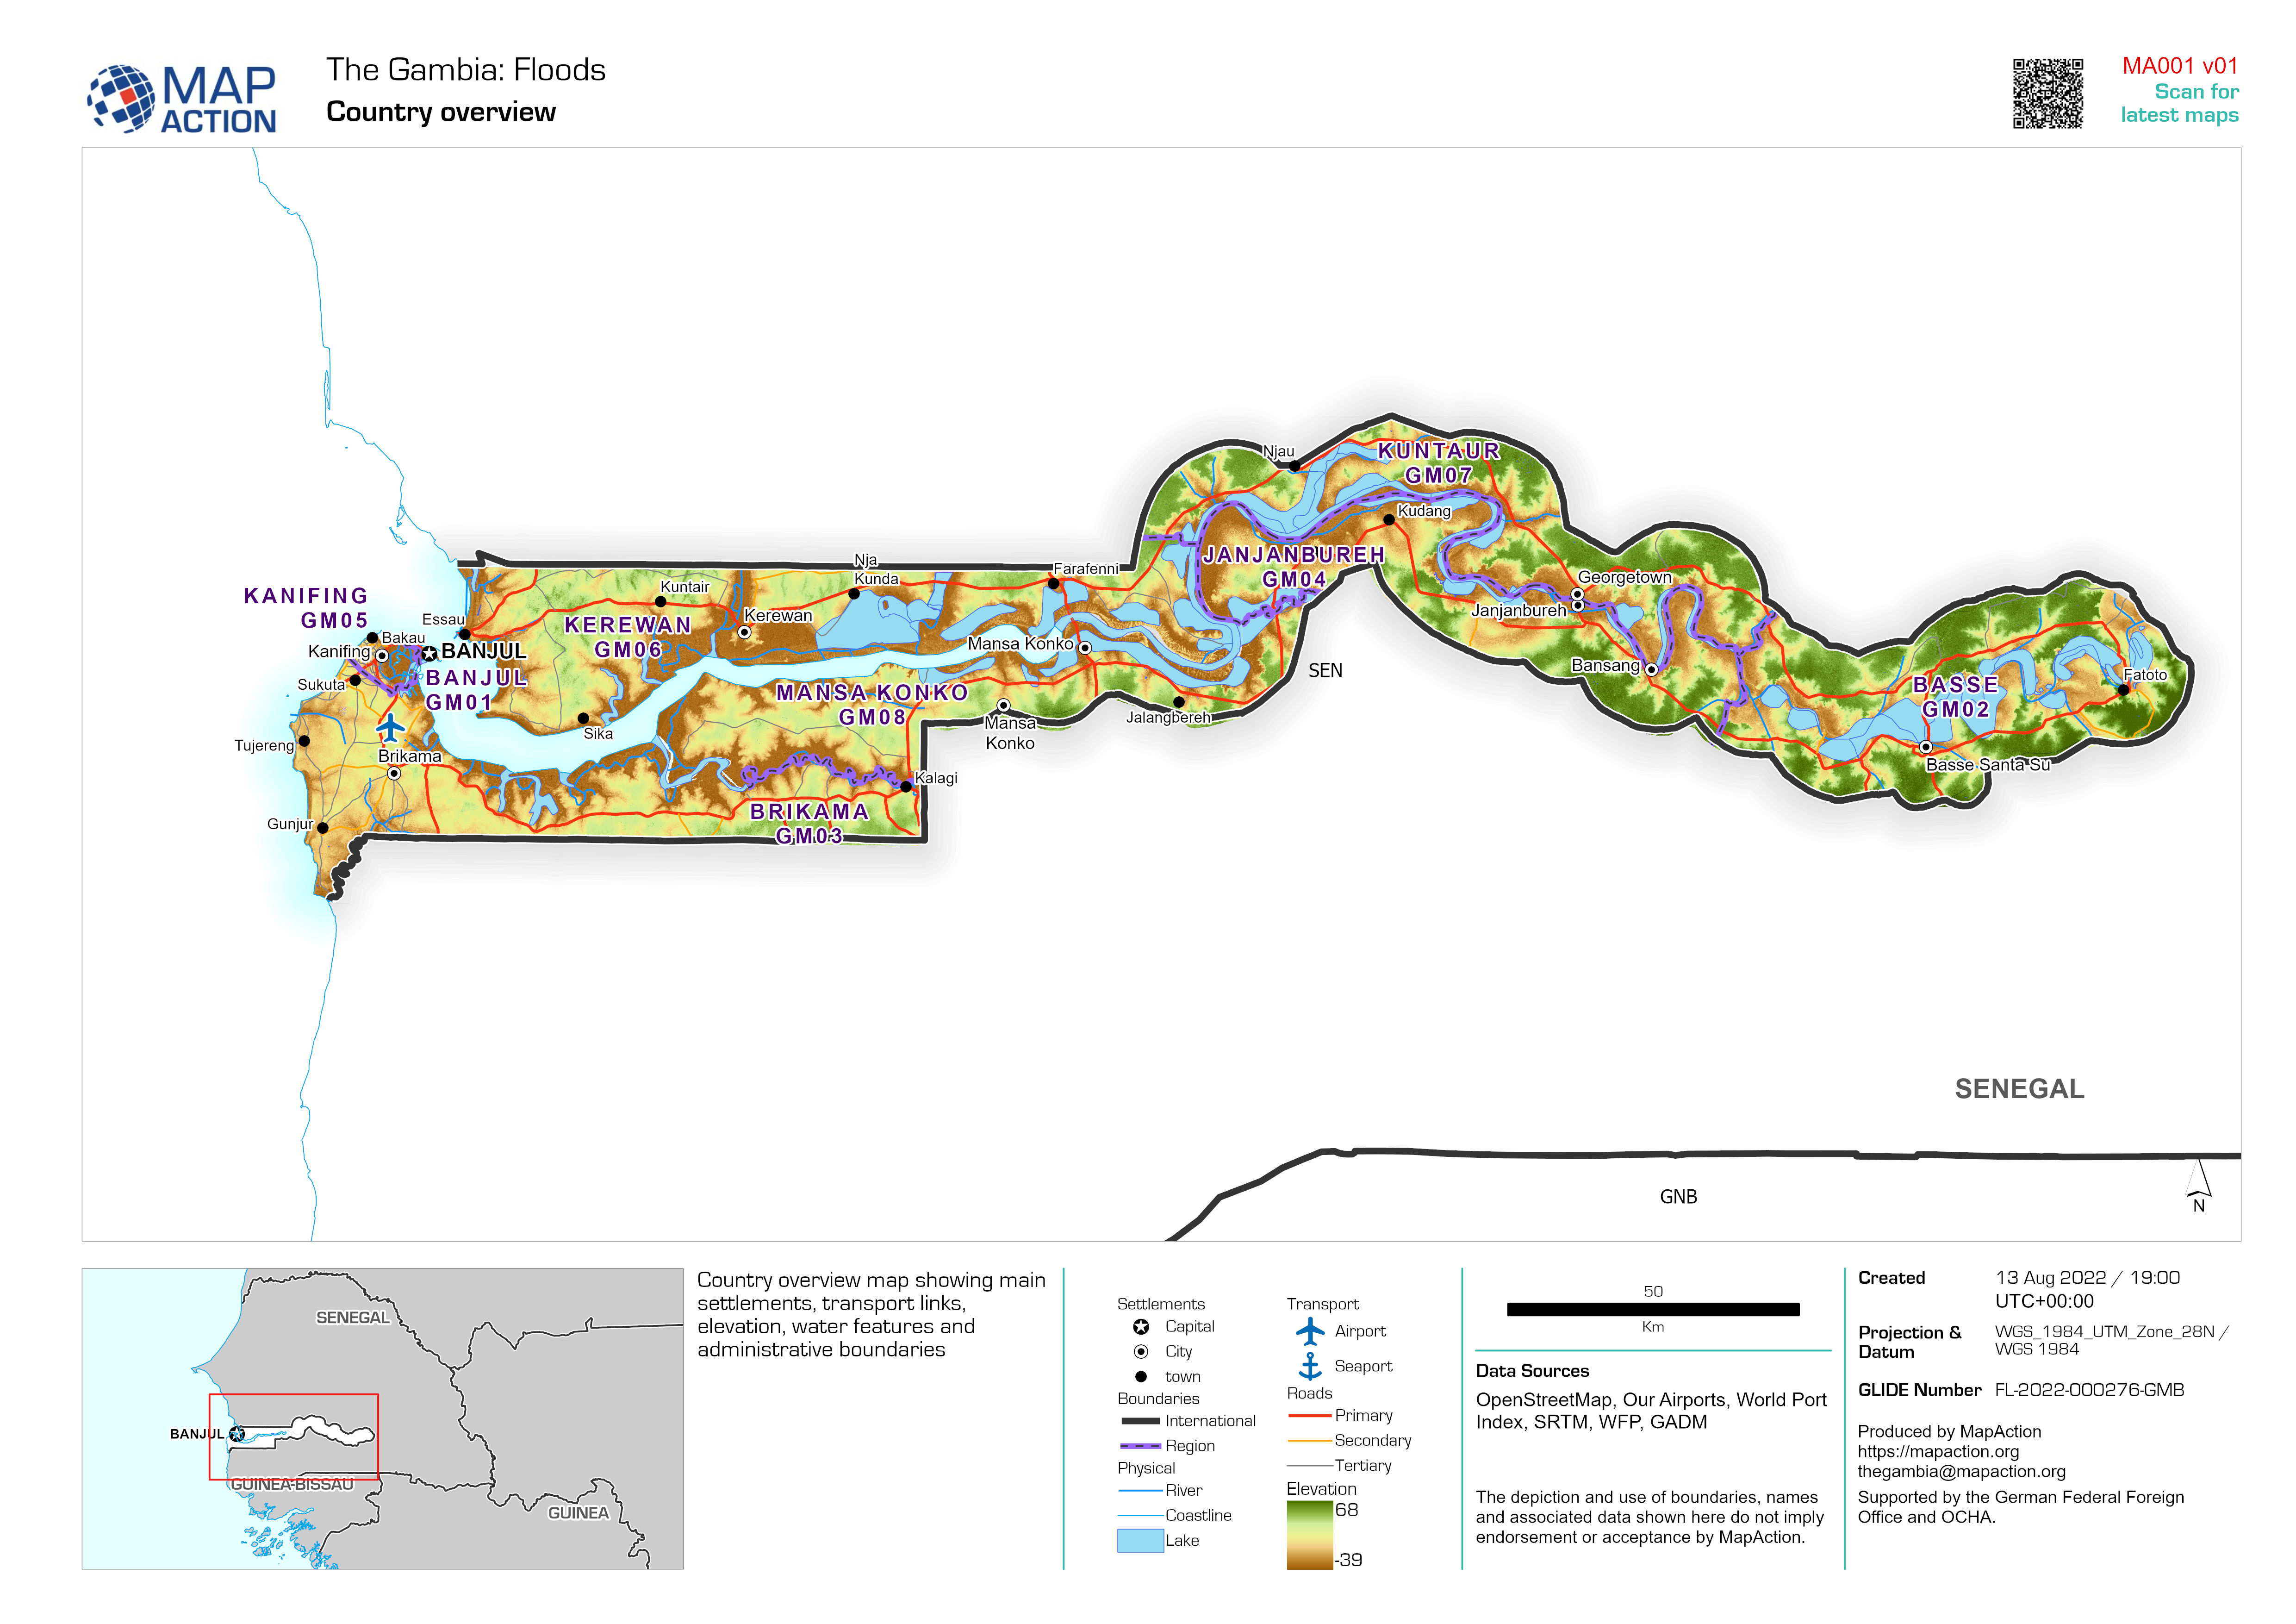
Country overview
Country overview map showing main settlements, transport links, elevation, water features and administrative boundaries -
Who What Where activity at District level on 11th November 2023
Who What Where at District level -

Who What Where activity at Regional level on 11th November 2023
Who What Where at Regional level -

Affected Population from Flooding by District
Percentage affected population. Based on Worldpop baseline estimates for 2020 and Unosat flood extents from 23rd OCtober 2023.. -

-

-

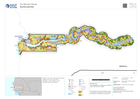
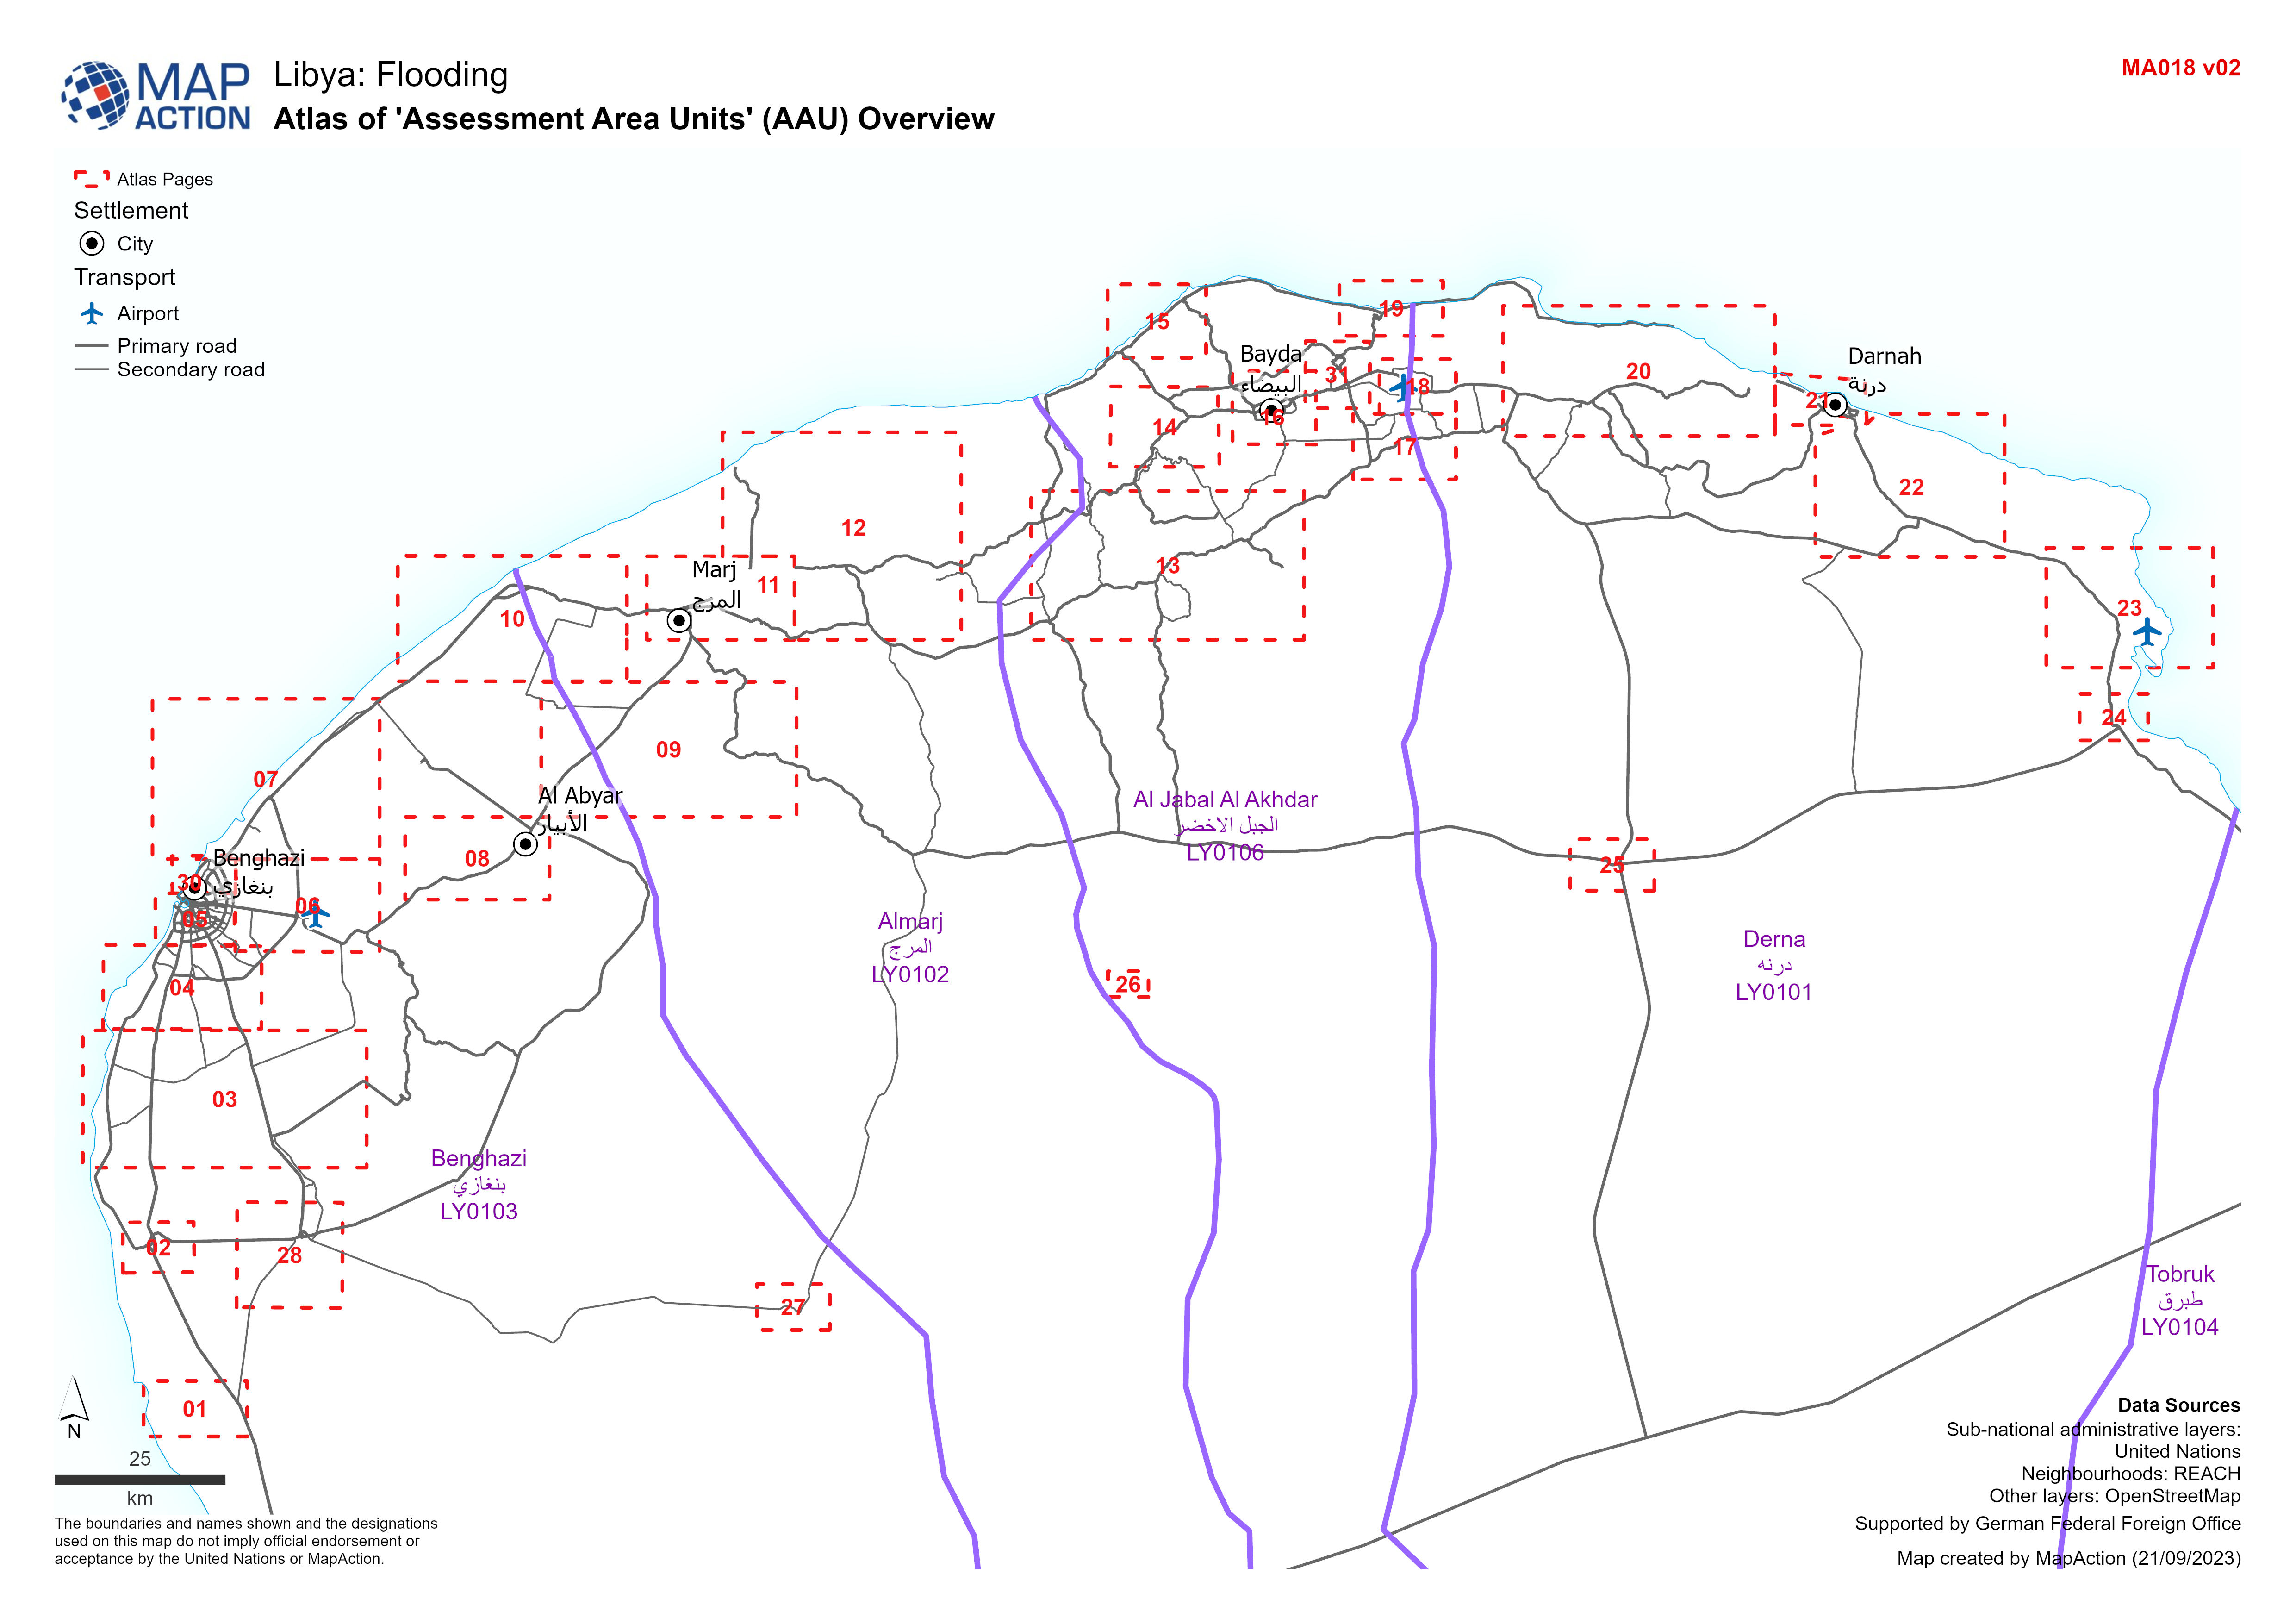
'Assessment Area Units' (AAU) Overview
Showing Assesment Area Units (AAUs) atlas pages for urban area between Benghazi and Derna -
-
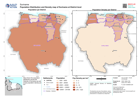
Overview of affected Mantikas with baseline population (from US Census Bureau...
Overview of affected governorates with baseline population (from US Census Bureau 2020 estimate) -

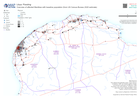
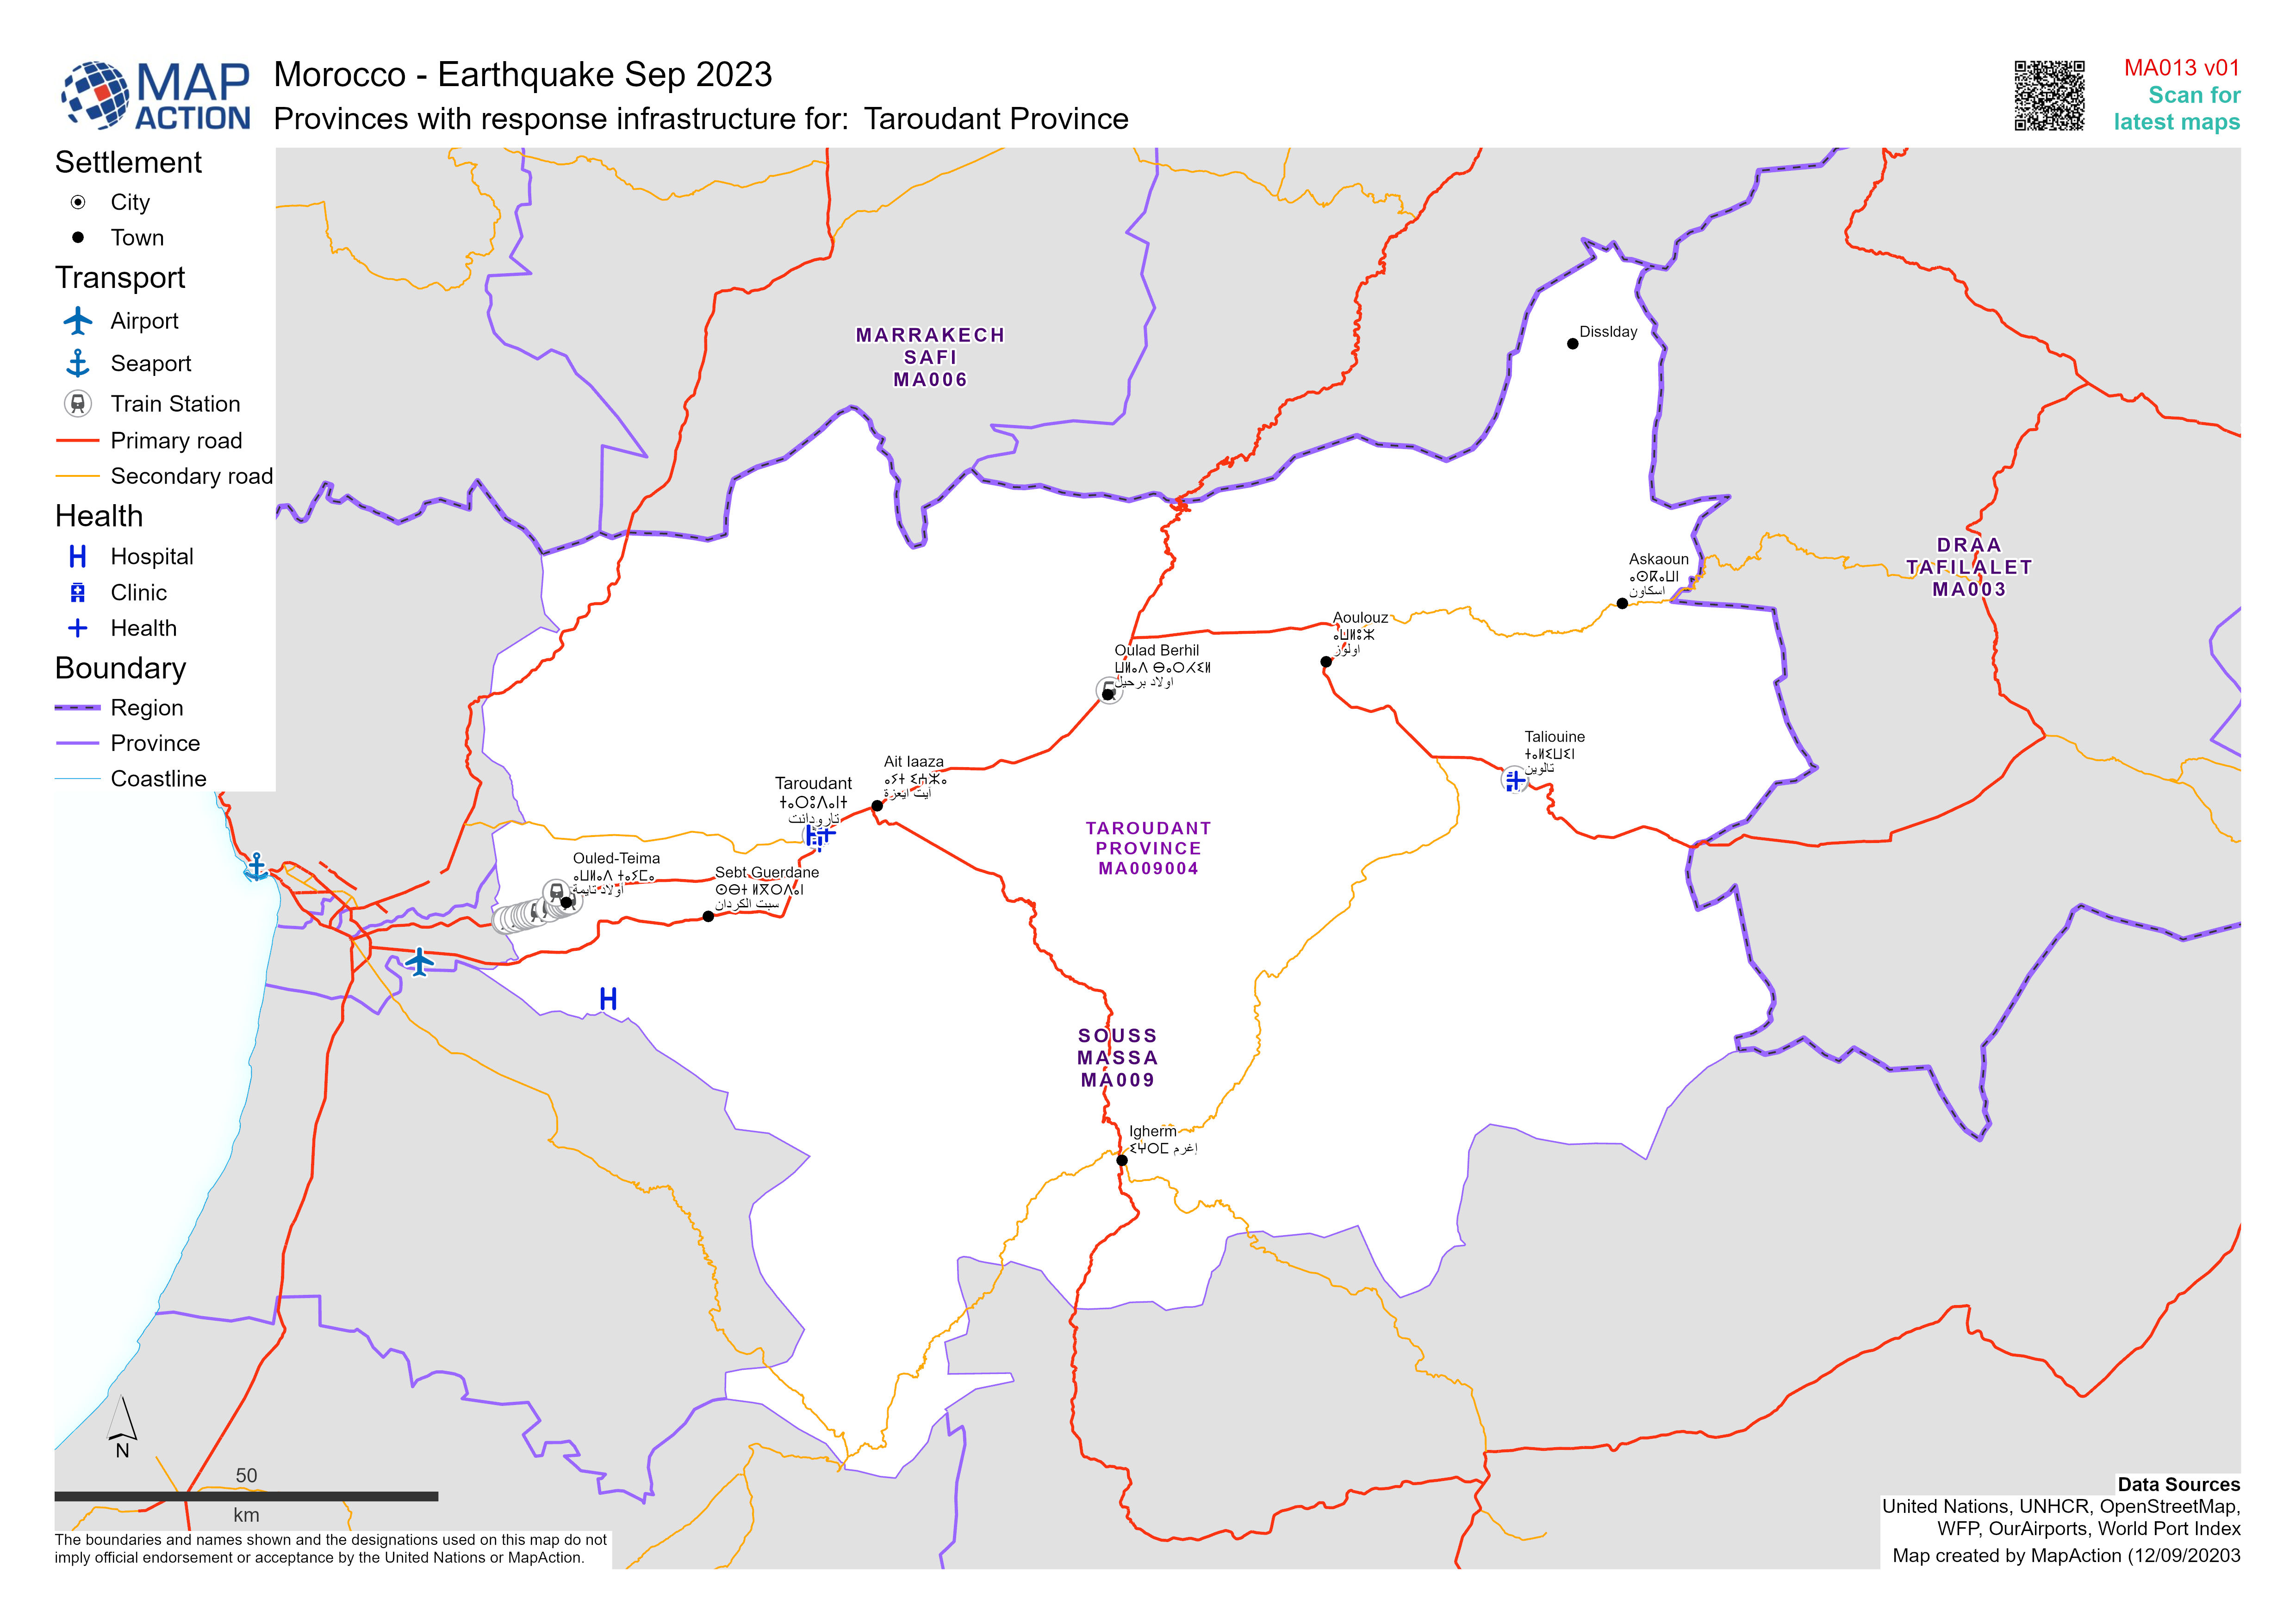
Reference map showing Province of:
Maps of Morocco's affected Province / Prefectures showing administrative boundaries, main settlements and major transport infrastructure -

Shake Intensity and Epicentre with Regions affected and population
Shake Intensity focused on the affected / reported Regions from discussions in the UN Assessment & Analysis cell -

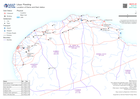
Reference maps showing affected Regions
Maps of affected Regions in Morocco showing administrative boundaries, main settlements and major transport infrastructure -

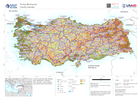
Reference map showing region boundaries and elevation
Morocco country overview showing administrative boundaries, main settlements, transport infrastructure and natural features -

Caserios Aislados en el departamento de Piura
Representación de los caserios aisolados en el departamento de Piura. -

-
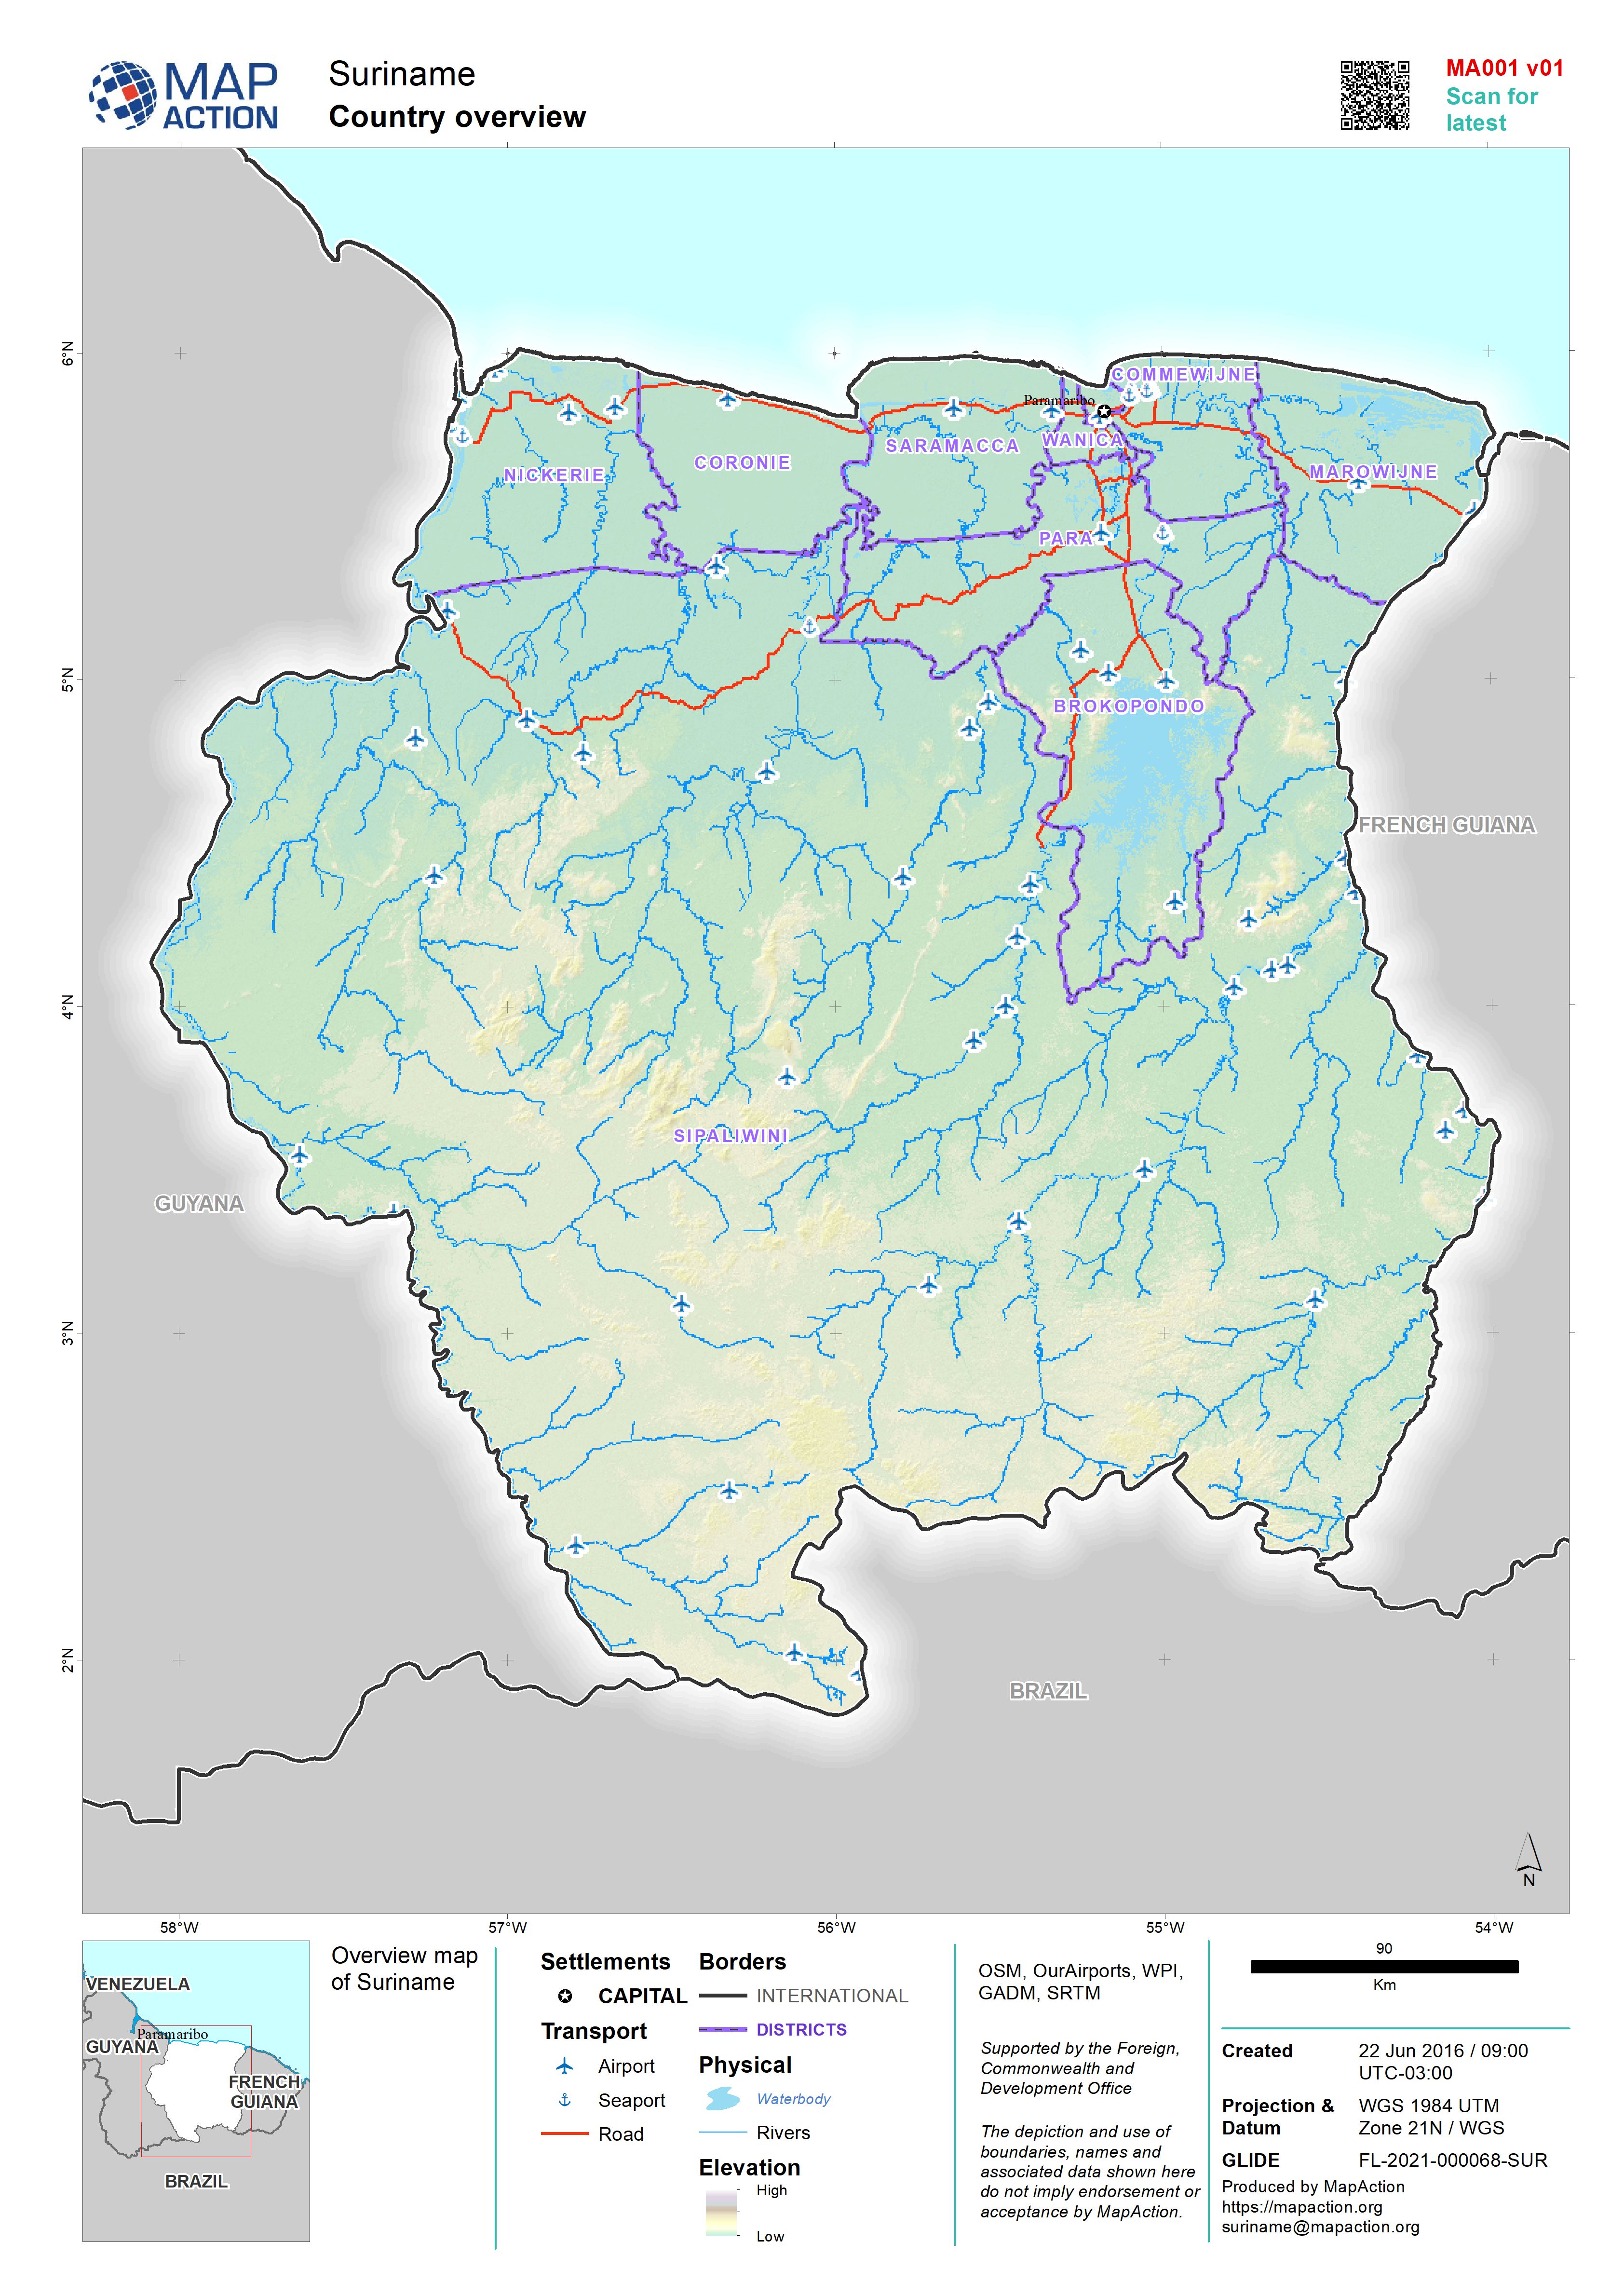
Country overview
Country overview map showing main settlements, transport links, elevation, water features and administrative boundaries -
Provinces (Level 1 Administrative Boundaries)
Map showing major settlements and administrative boundaries at province level -

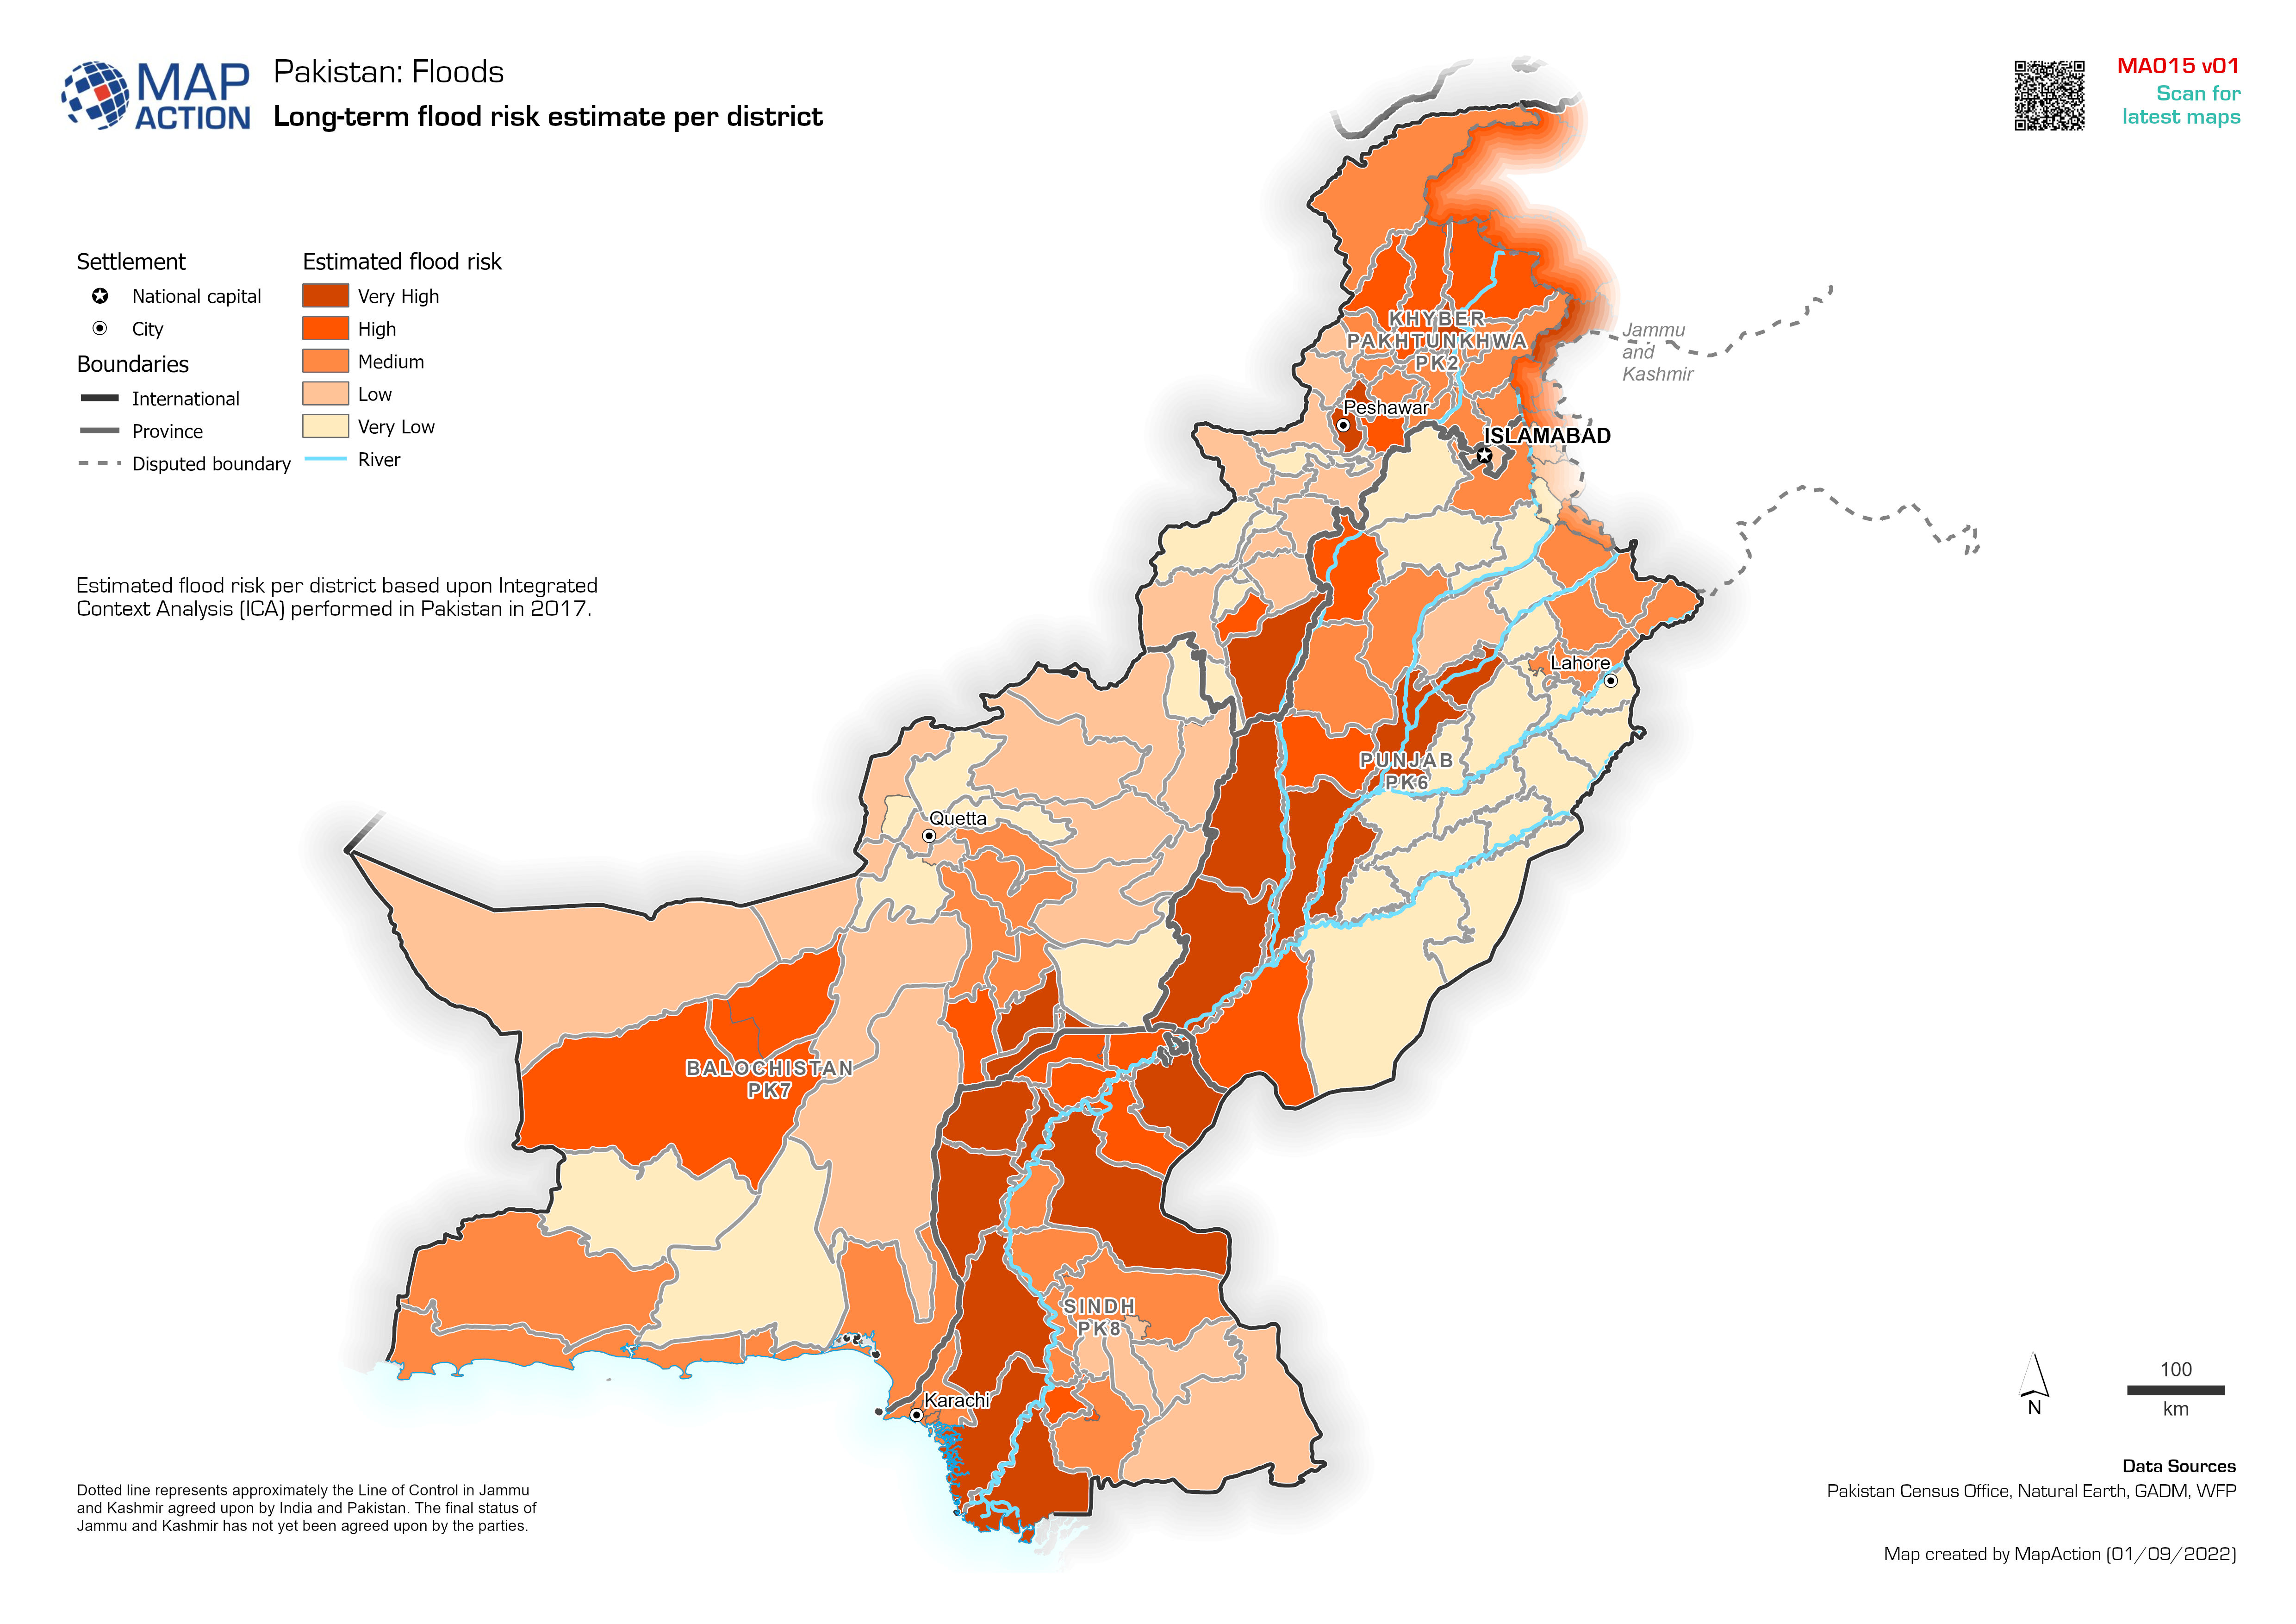
Long-term flood risk estimate per district
Estimated flood risk per district based upon Integrated Context Analysis (ICA) performed in Pakistan in 2017. -
District population baseline
District population baseline and graph shows the split between females and males -
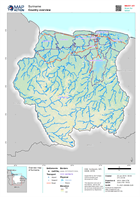
Country overview
Country overview map showing main settlements, transport links, elevation, water features and administrative boundaries -

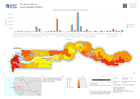
Storm path for cylones Batsirai and Emnati (as of 24 Feb 2022) with populatio...
Storm path for cyclones Batsirai (actual on 6 Feb 2022) and Emnati (predicted as of 24 Feb 2022) with population density (2020 estimate) All forecasted storm positions, path... -

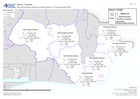
Areas of Control and Conflict Induced Displacement
Areas of influence and arrivals of conflict-displaced Afghans by province in 2021 -
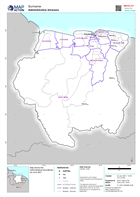
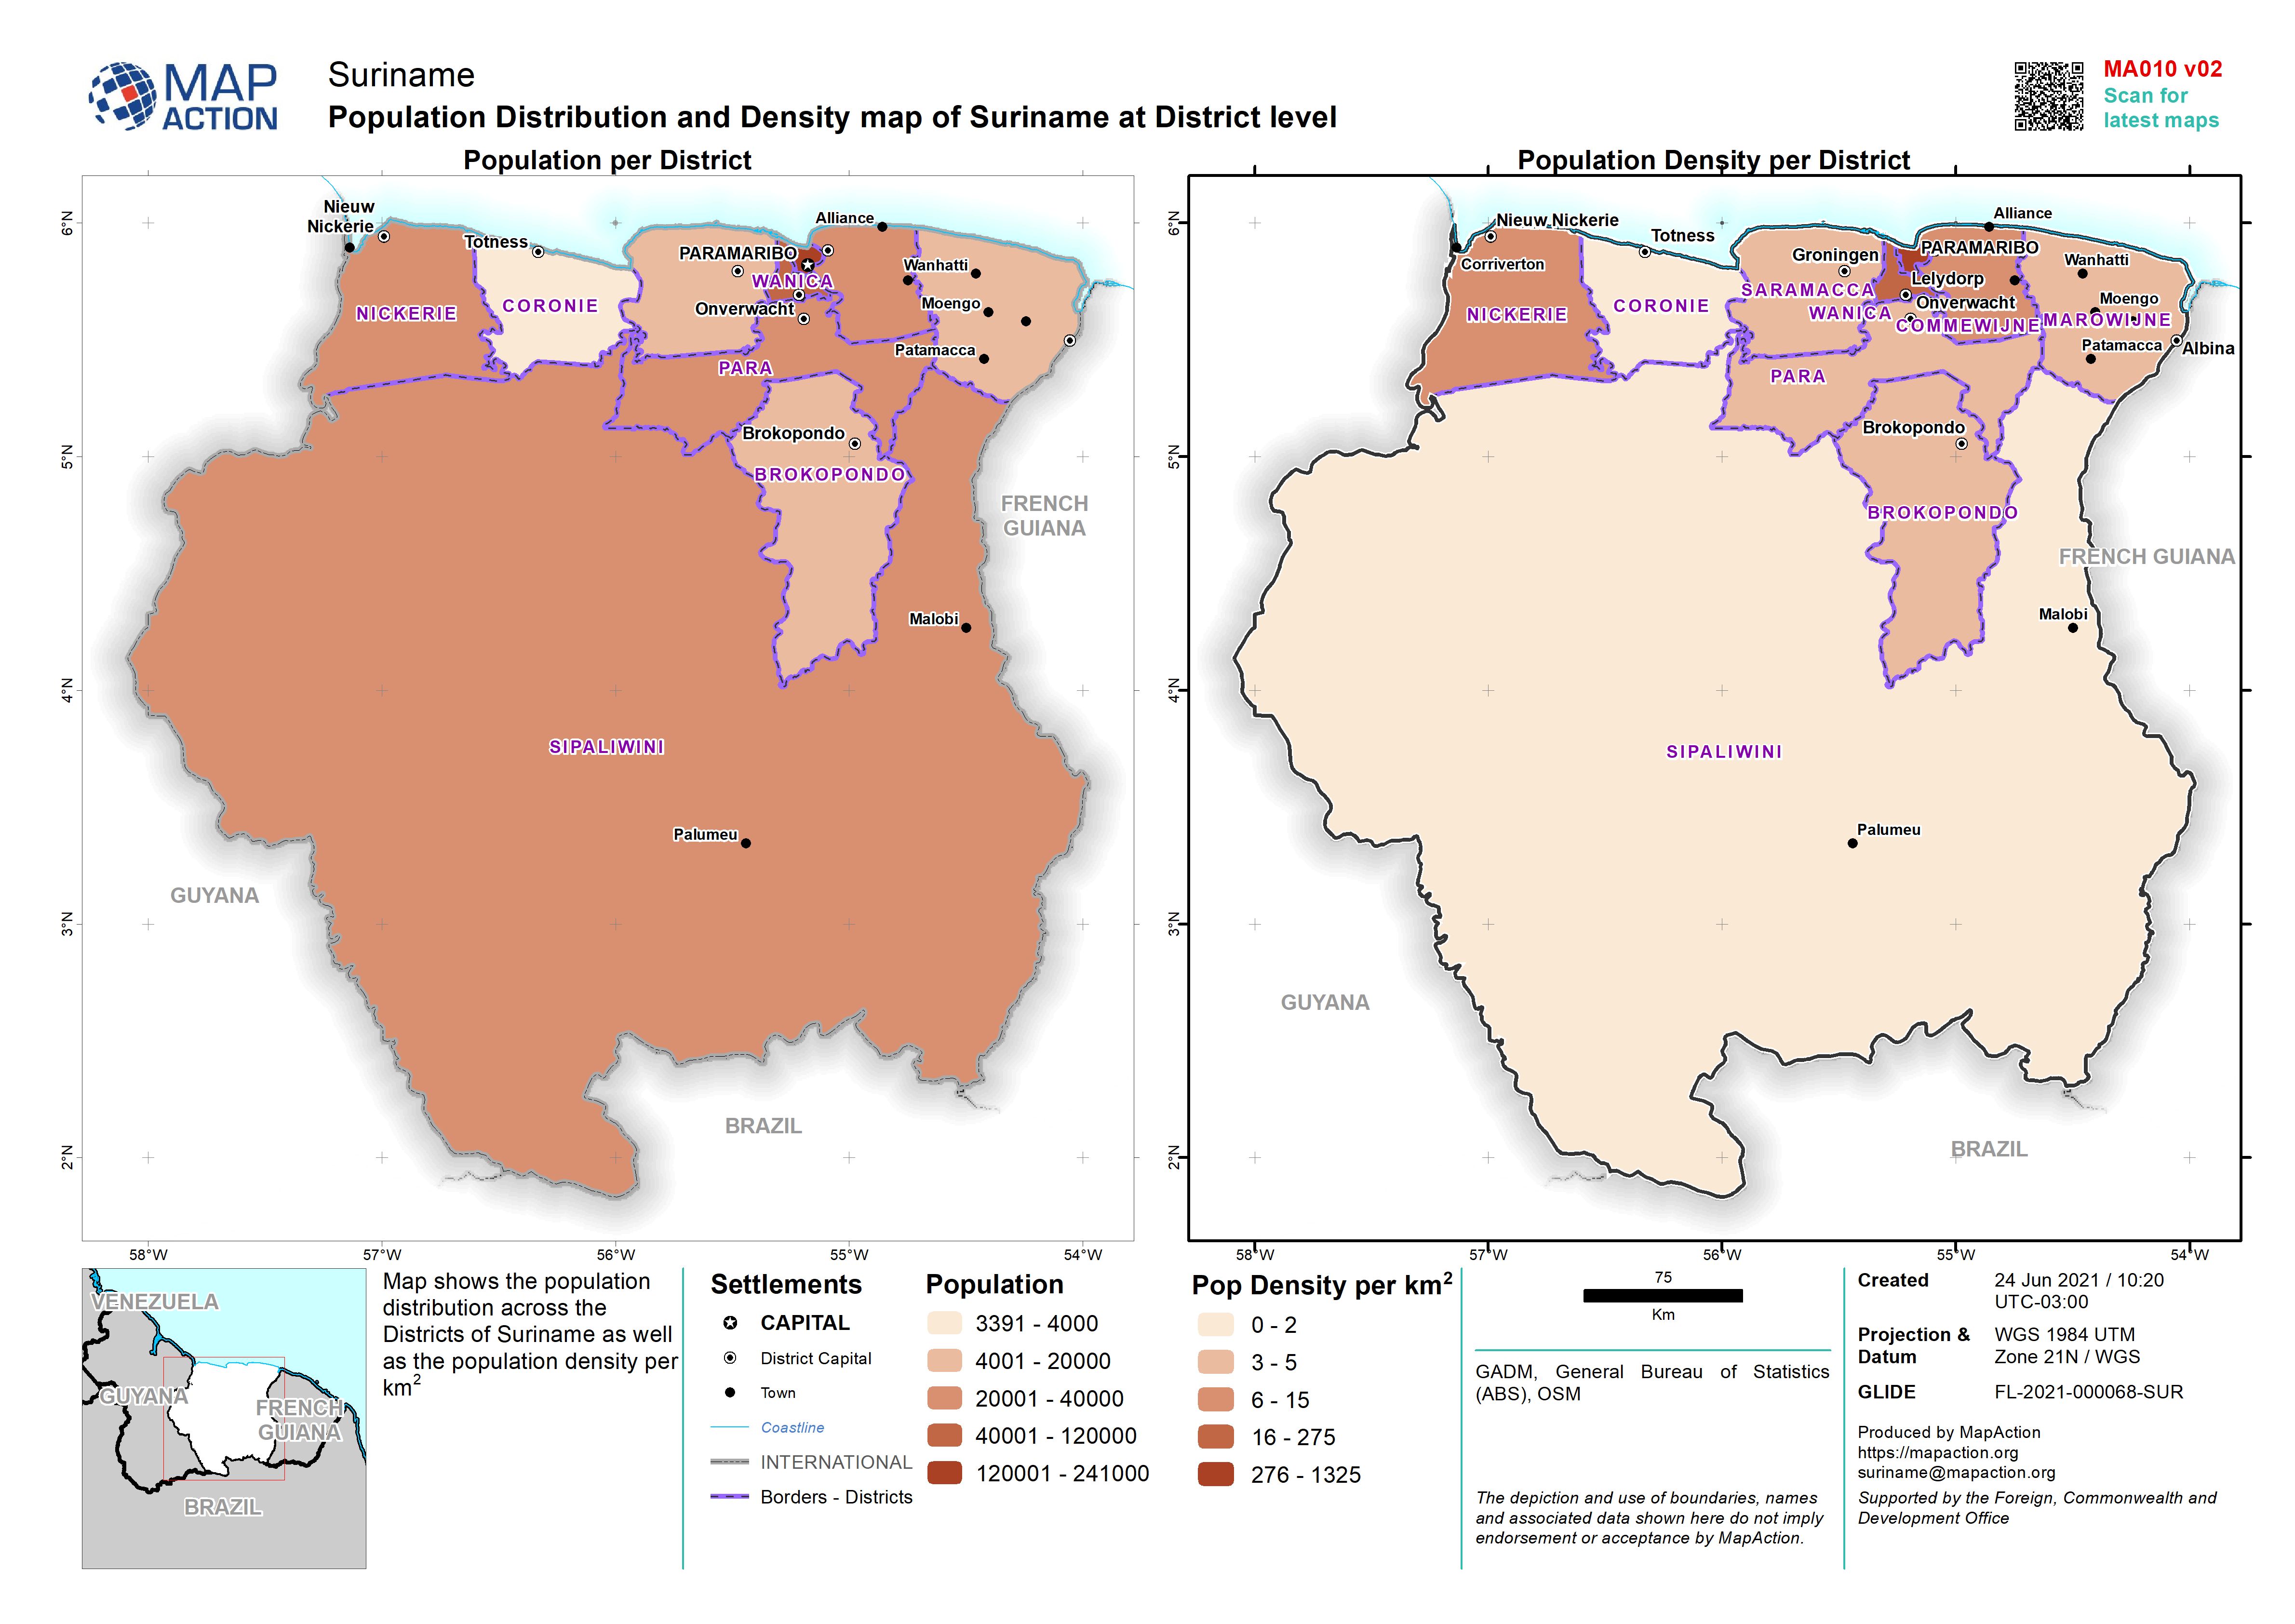
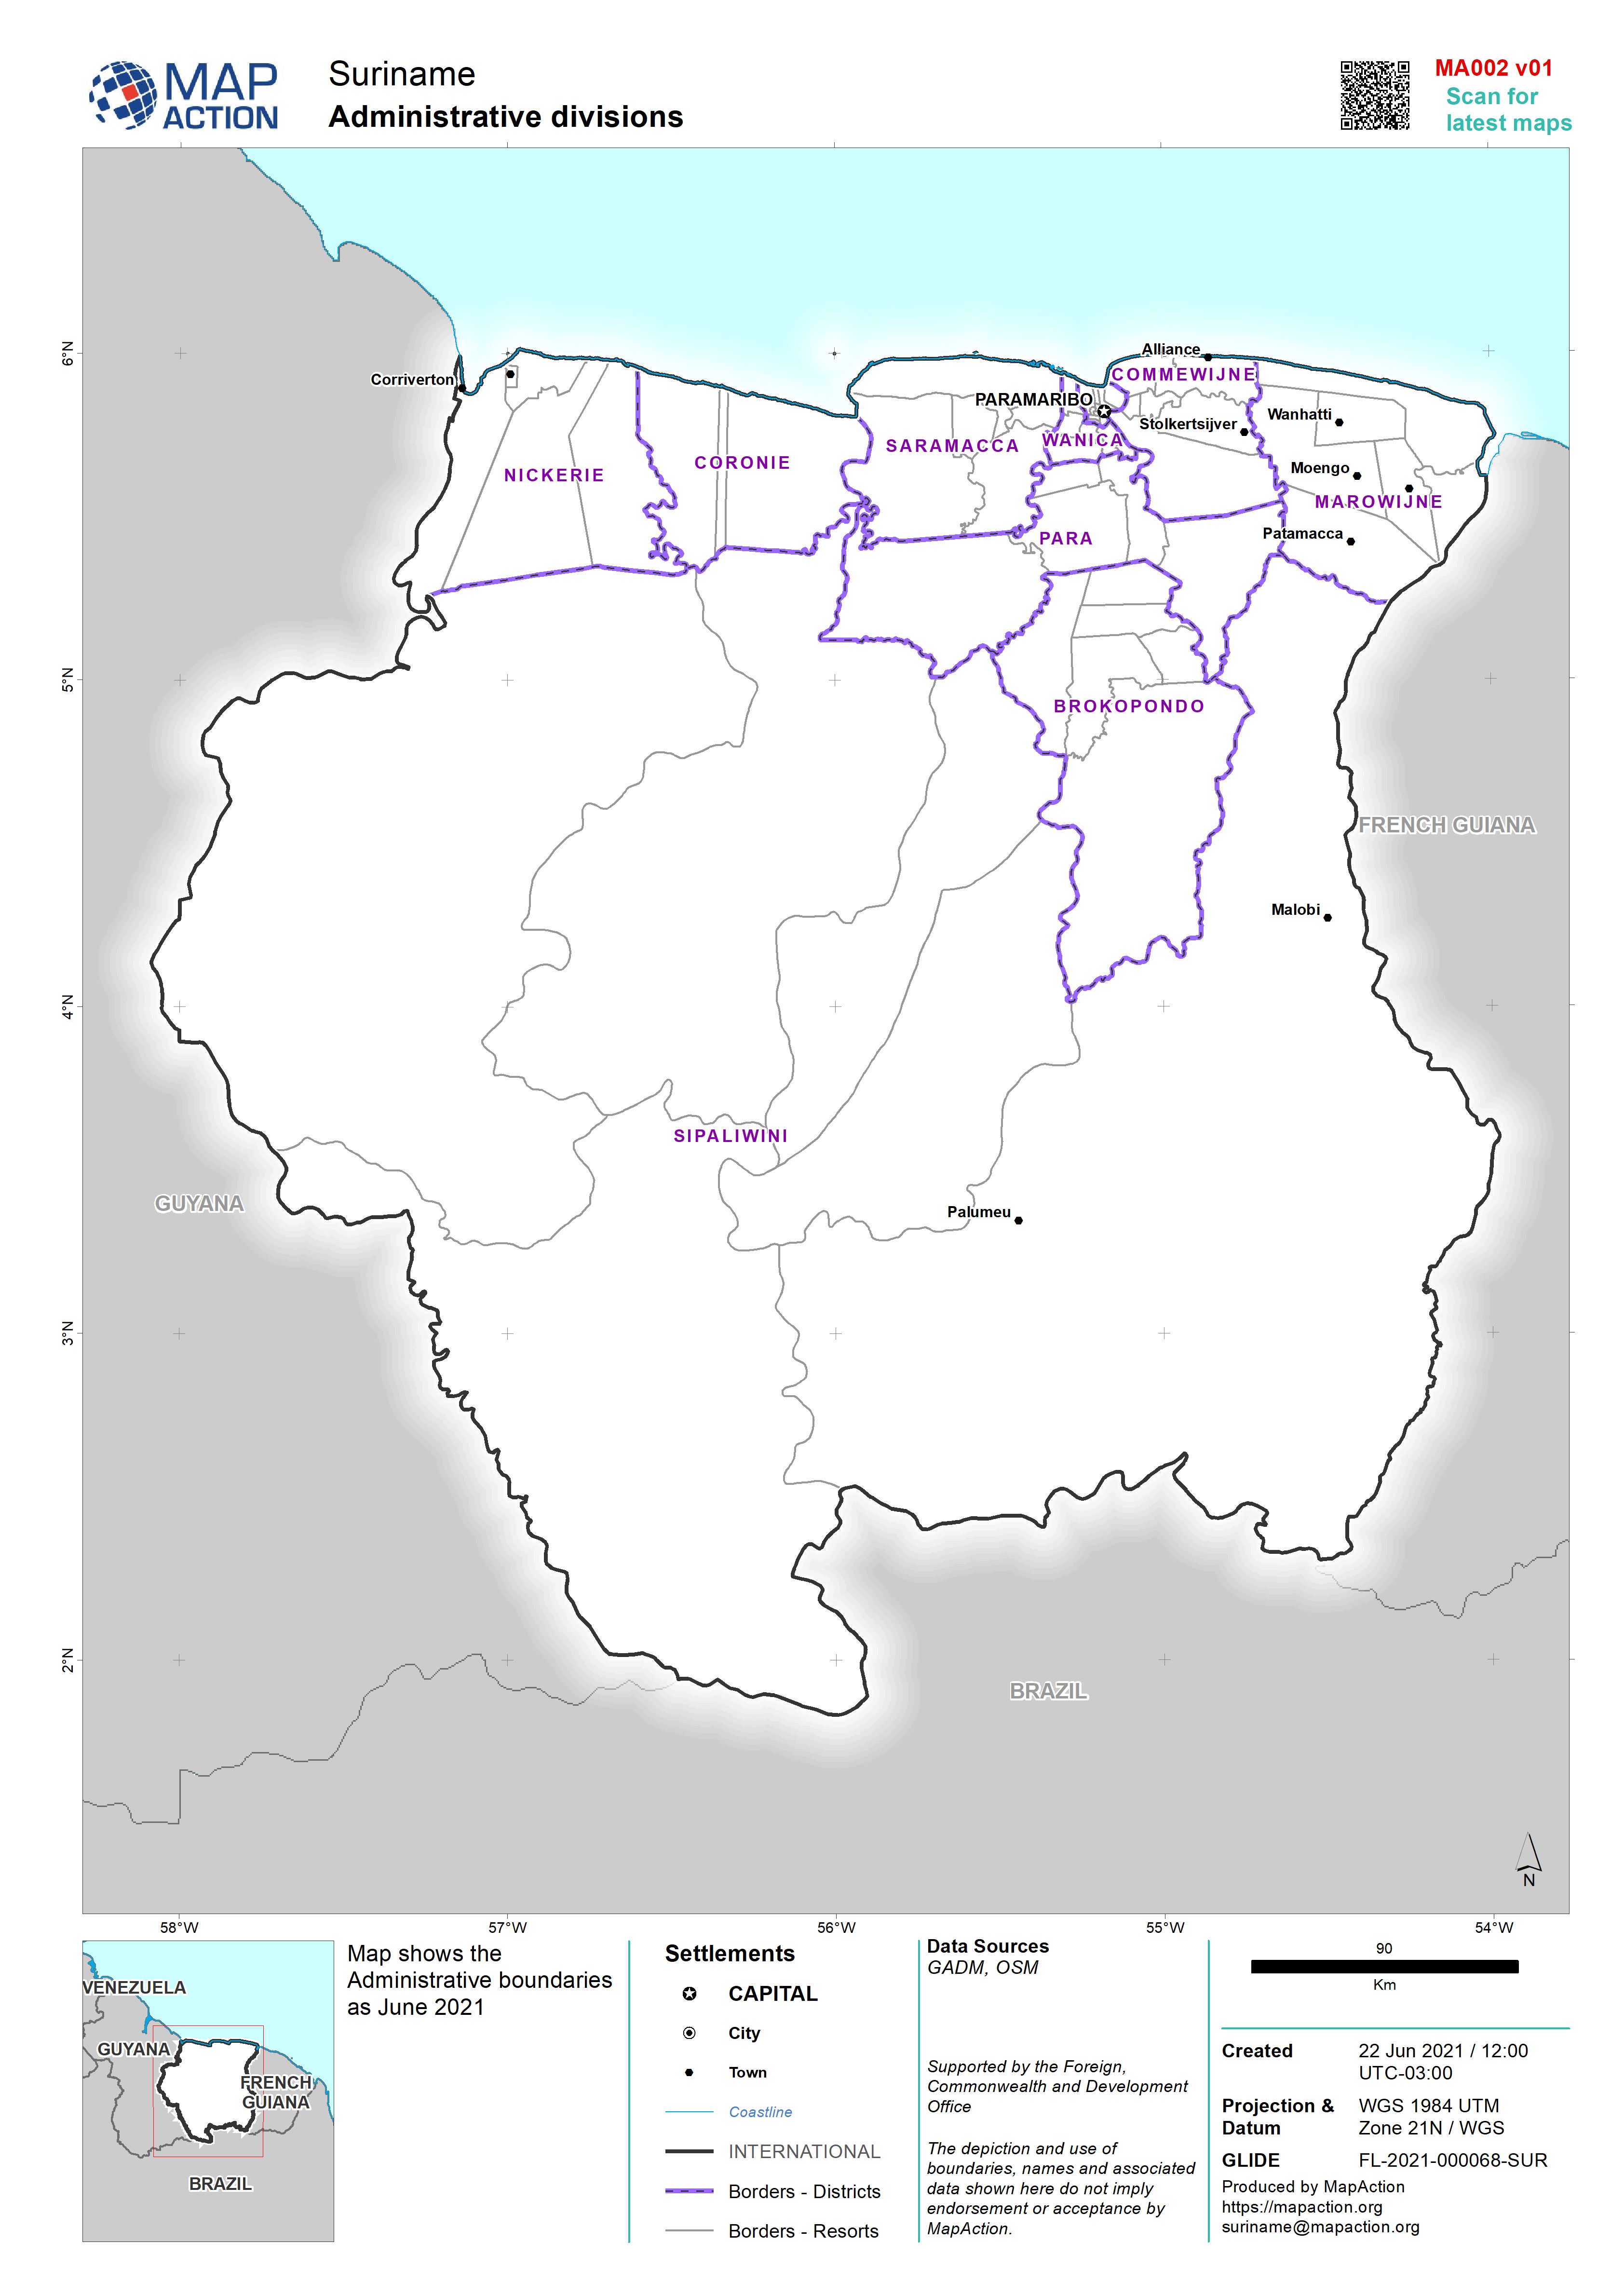
Population Distribution and Density map of Suriname at District level
Map shows the population distribution across the Districts of Suriname as well as the population density per km2 -

Population Distribution and Density map of Suriname at District level
Map shows the population distribution across the Districts of Suriname as well as the population density per km2 -
-
-

Colombia: Flash Environment Assessment Tool (FEAT) data: Overview of San Andr...
Flash Environment Assessment Tool (FEAT) data: Overview of San Andrés and Providencia -
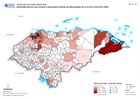
Honduras: Damaged Infrastructure in each Municipality - Departments (as at 12...
Honduras, Damaged Infrastructure as of 12:00 on 22nd Nov 2020 (Displayed per Admin 1 / Department) -

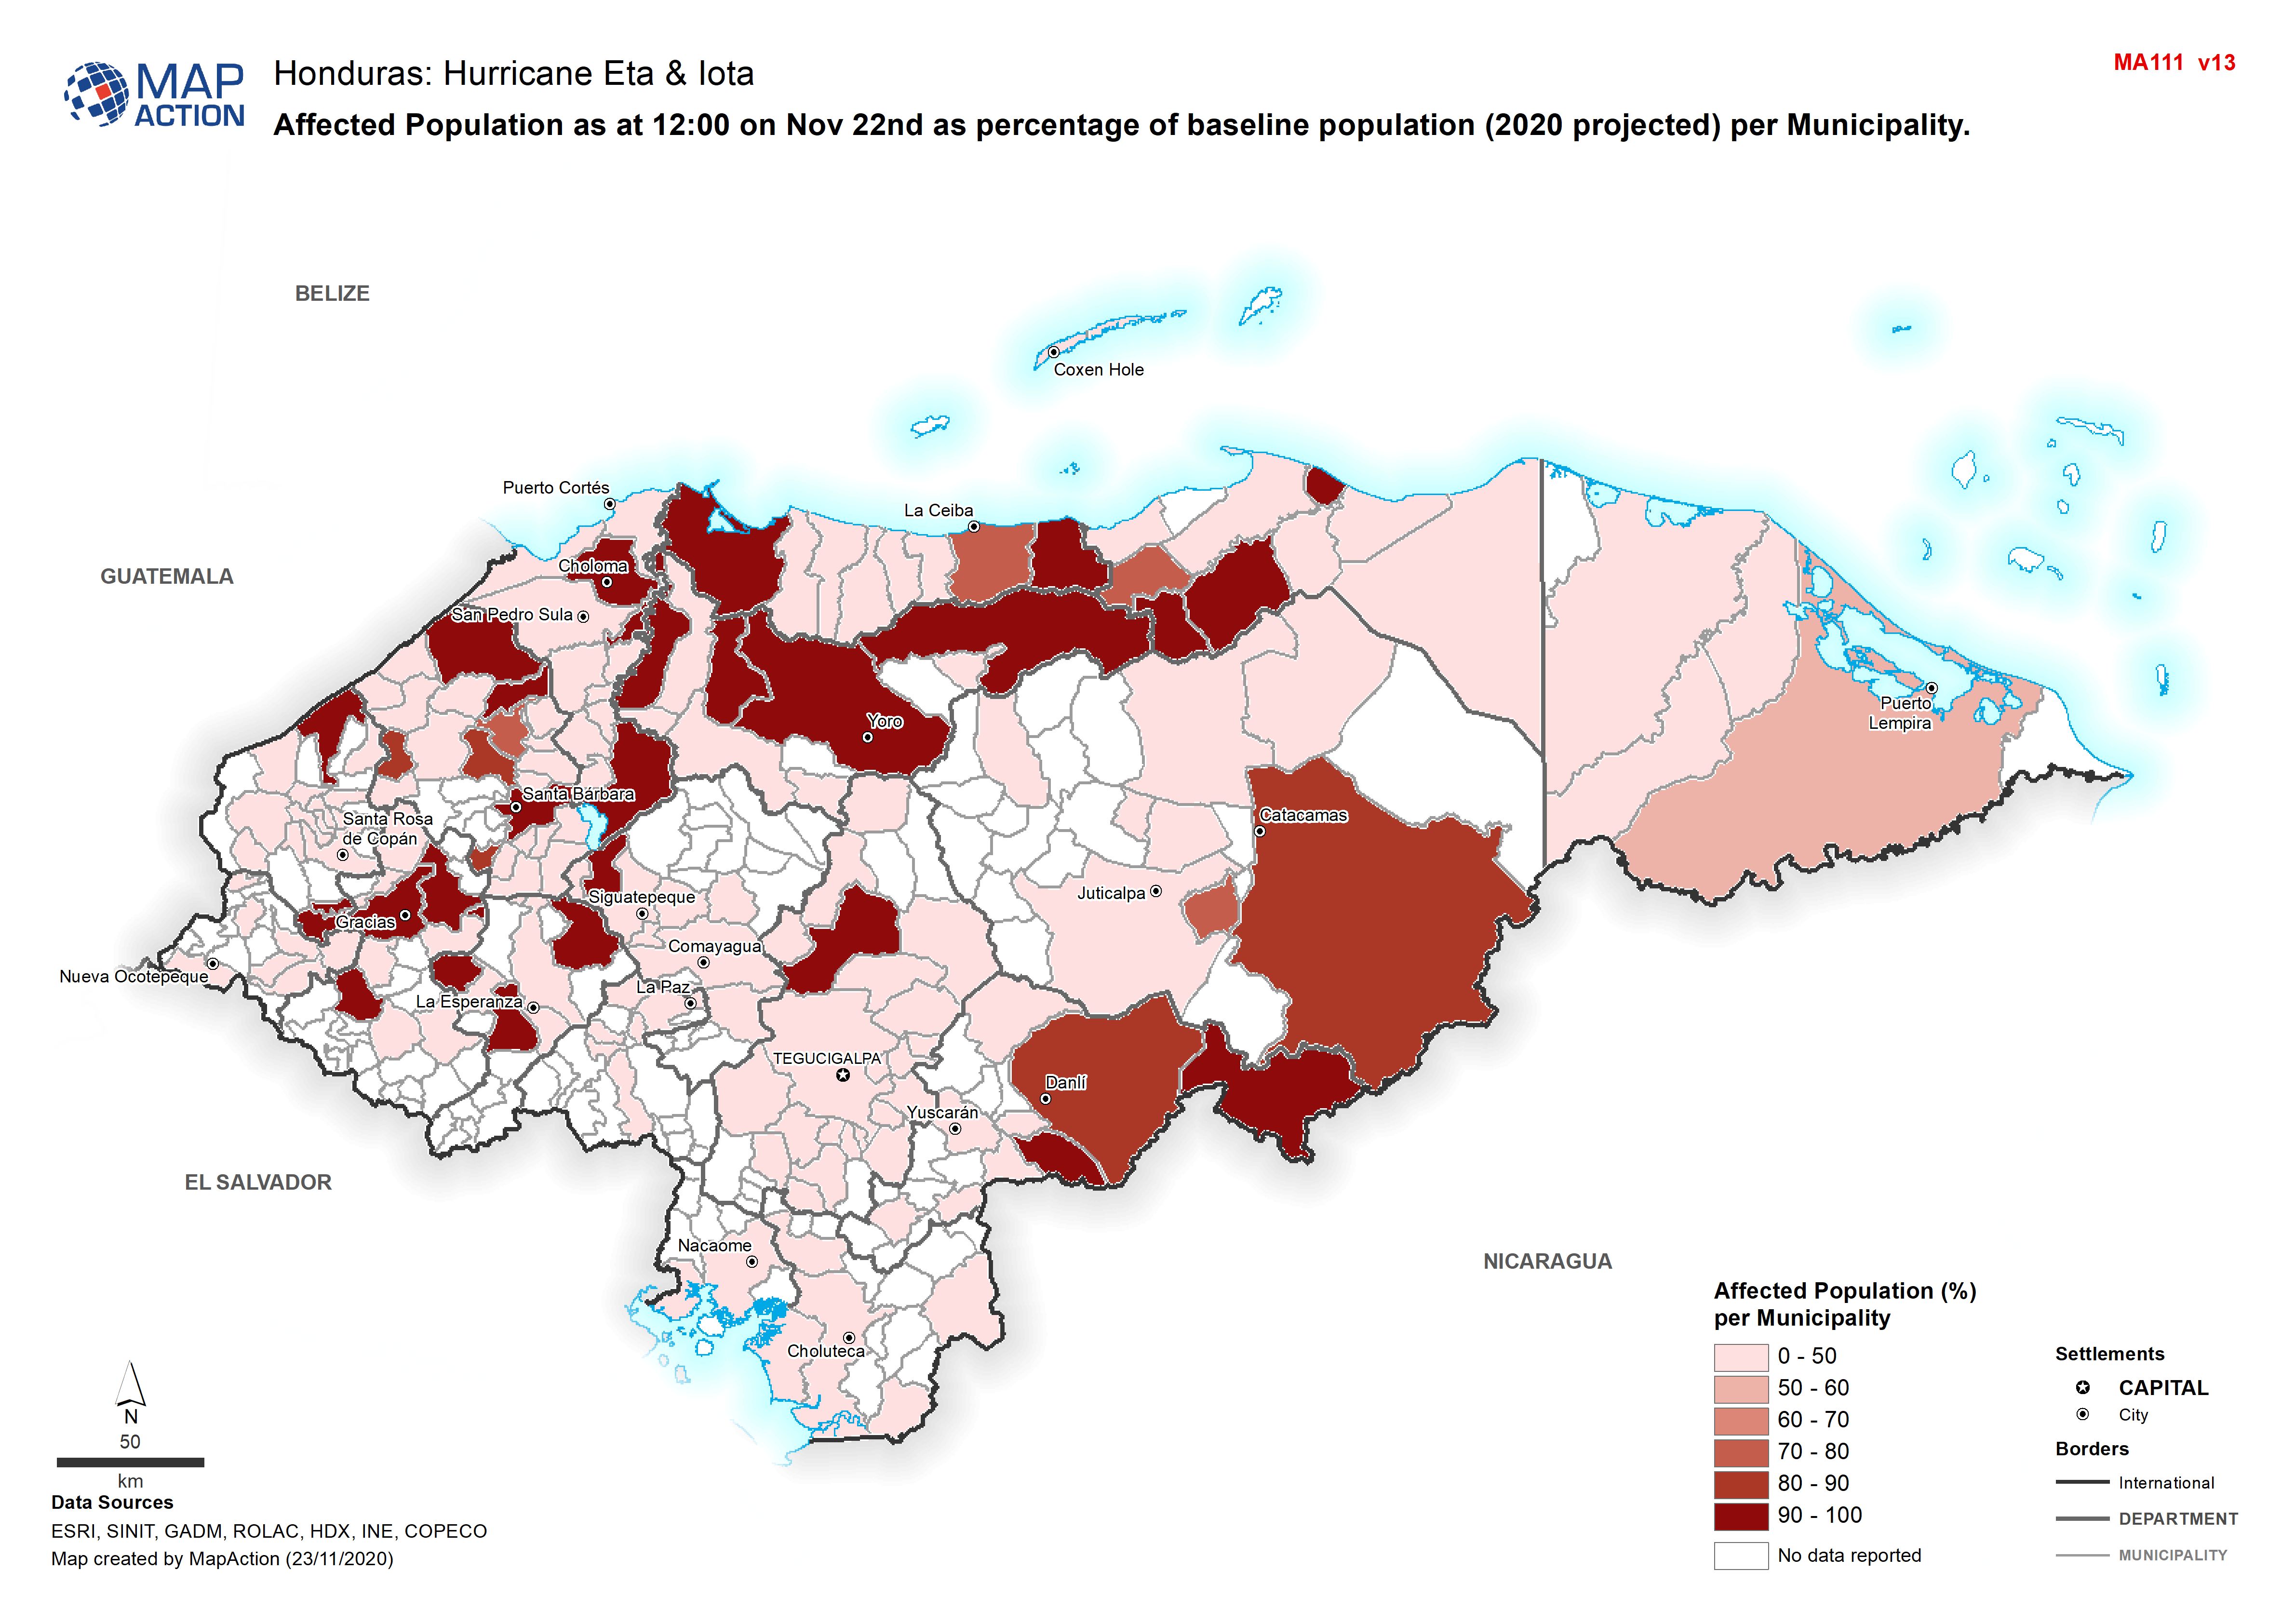
Honduras: Affected Population as at 12:00 on Nov 22nd as percentage of baseli...
Map shows affected population as at 12:00 on Nov 22nd as percentage of baseline population (2020 projected) per Municipality. -
Honduras: Evacuated Persons and number of Evacuation Centres per Municipality...
Map shows evacuated persons and number of evacuation centres per Municipality (as at 12:00 on 22nd Nov 2020) -

-

-
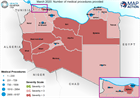
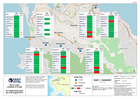
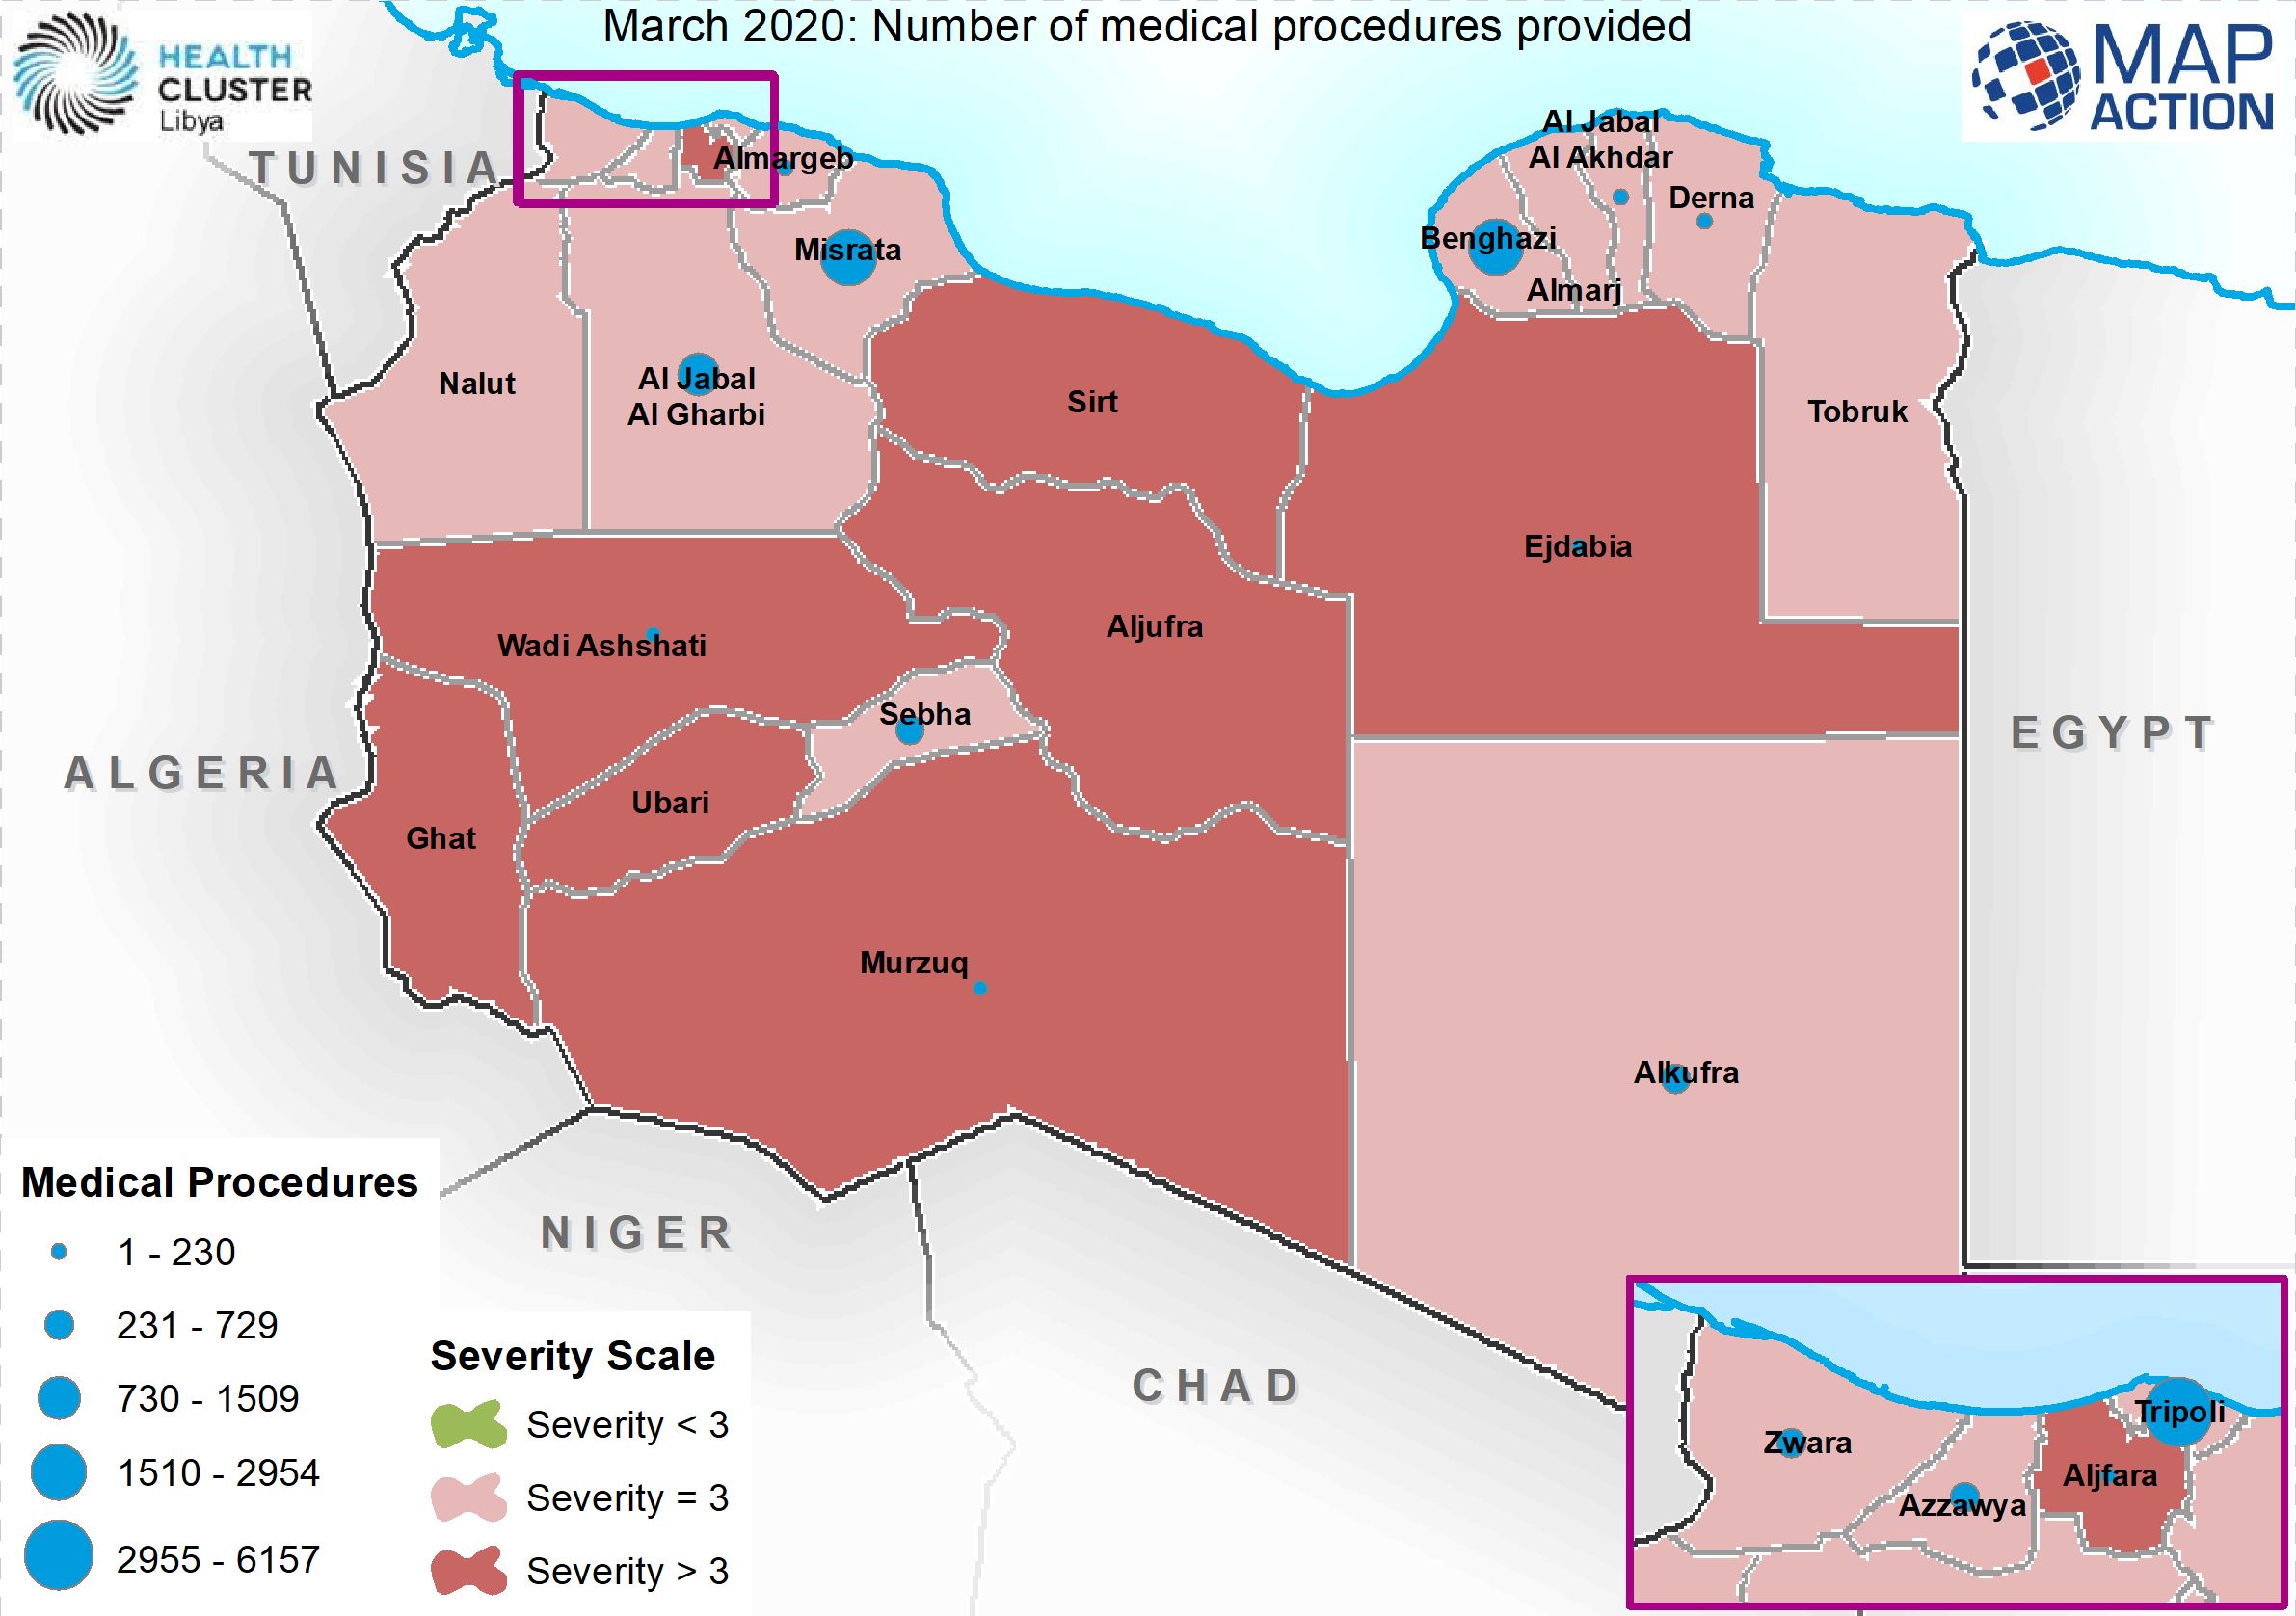
March 2020: Number of medical procedures provided
This map shows the number of medical facilities supported by WHO during the month of March 2020 -

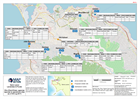
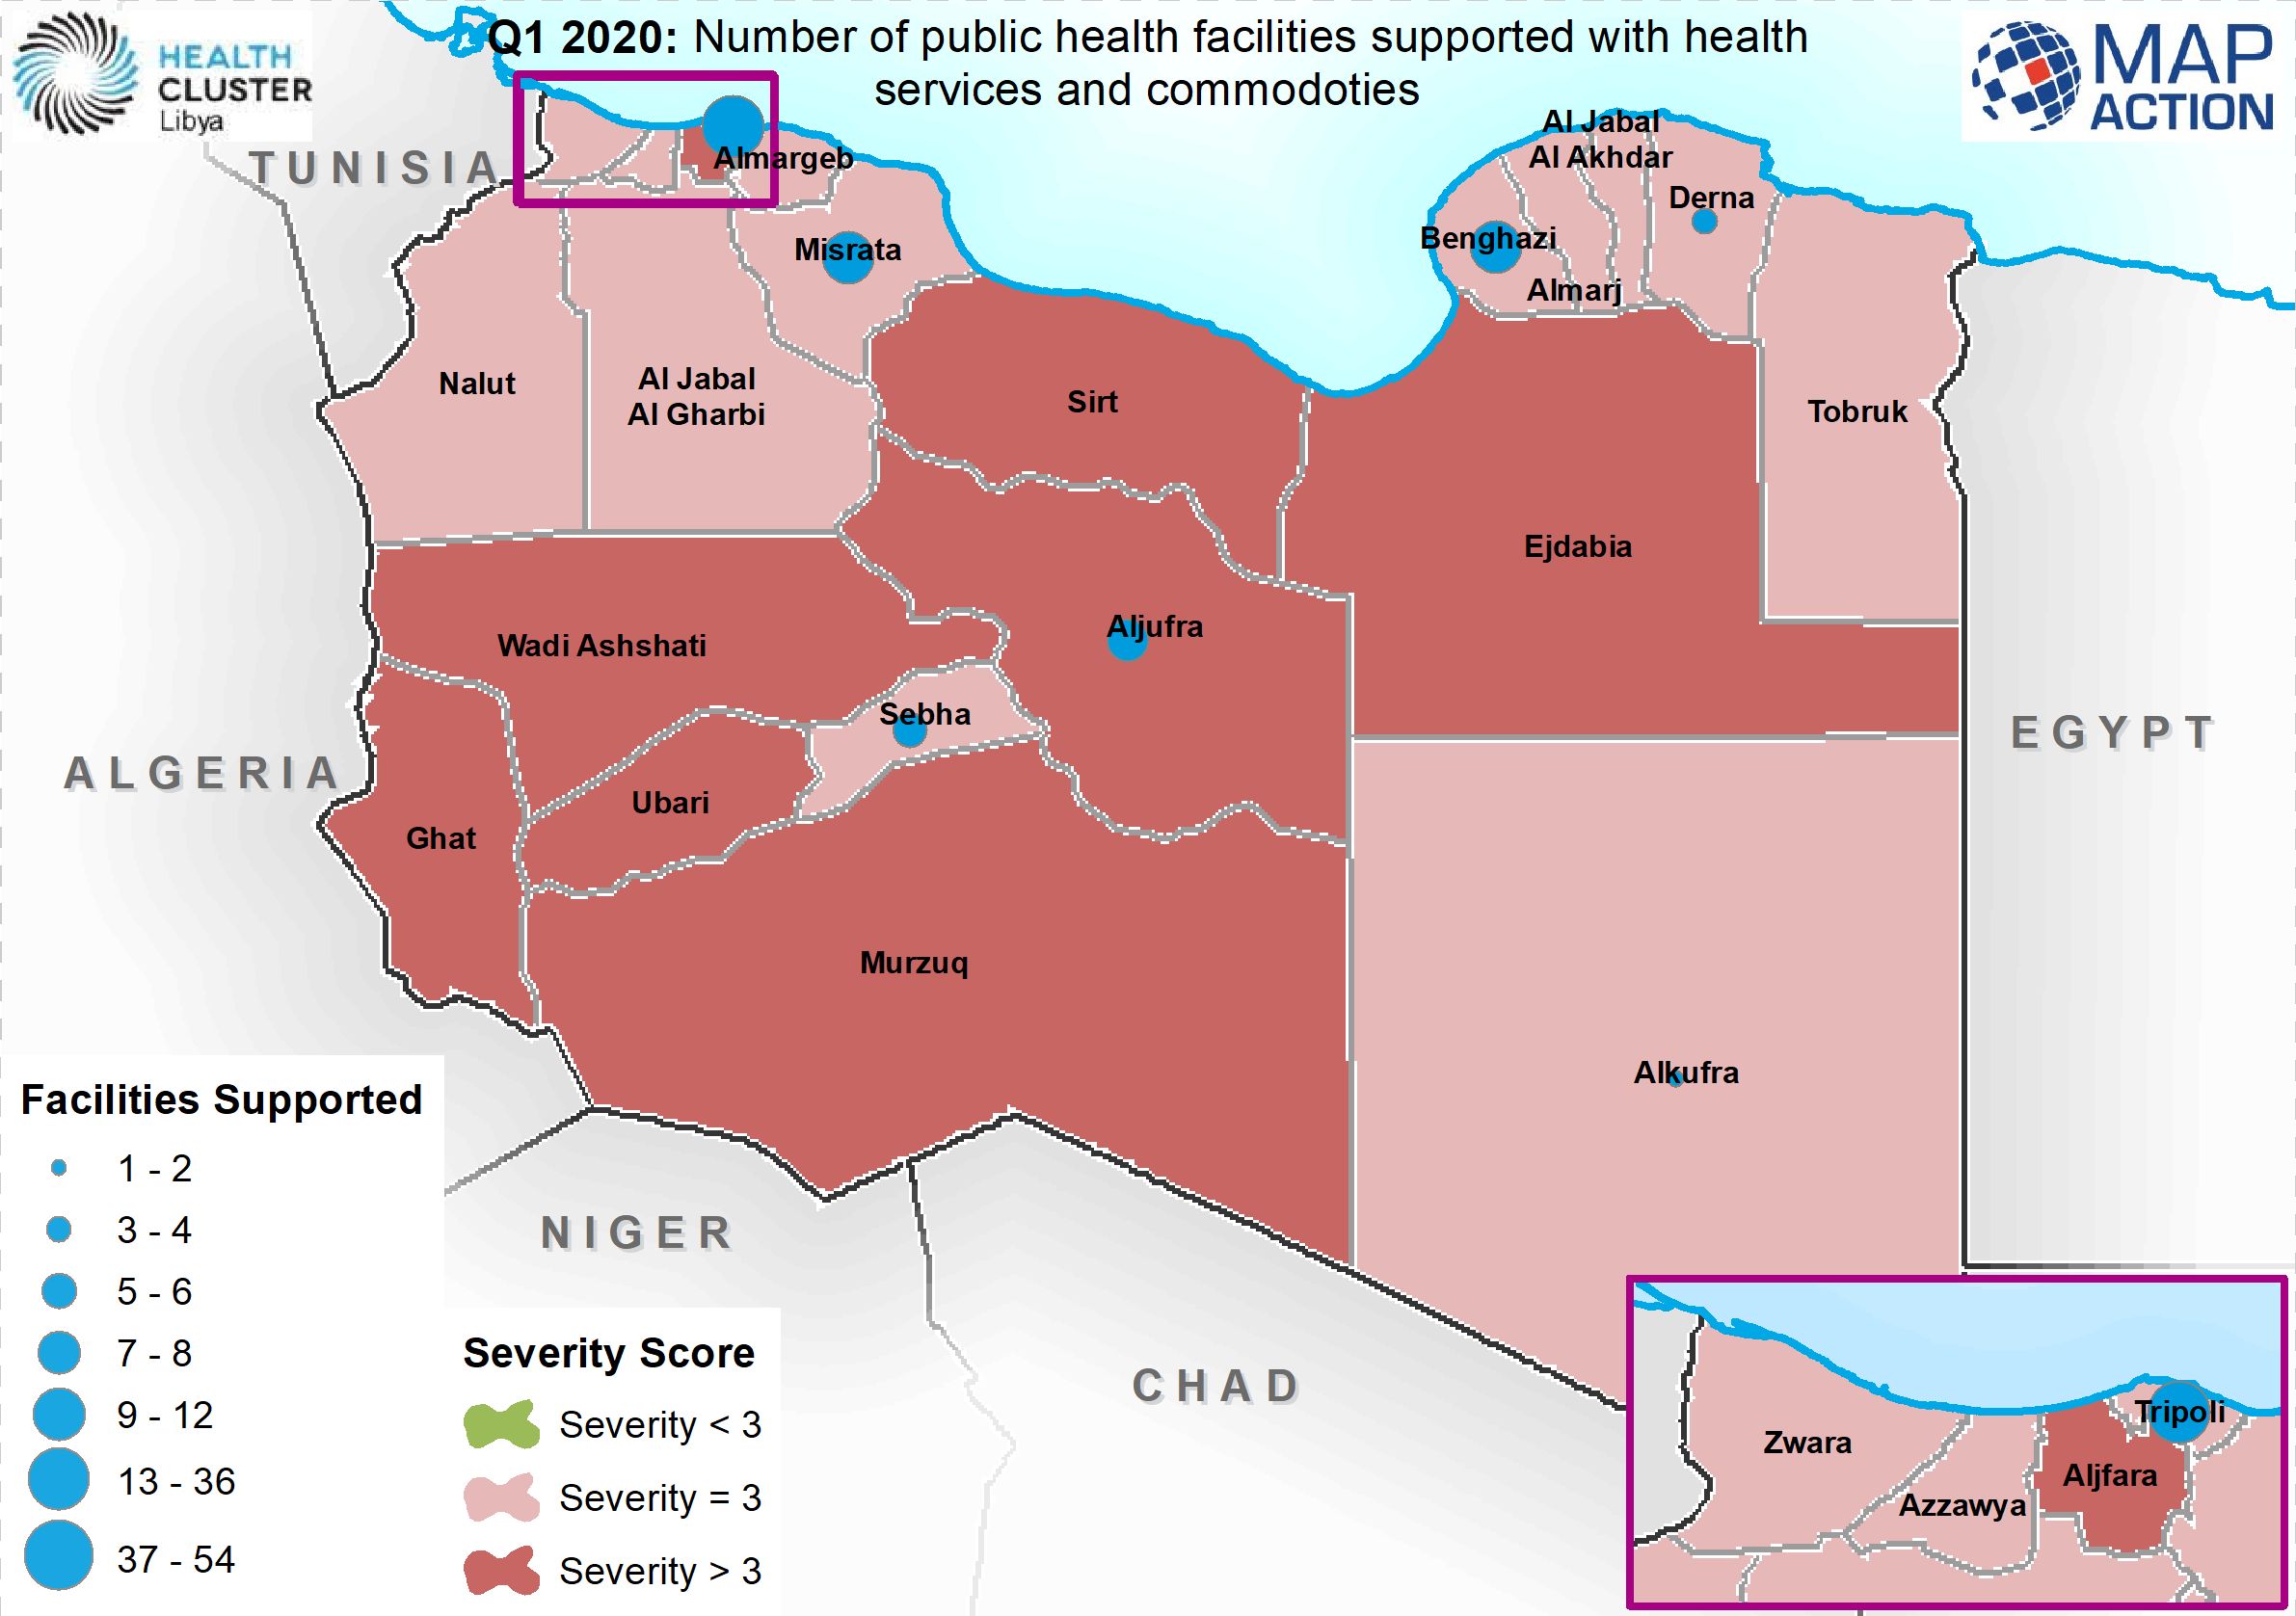
Q1 2020: Number of public health facilities supported with health services an...
Map shows the number o public health facilities supported in the first 3 months of 2020 -

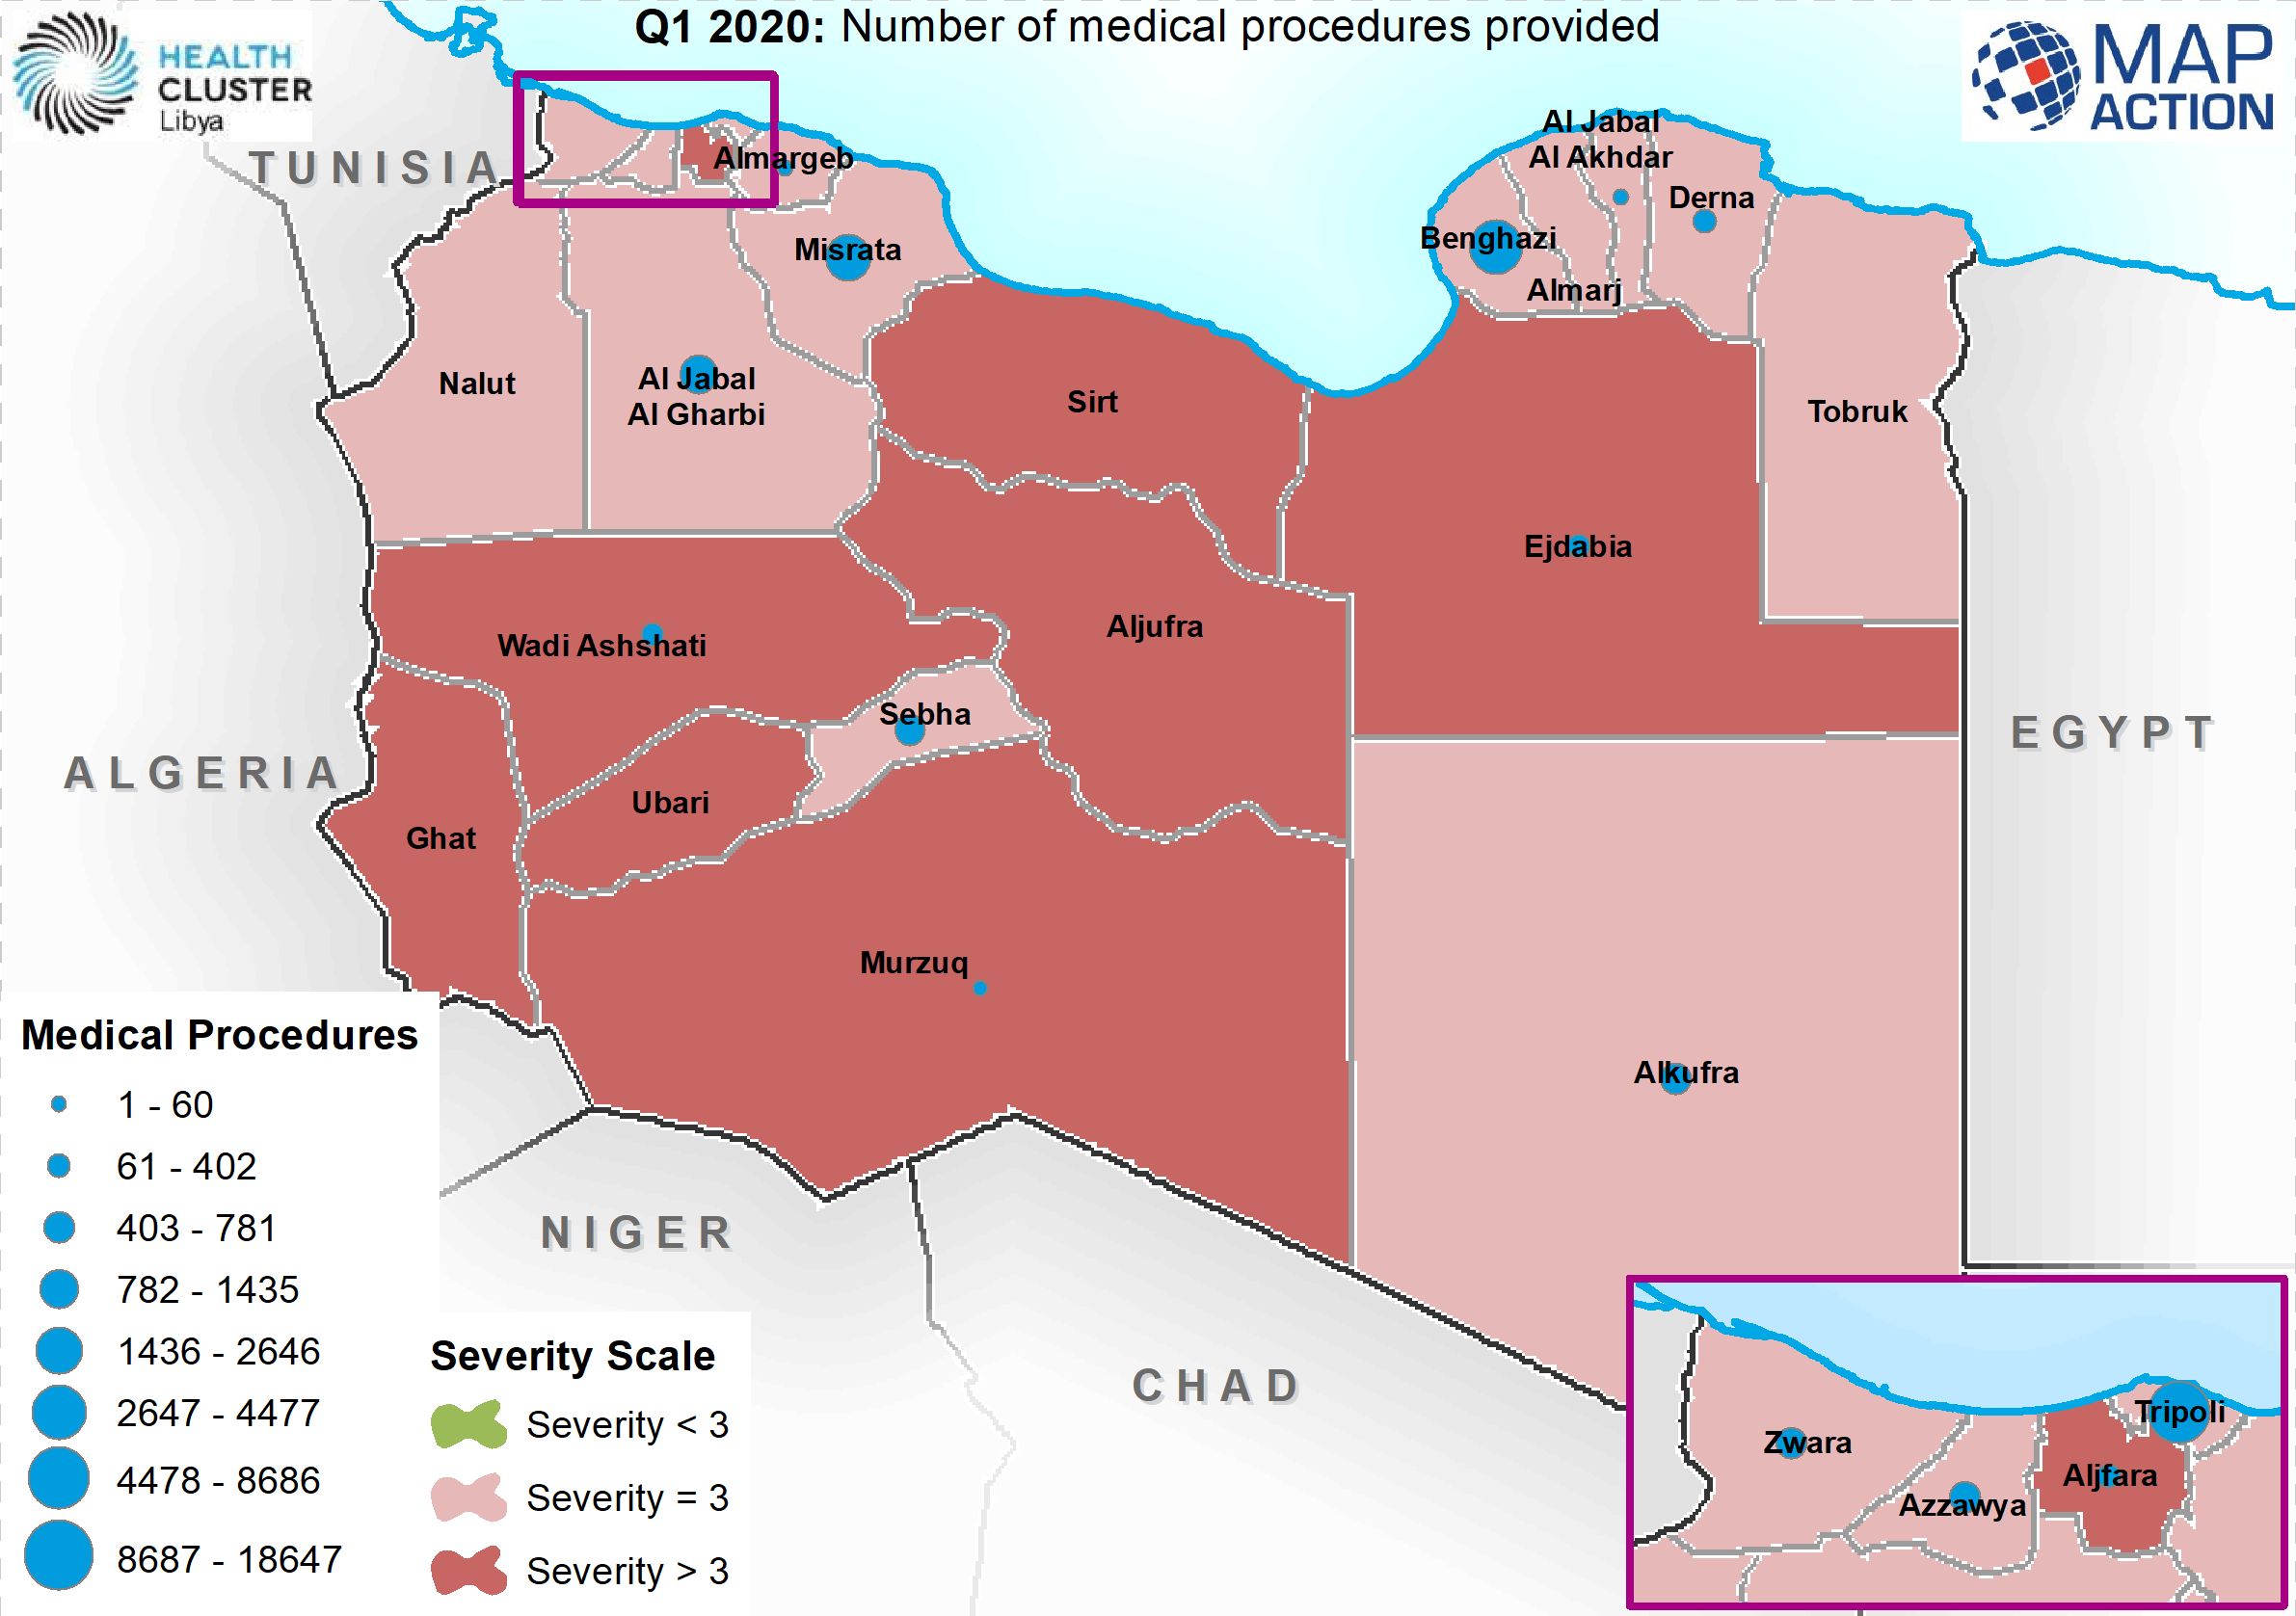
Q1 2020: Number of medical procedures provided
Map shows the composite activities over a three month period (1st quarter) of 2020 -

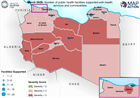
Health sector operational presence (per district), based on Q1 2020
Basic 3www map showing which agencies are working in which Matinka (admin 2) -
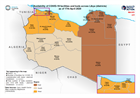
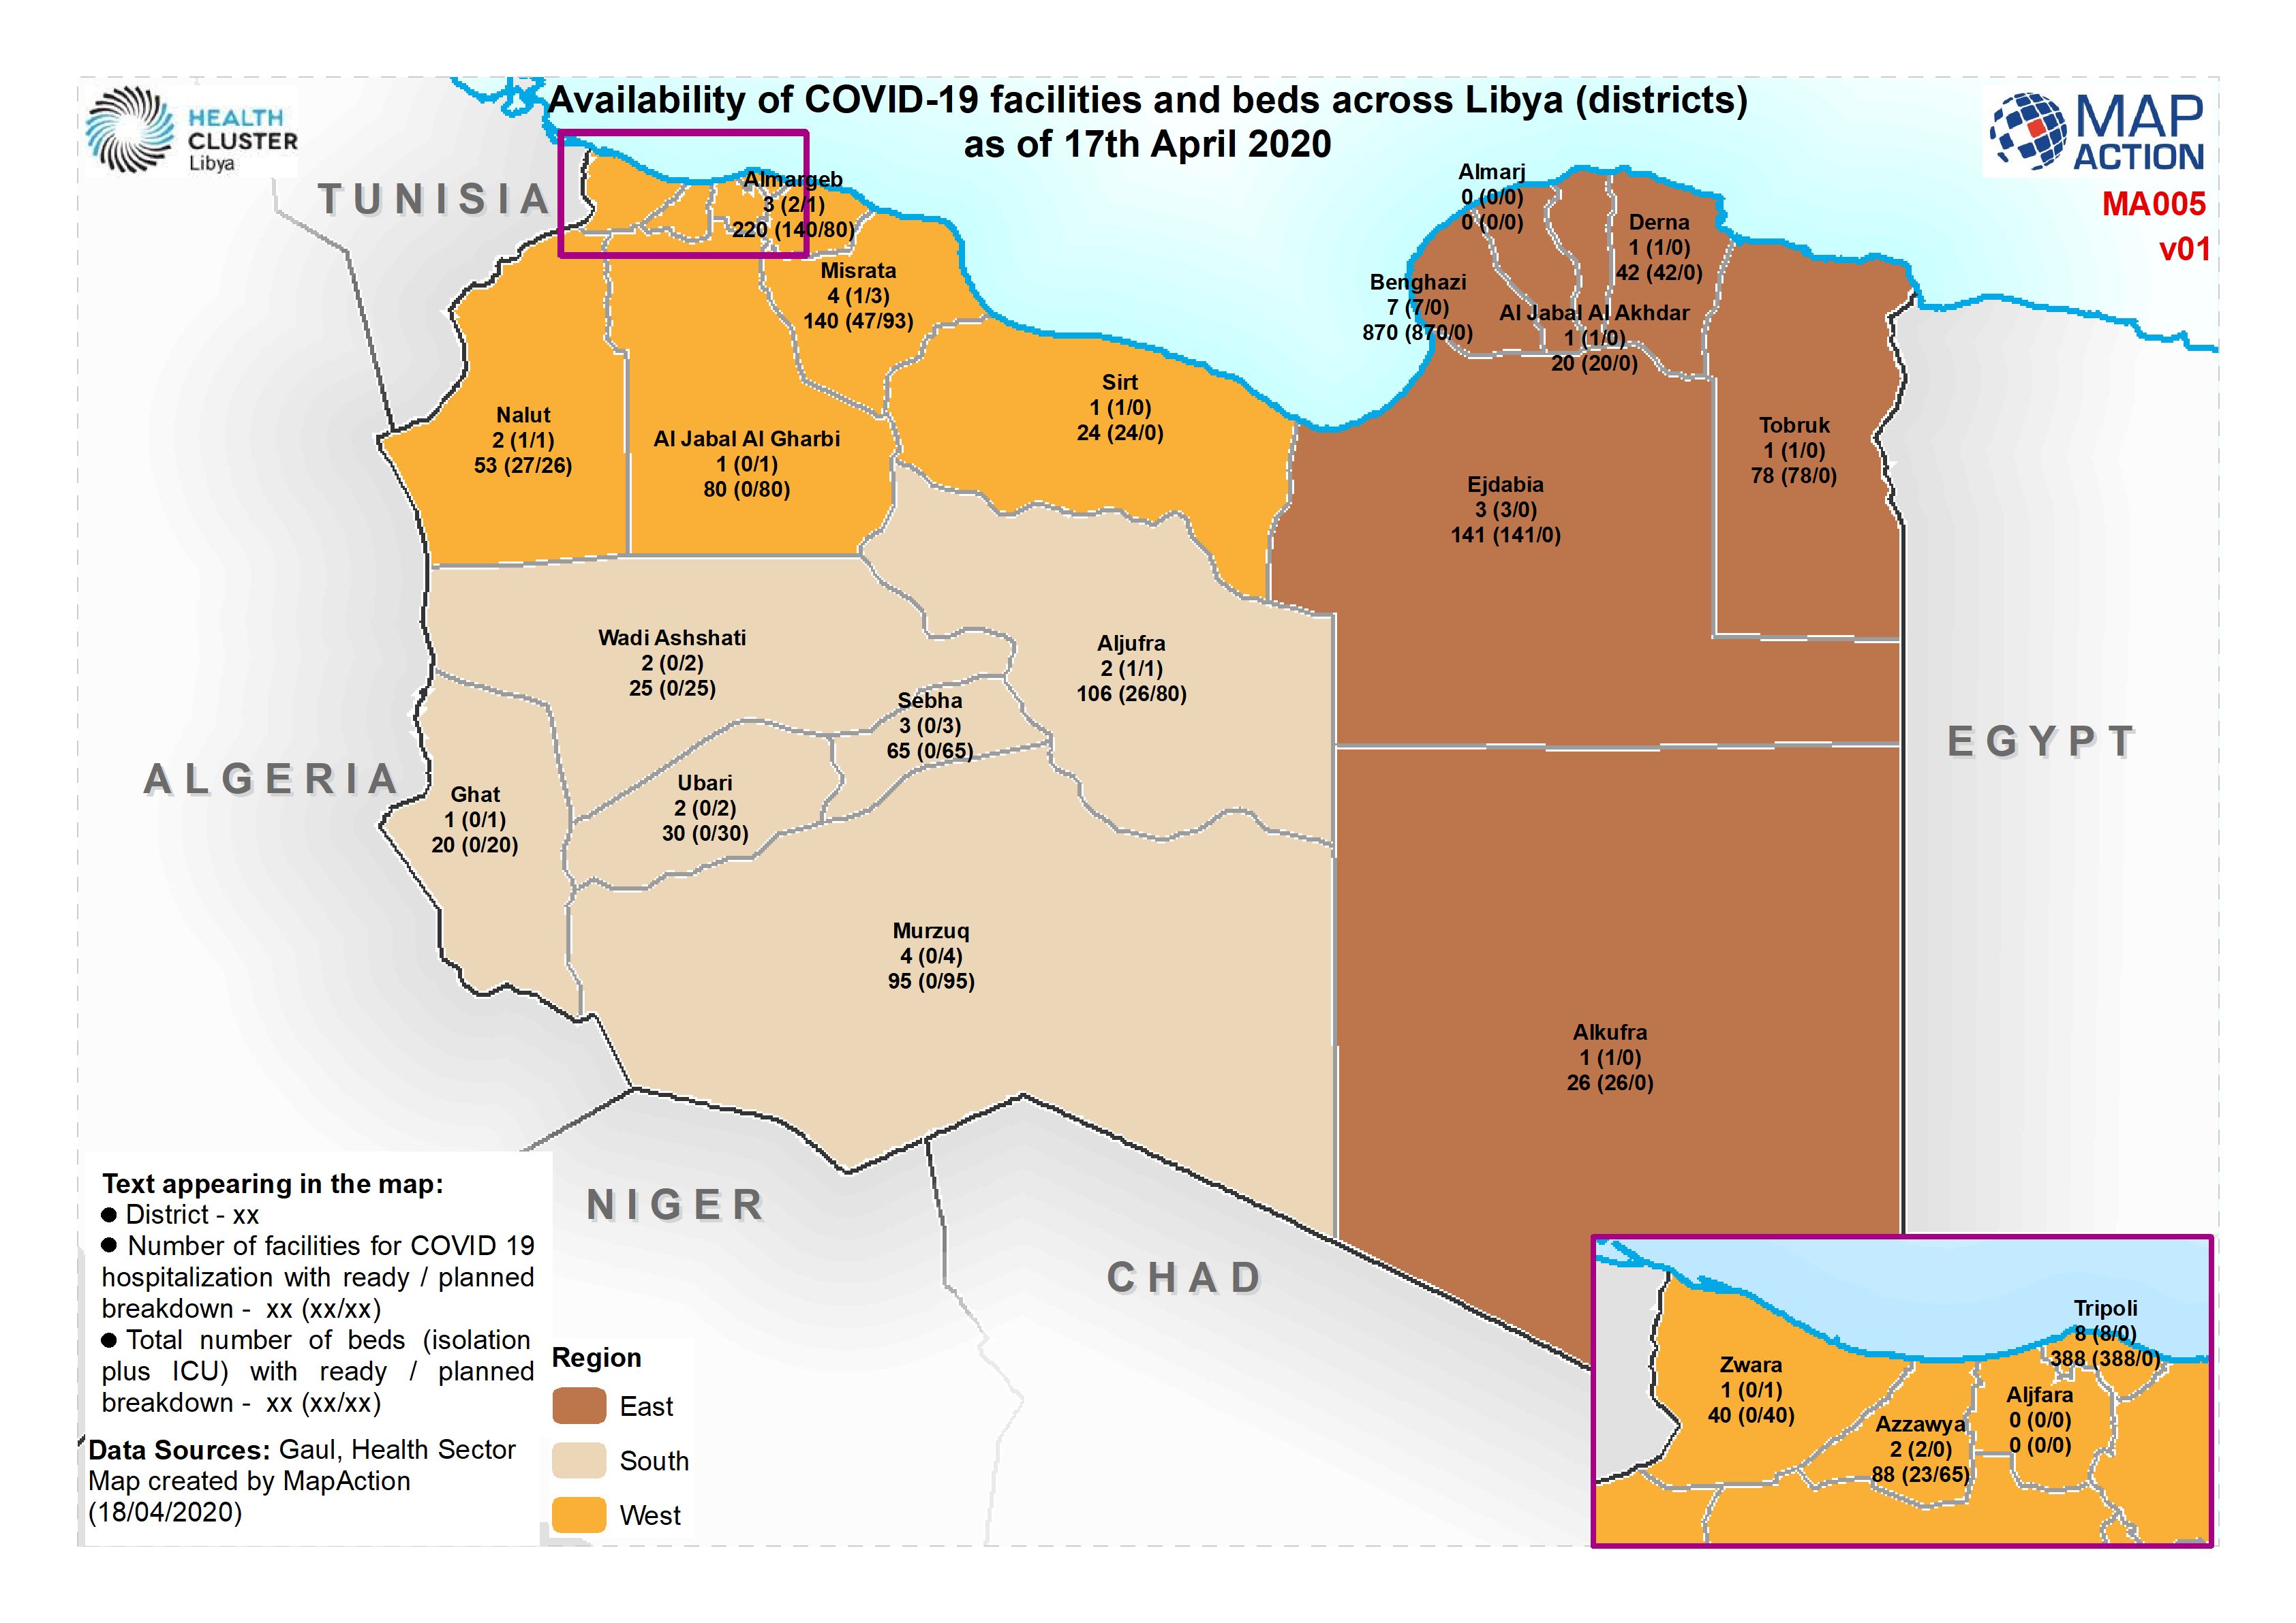
Availability of COVID-19 facilities and beds across Libya (districts) as of 1...
Map shows the underlying health severity scale overlaid with the number of medical procedures carried out / supported by WHO -
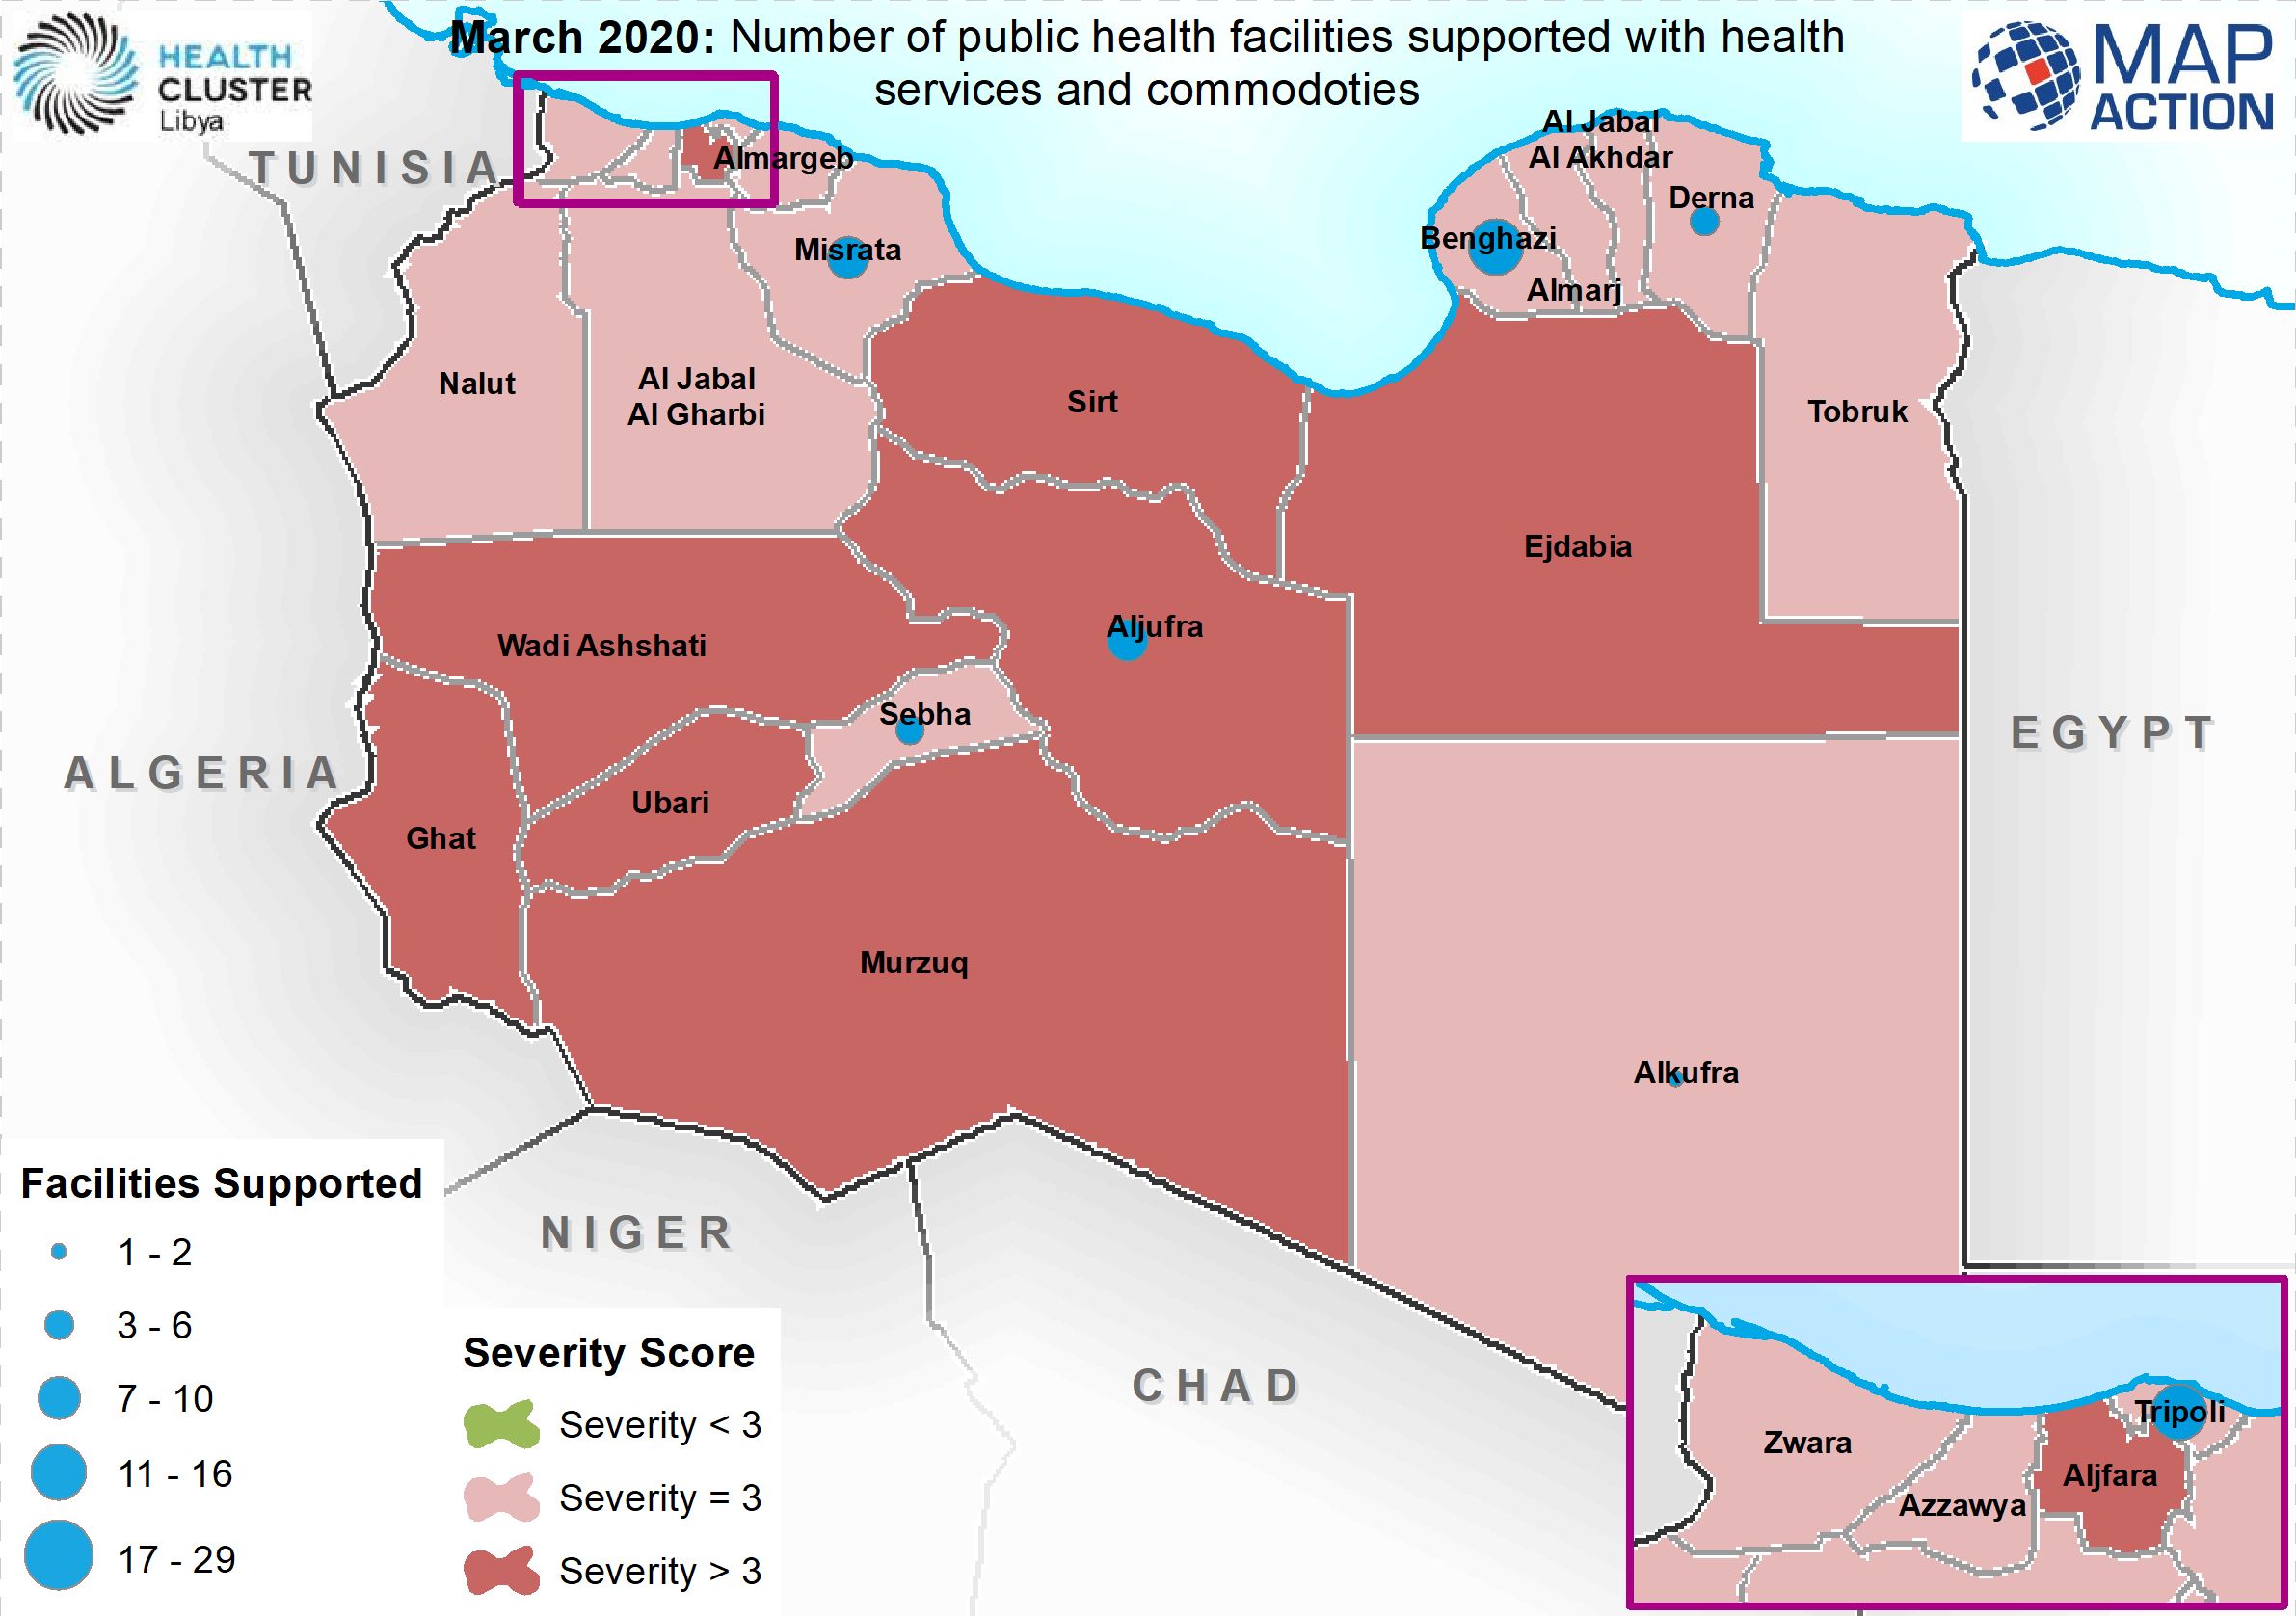
March 2020: Number of public health facilities supported with health services...
Map shows the number of heath facilities supported with health services and commodities for the month of March 2020 -
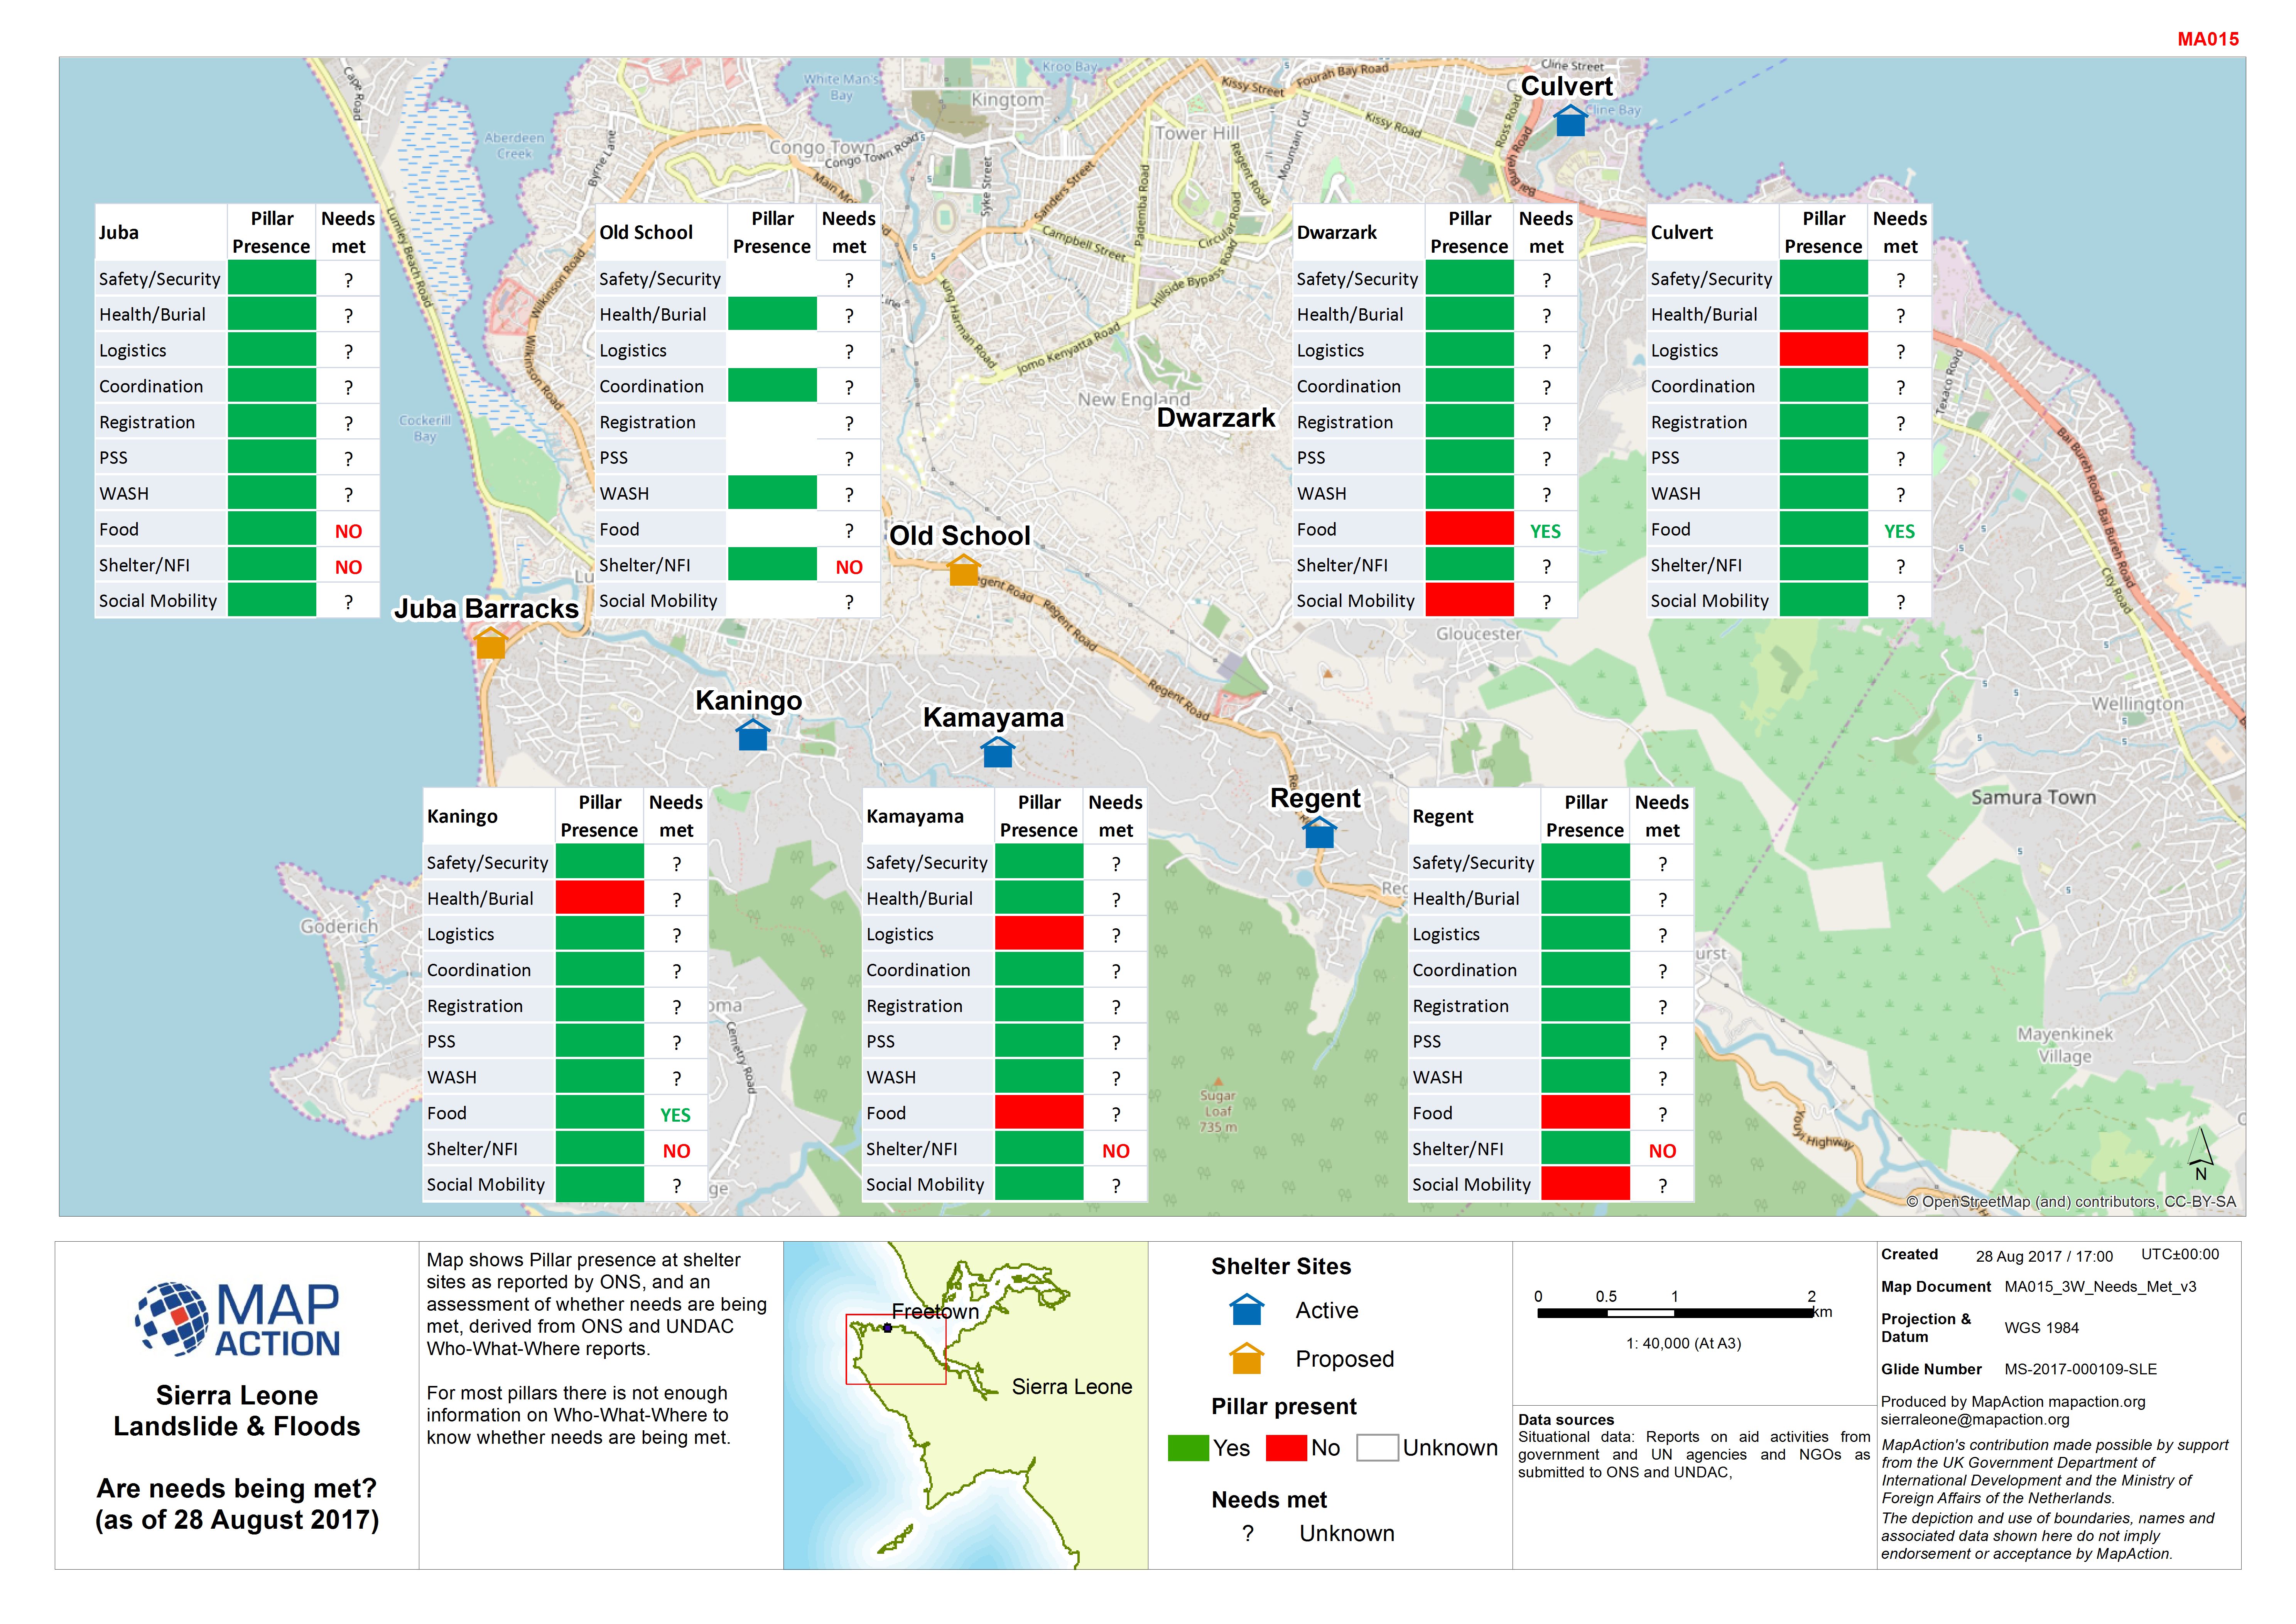
Sierra Leone Landslide & Floods Are needs being met? (as of 28 August 2017)
Map shows Pillar presence at shelter sites as reported by ONS, and an assessment of whether needs are being met, derived from ONS and UNDAC Who-What-Where reports. For most... -
Sierra Leone Landslides & Floods Who-What-Where: agencies reported at operati...
Map shows an overview of service provision as reported by actors, shown in the ONS incident reports dated 24th, 25th and 28th August 2017 or in the UNDAC 4W online survey...
