-

Beirut port explosion operational zones (West)
These zones were developed to help coordinate and collaborate on relief efforts at the operational level. Level 3 Administrative boundaries in Lebanon ‘Cadasters’ were divided... -

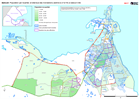
USAR Team Reference Map with Base of Operation (BoO) Locations
This dataset has no description
-

Beirut Total Population by Cadasters (March 2020)
Map shows Beirut total population by Cadasters (March 2020) -

-
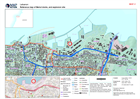
Reference map of Beirut docks, and explosion site
Reference map of Beirut docks, and explosion site -

-
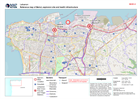
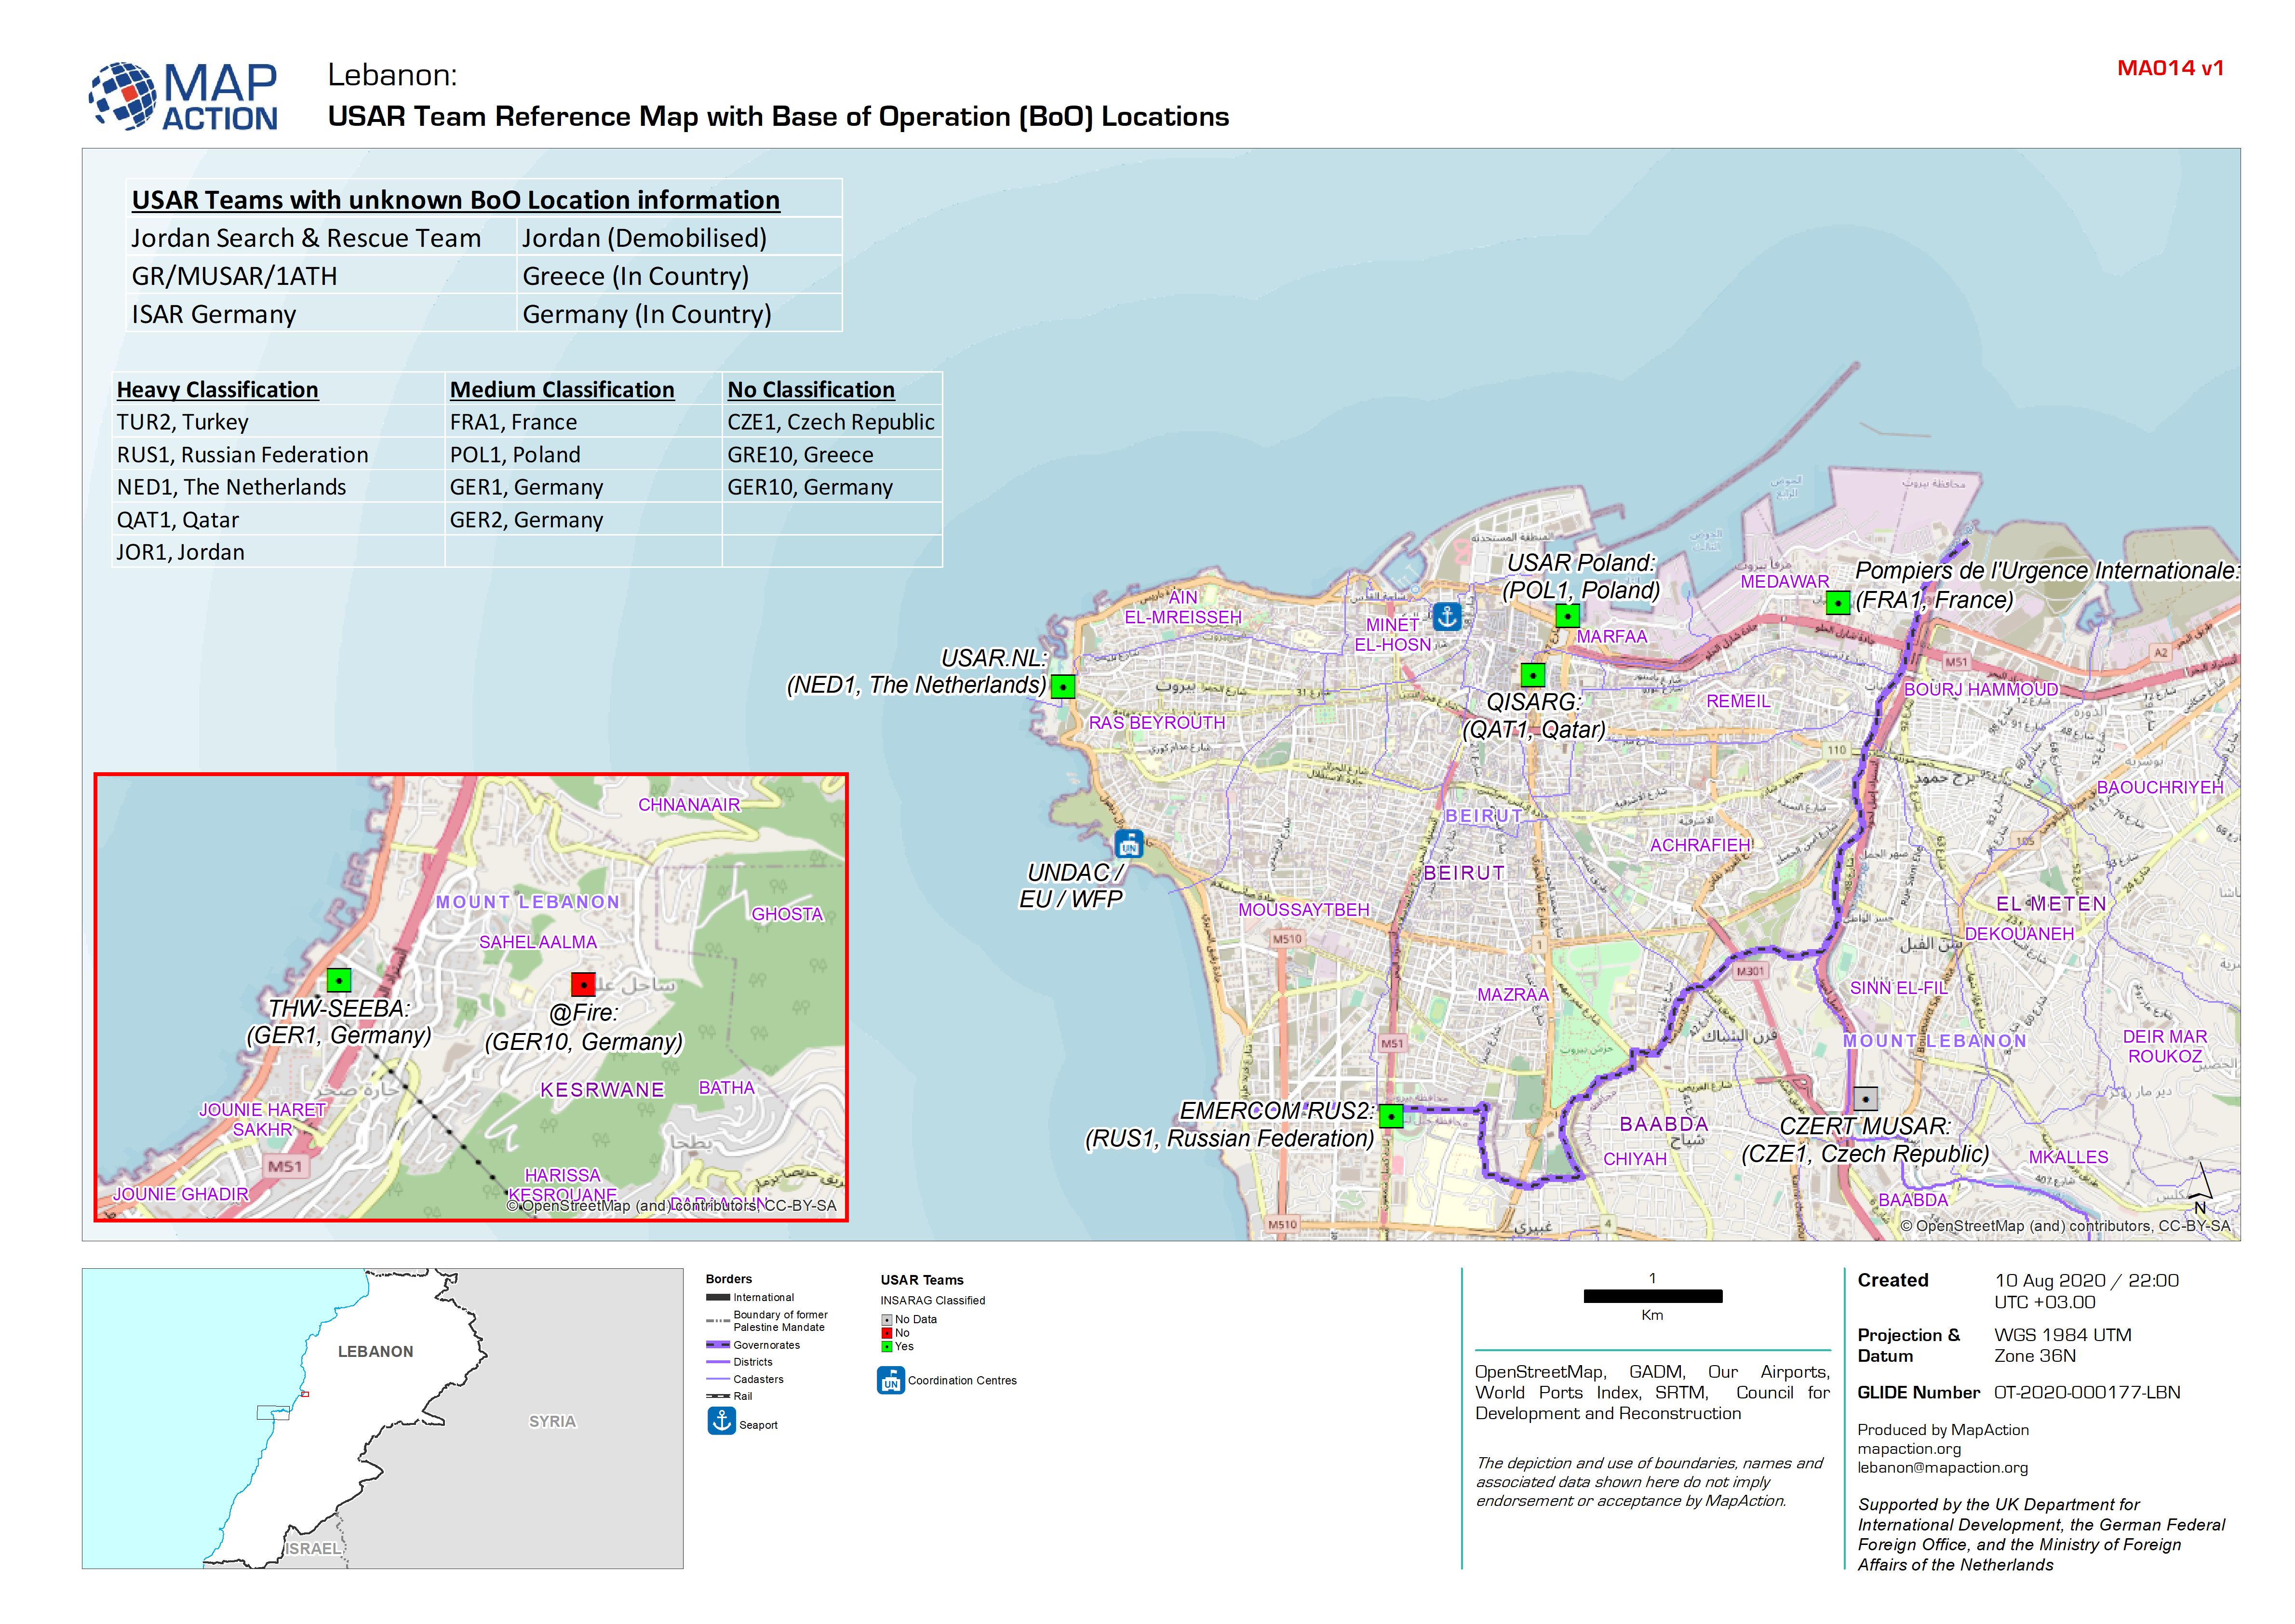
Reference map of Beirut, explosion site and health infrastructure
Reference map of Beirut, explosion site and health infrastructure -
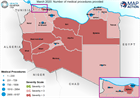
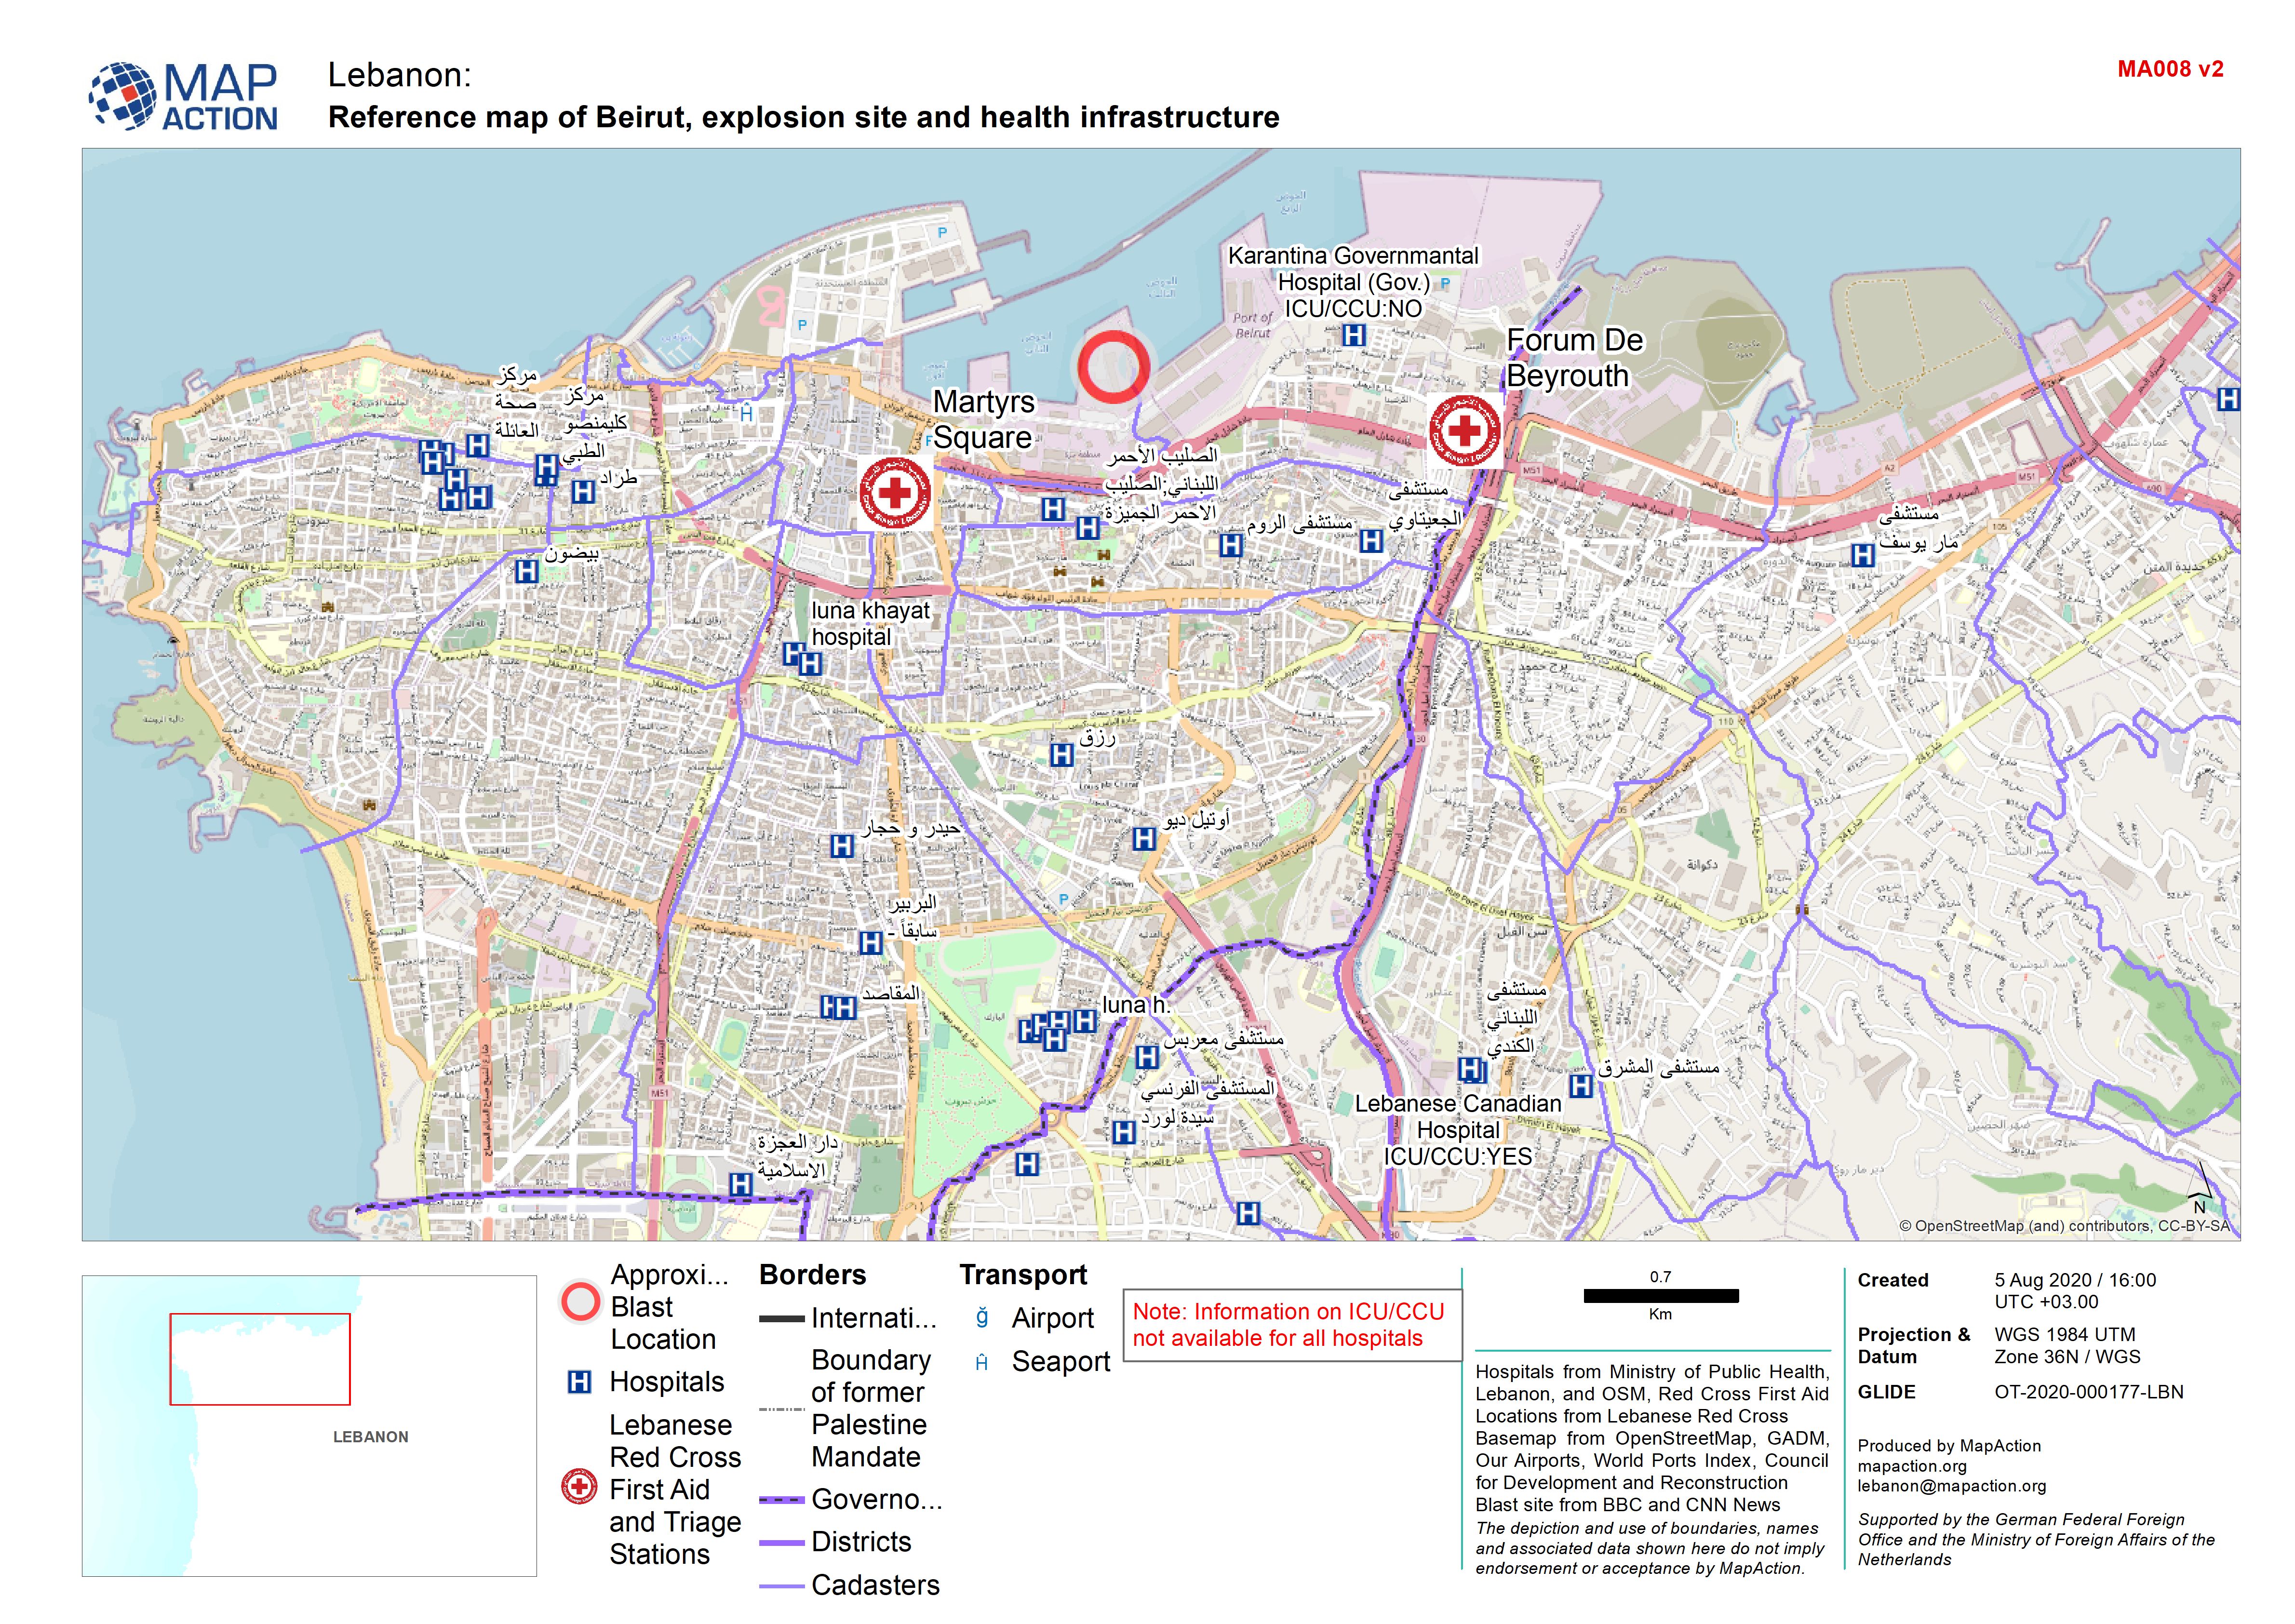
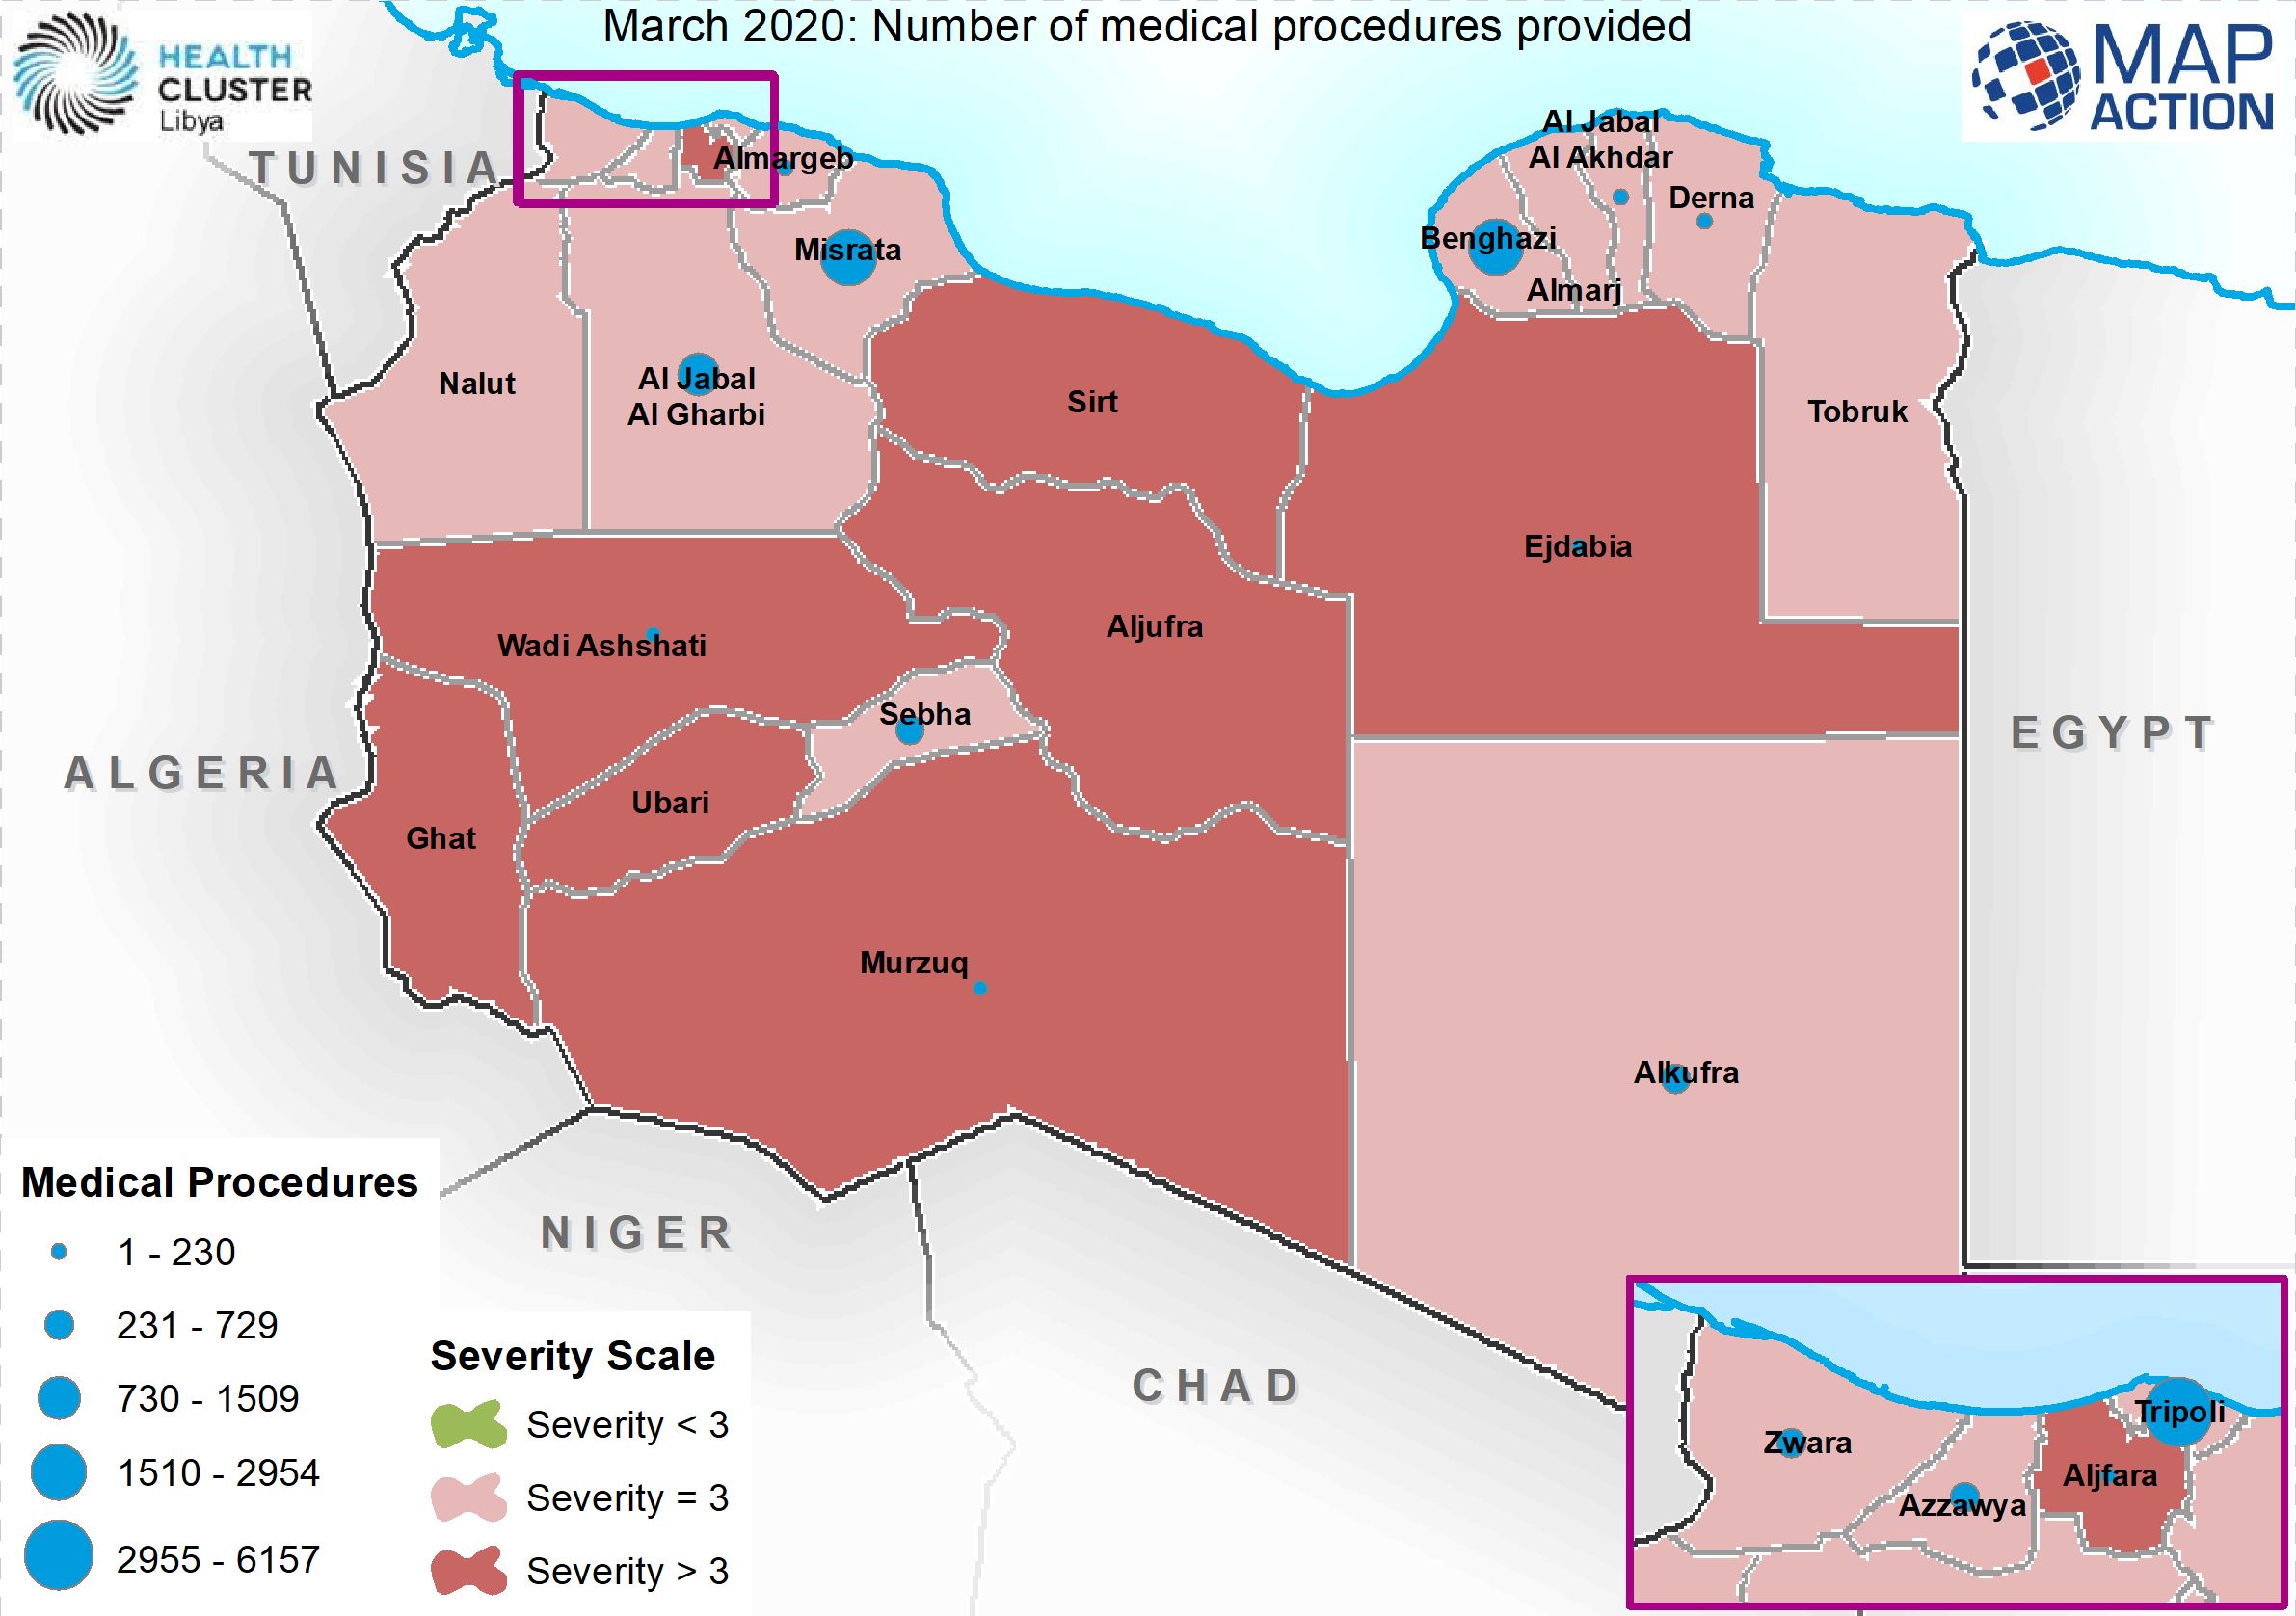
March 2020: Number of medical procedures provided
This map shows the number of medical facilities supported by WHO during the month of March 2020 -

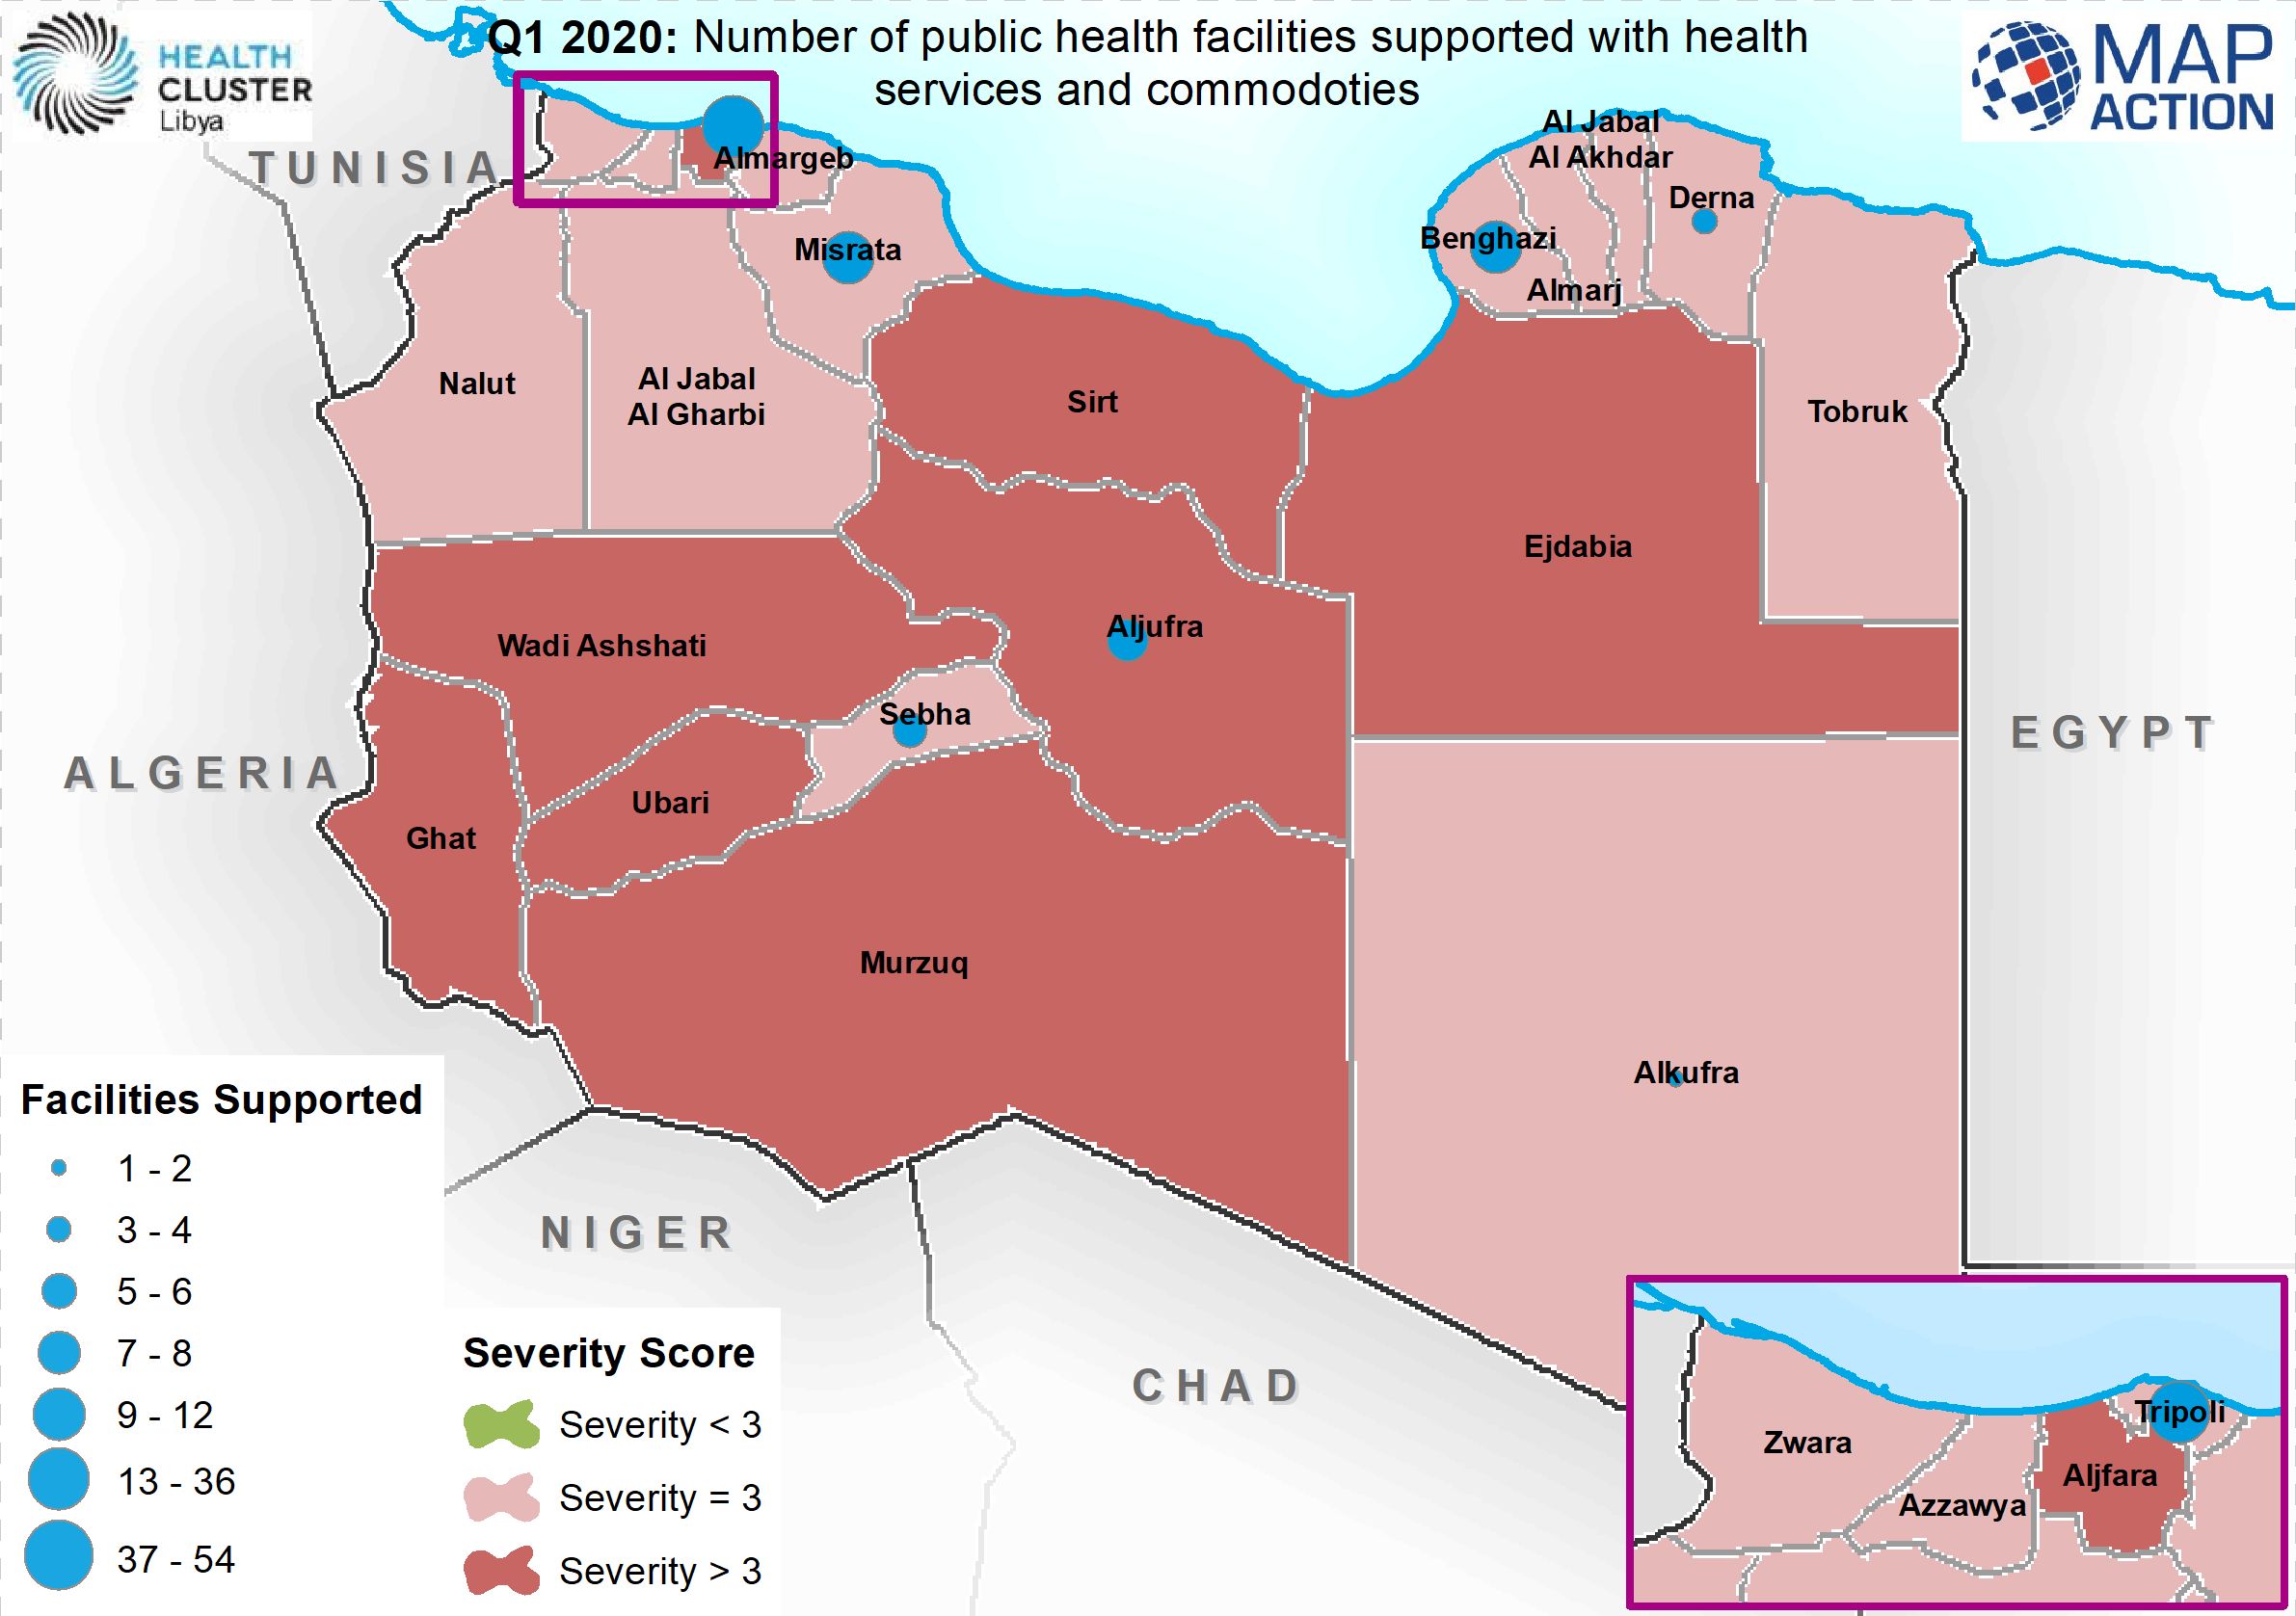
Q1 2020: Number of public health facilities supported with health services an...
Map shows the number o public health facilities supported in the first 3 months of 2020 -

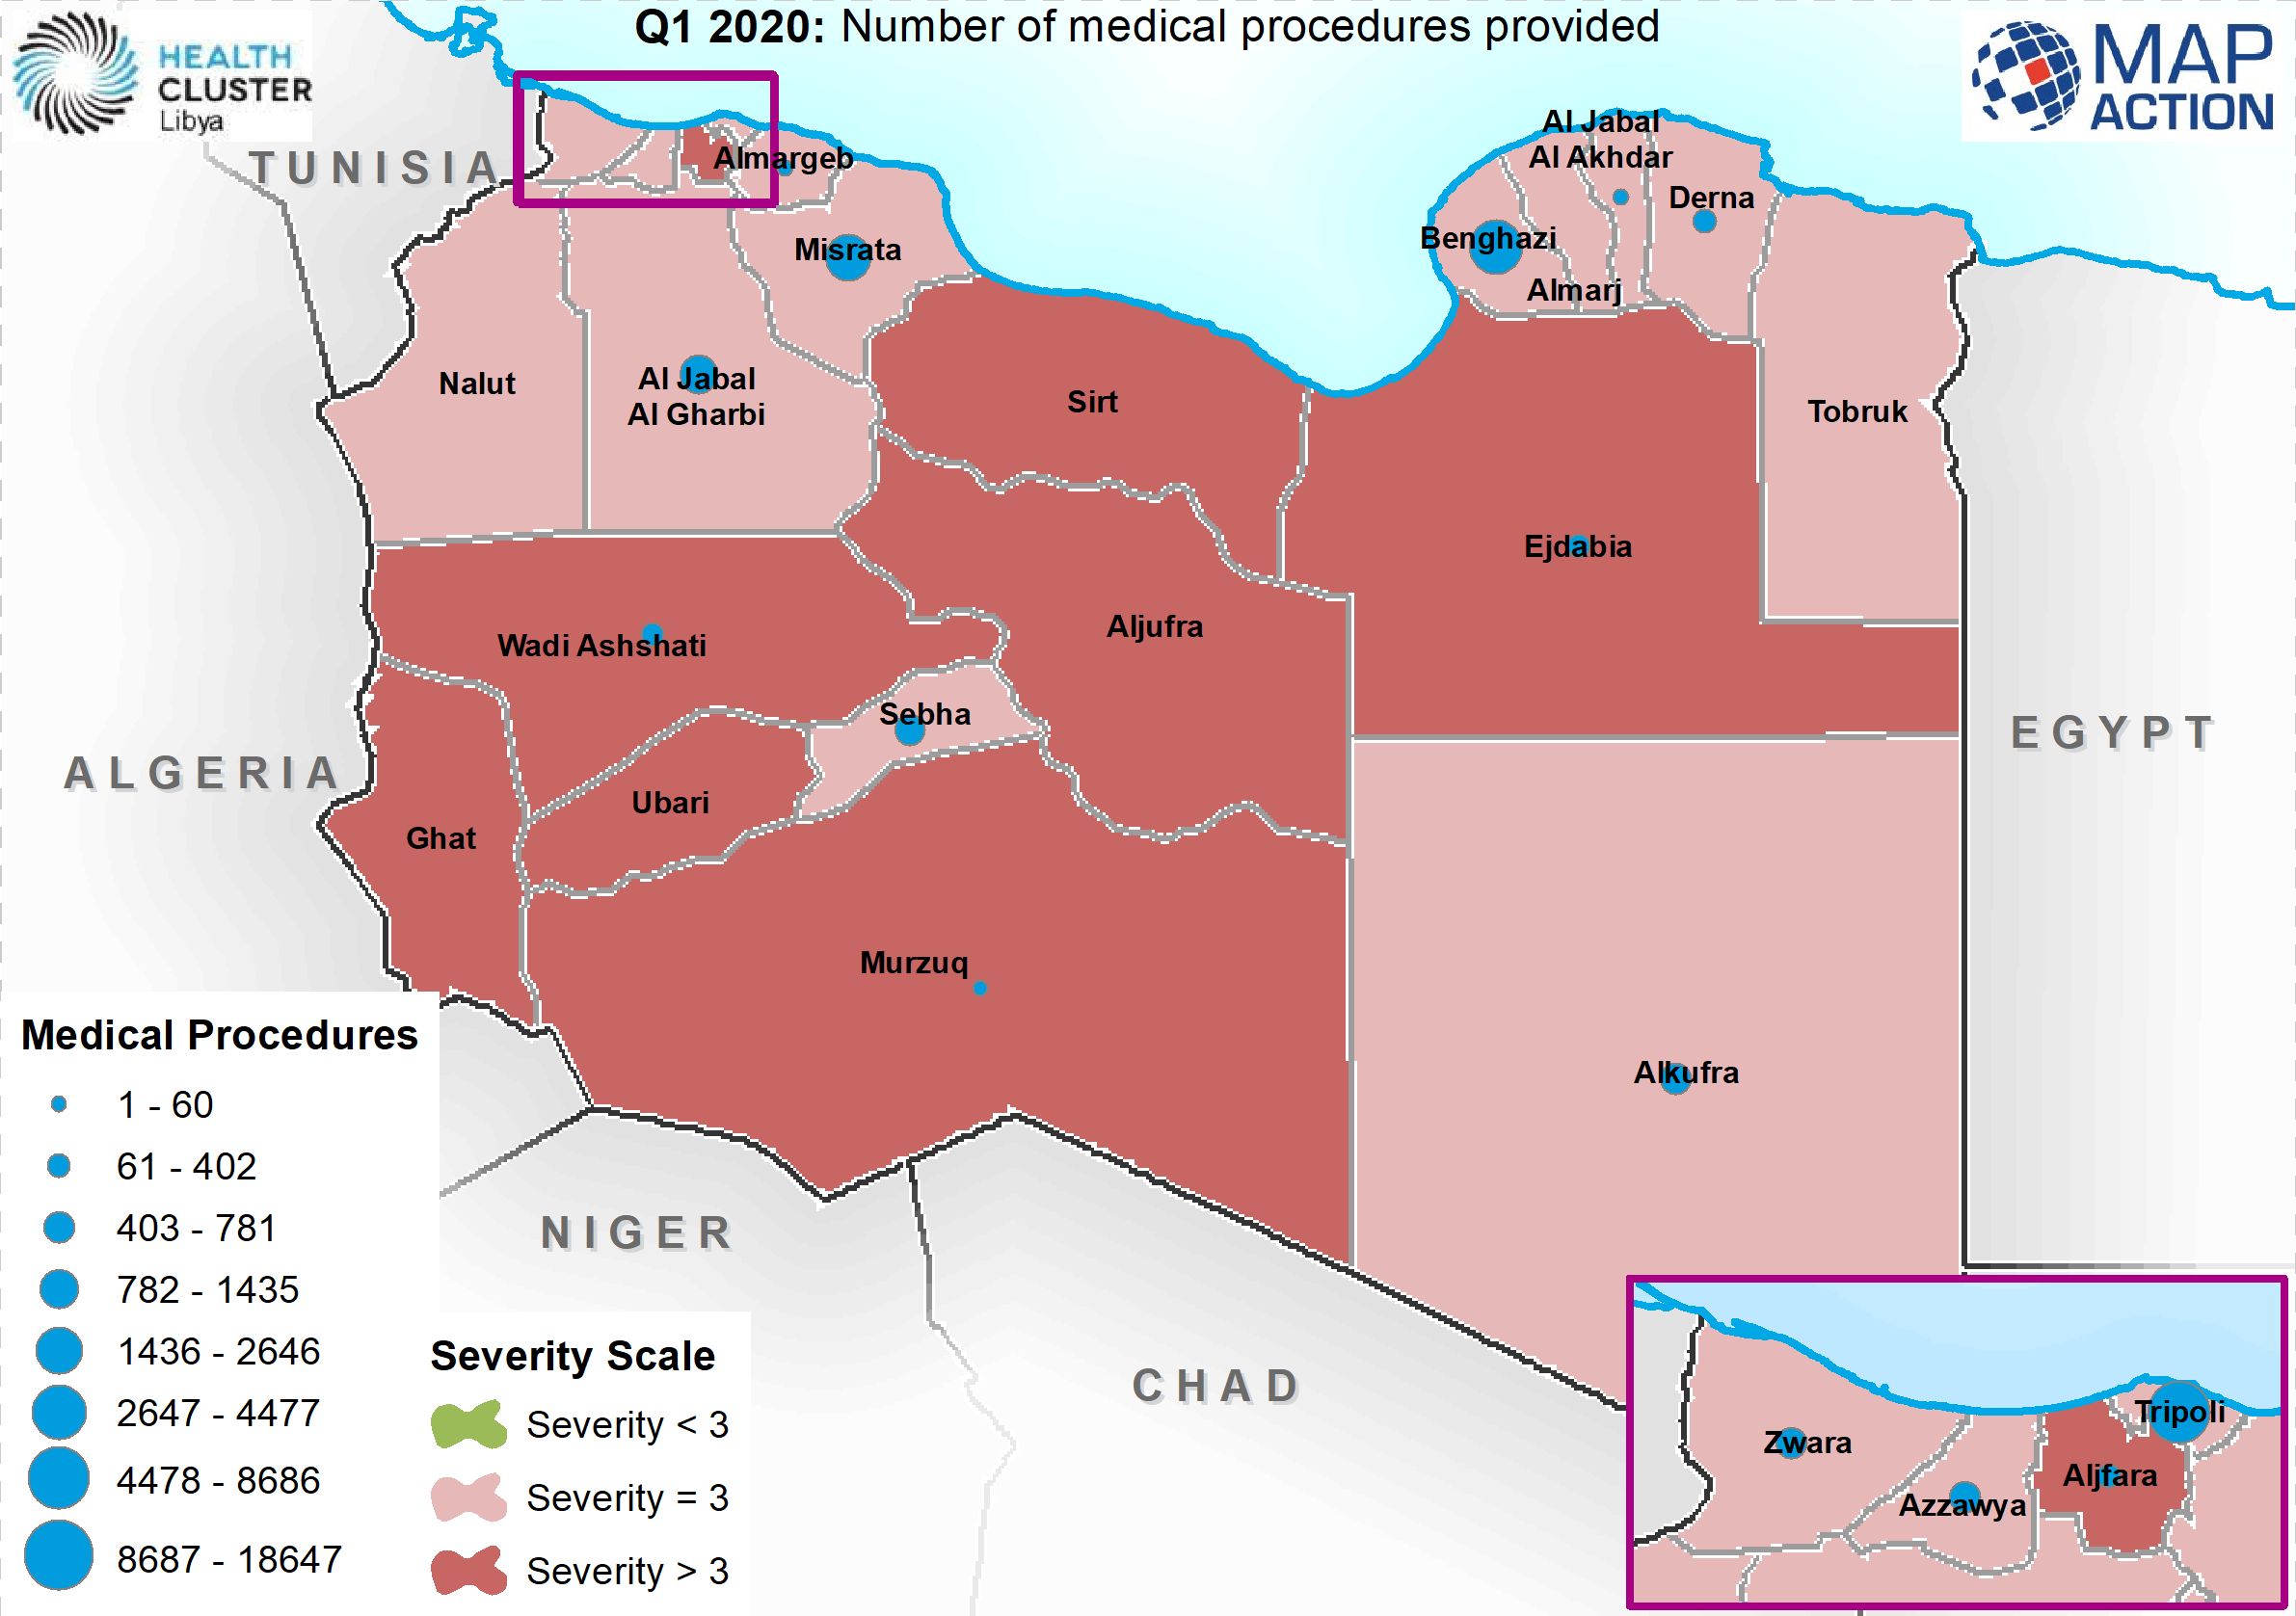
Q1 2020: Number of medical procedures provided
Map shows the composite activities over a three month period (1st quarter) of 2020 -

Health sector operational presence (per district), based on Q1 2020
Basic 3www map showing which agencies are working in which Matinka (admin 2) -
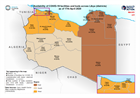
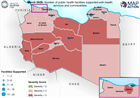
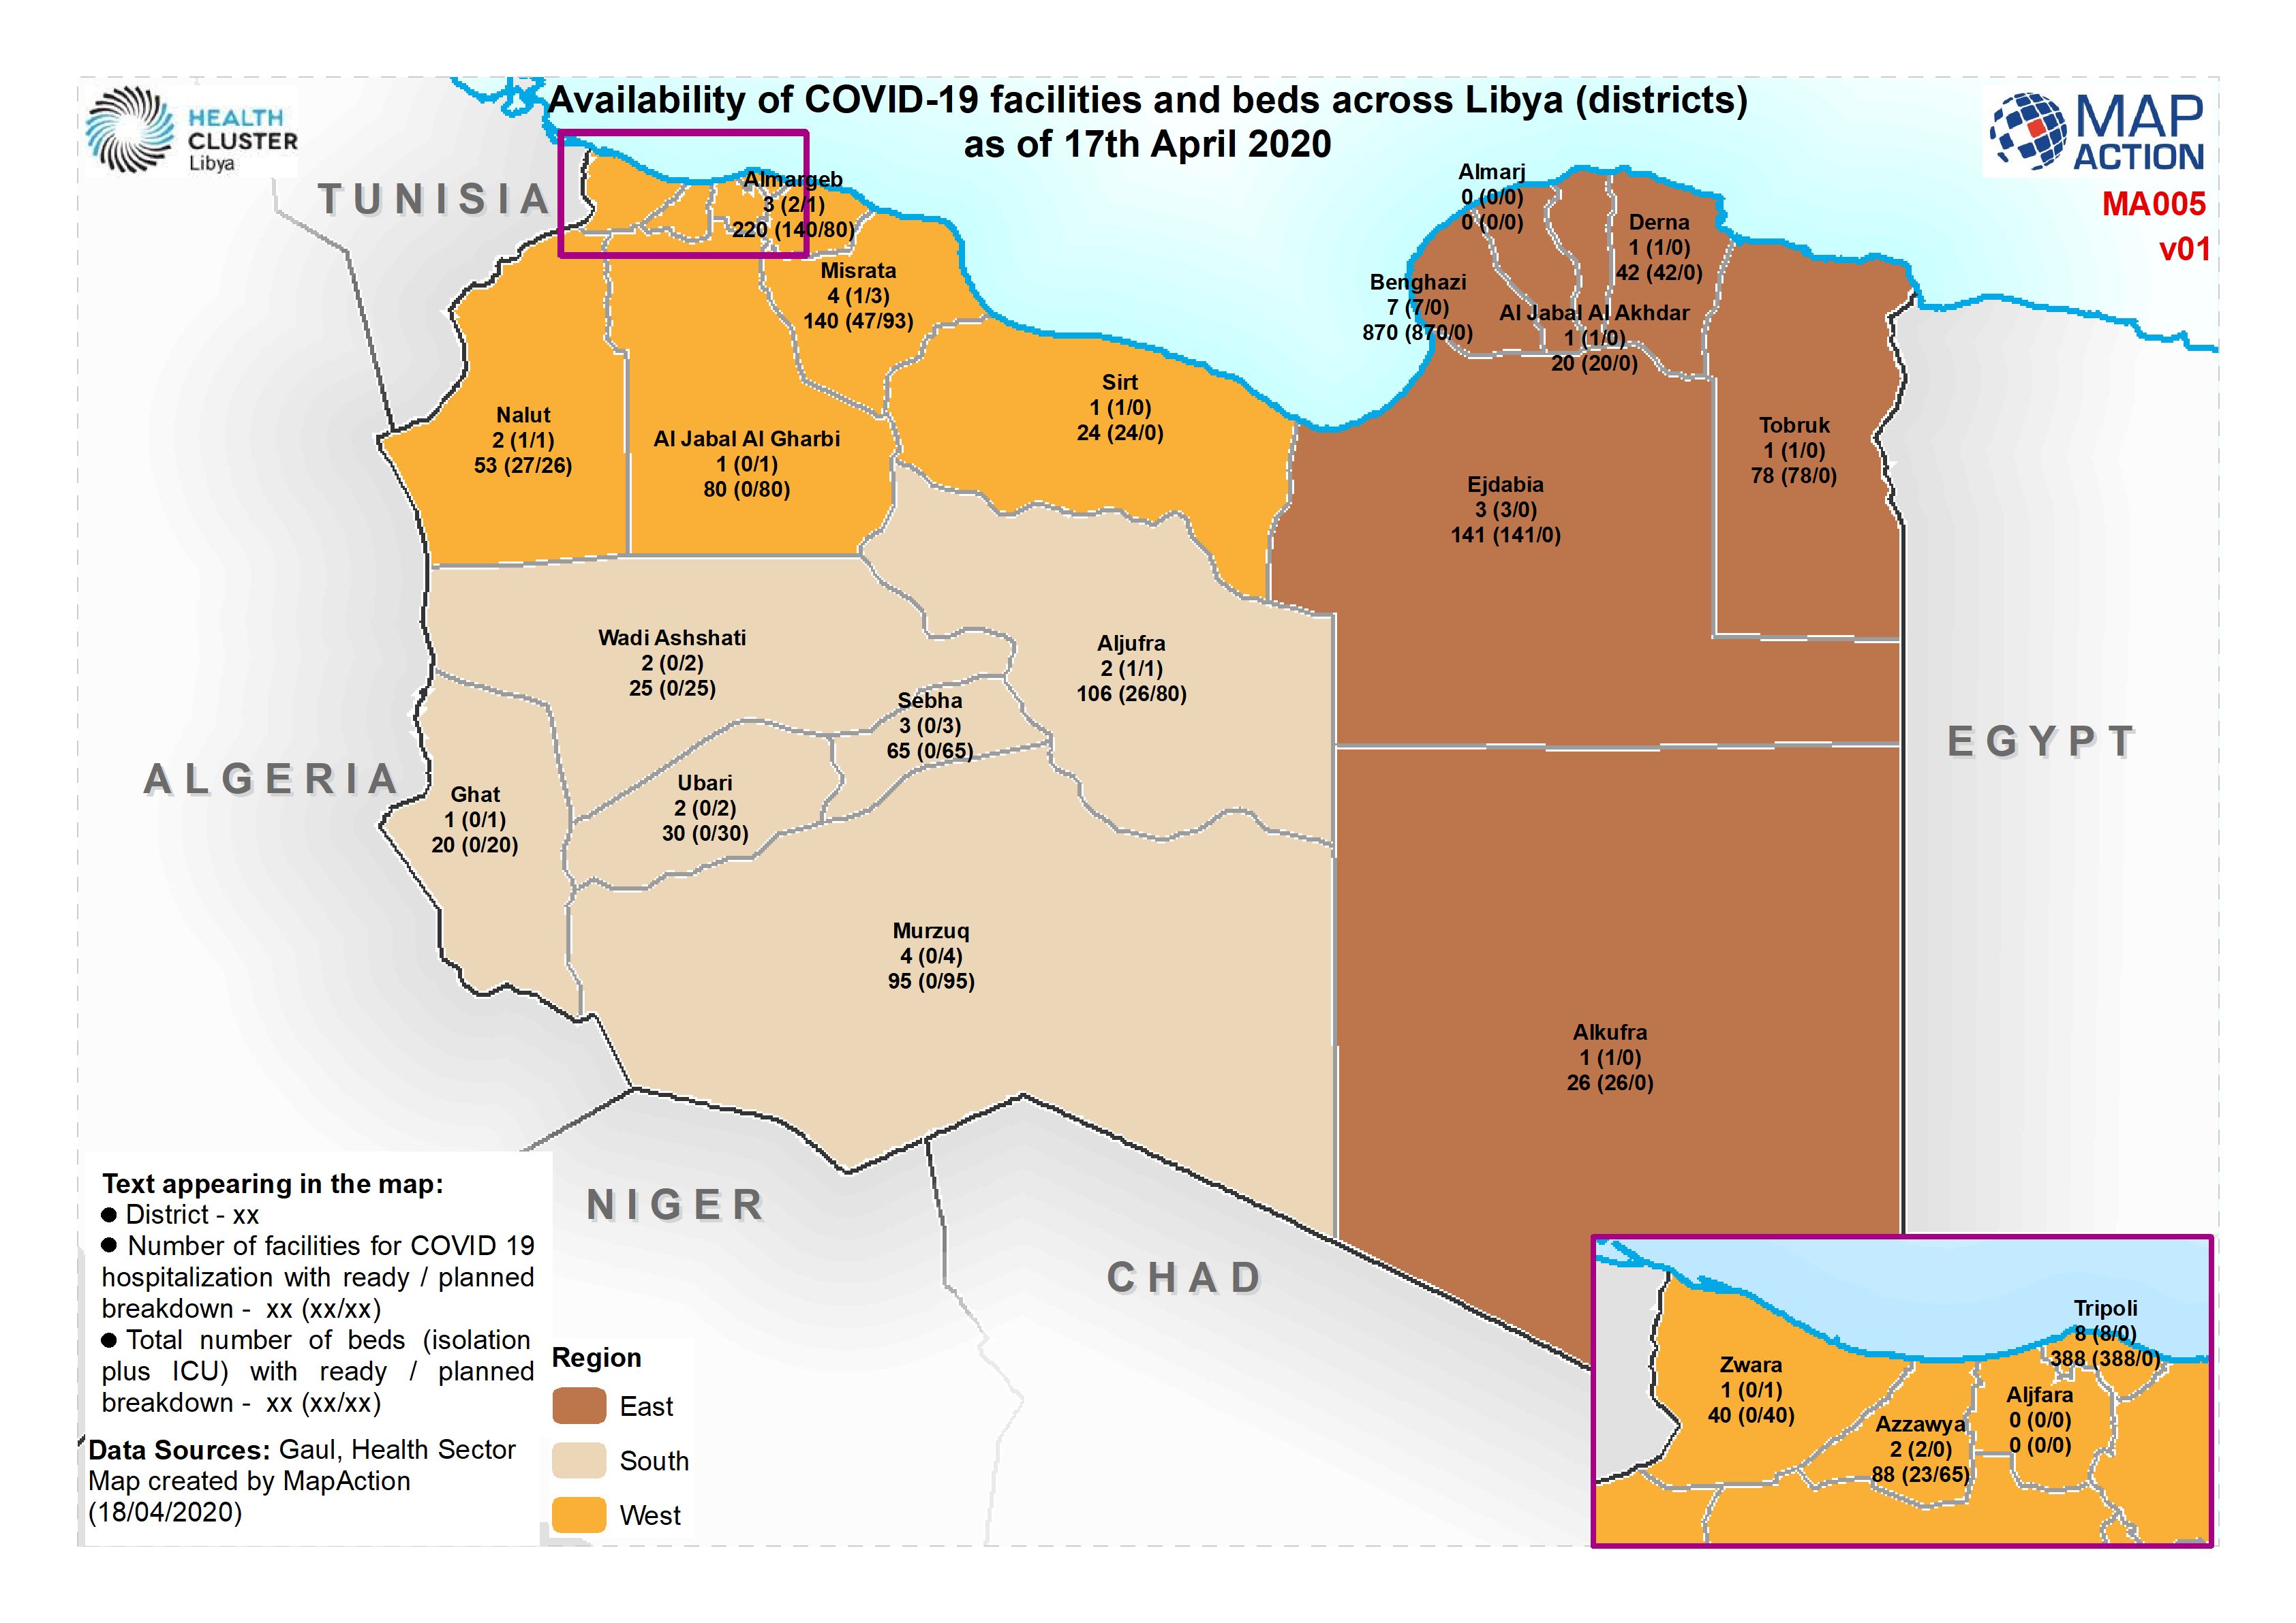
Availability of COVID-19 facilities and beds across Libya (districts) as of 1...
Map shows the underlying health severity scale overlaid with the number of medical procedures carried out / supported by WHO -
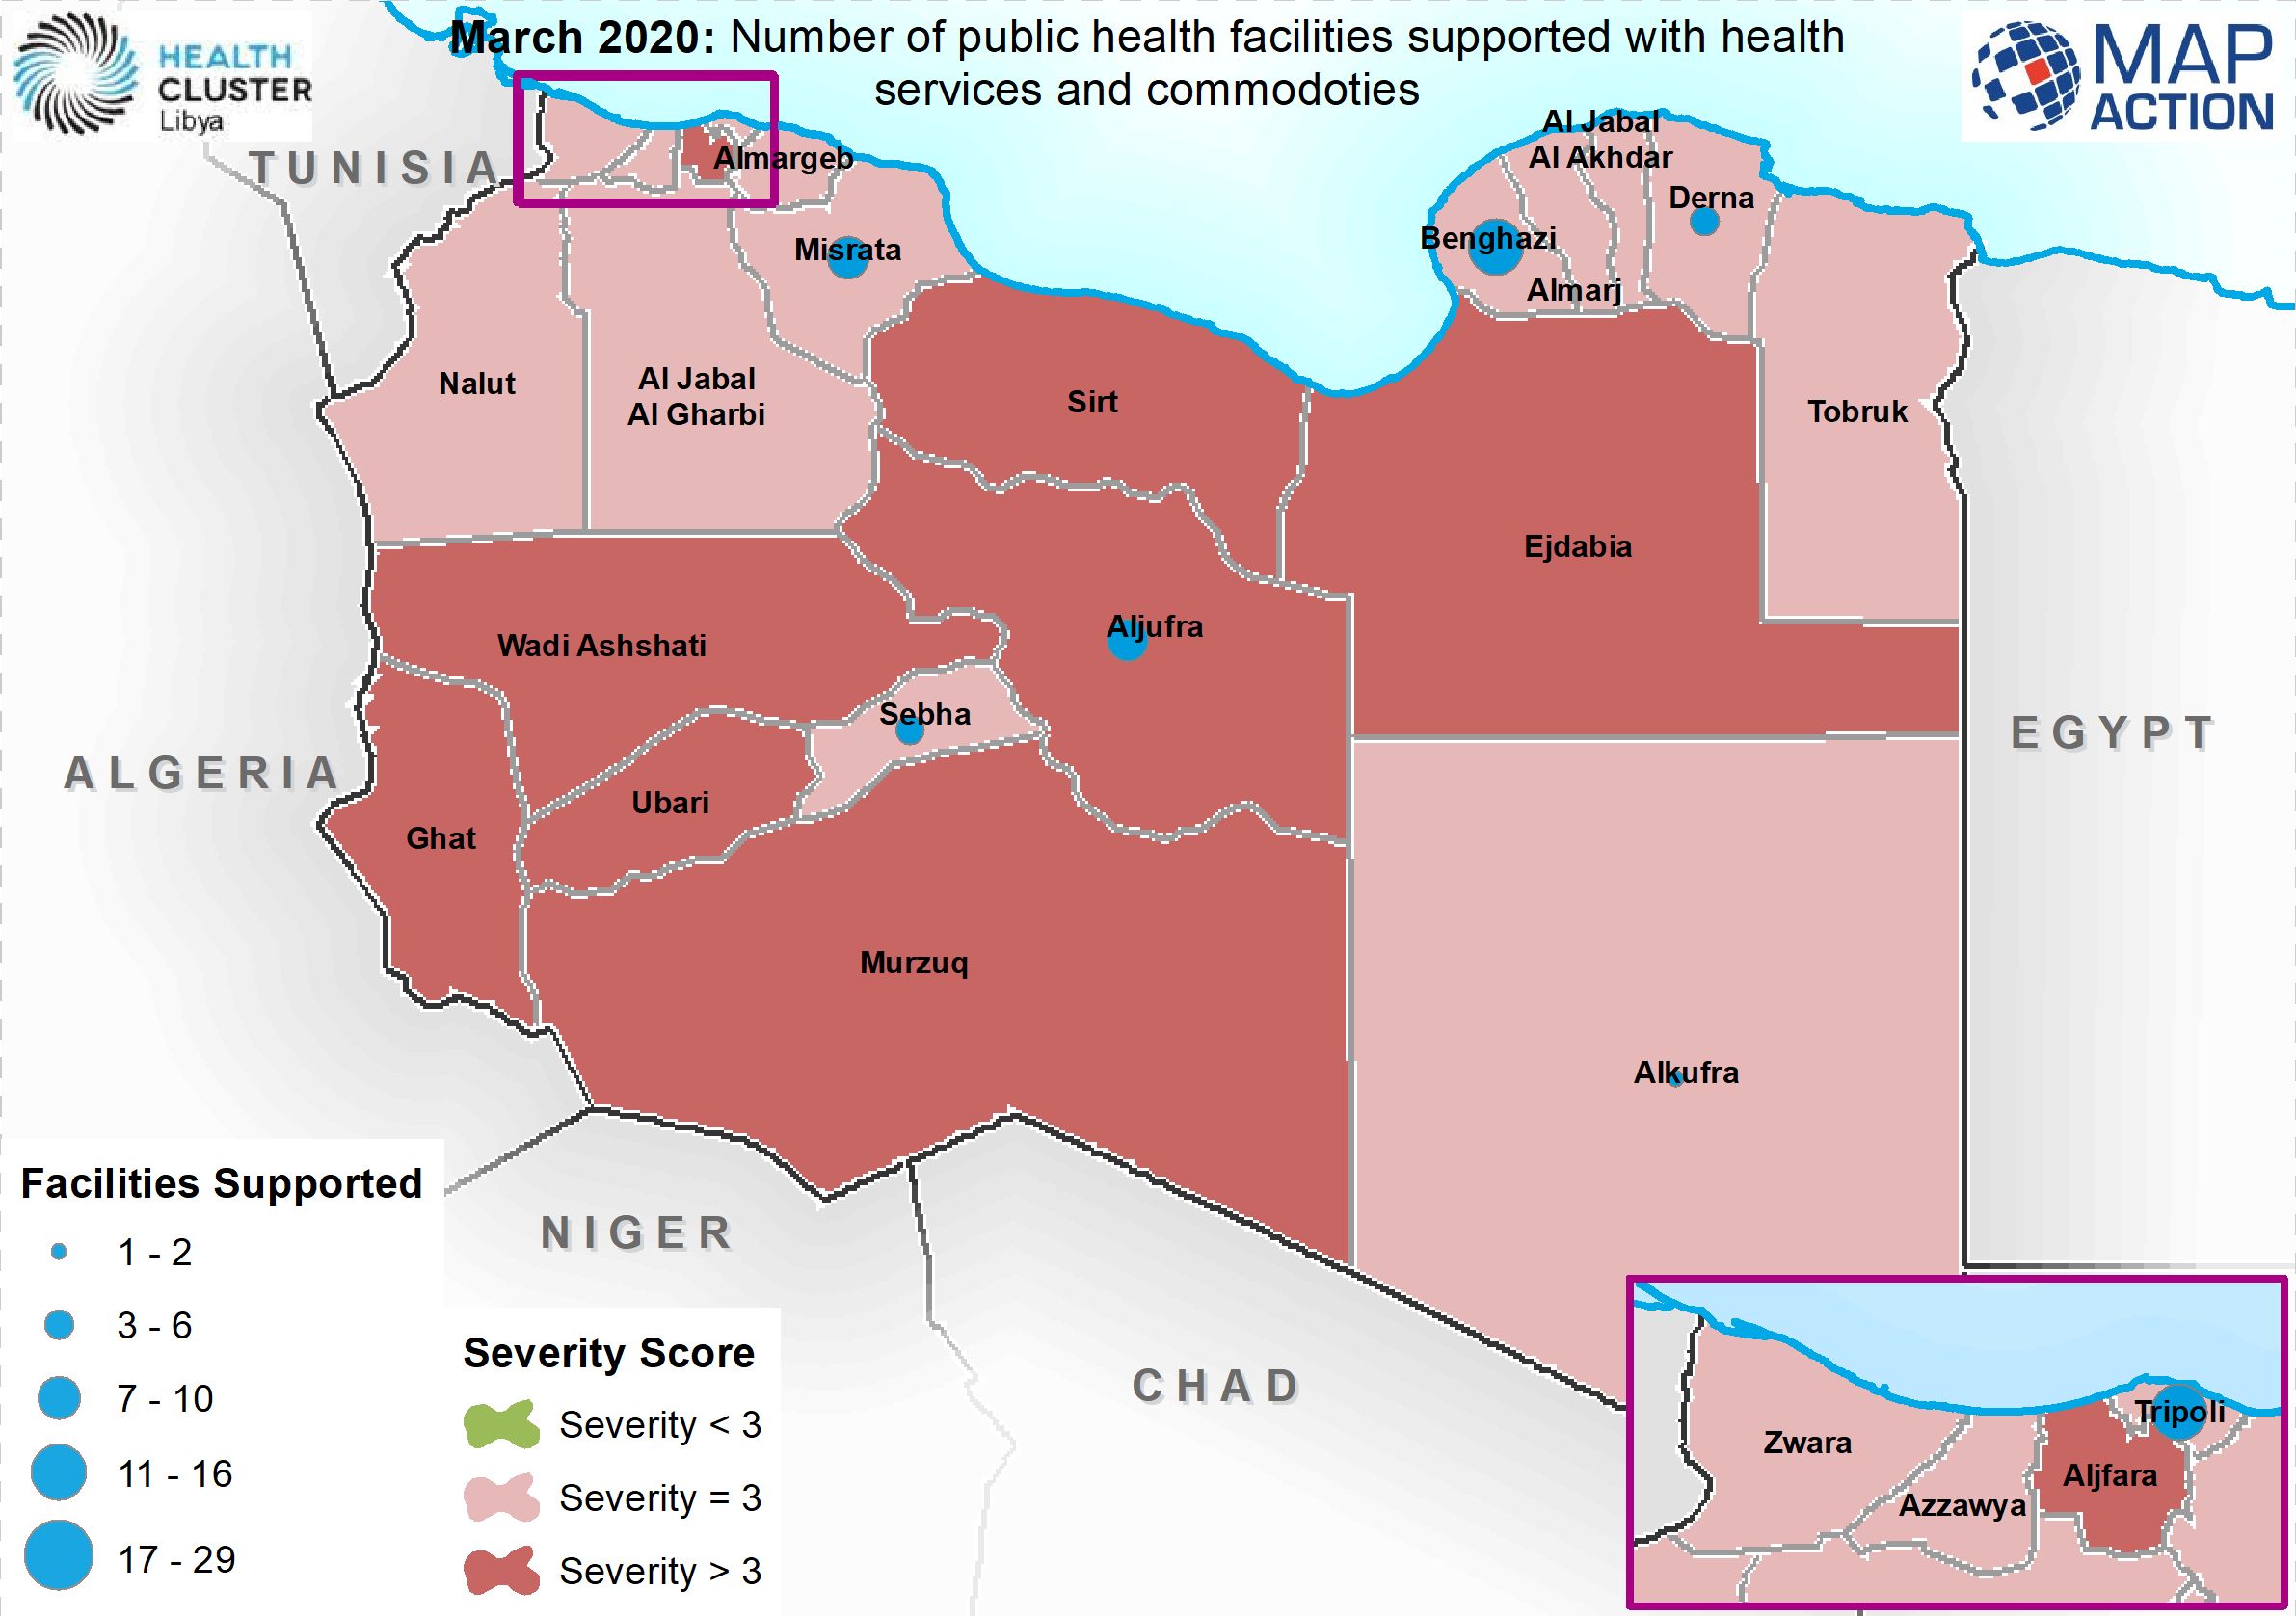
March 2020: Number of public health facilities supported with health services...
Map shows the number of heath facilities supported with health services and commodities for the month of March 2020 -
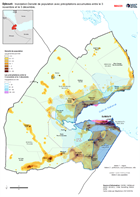
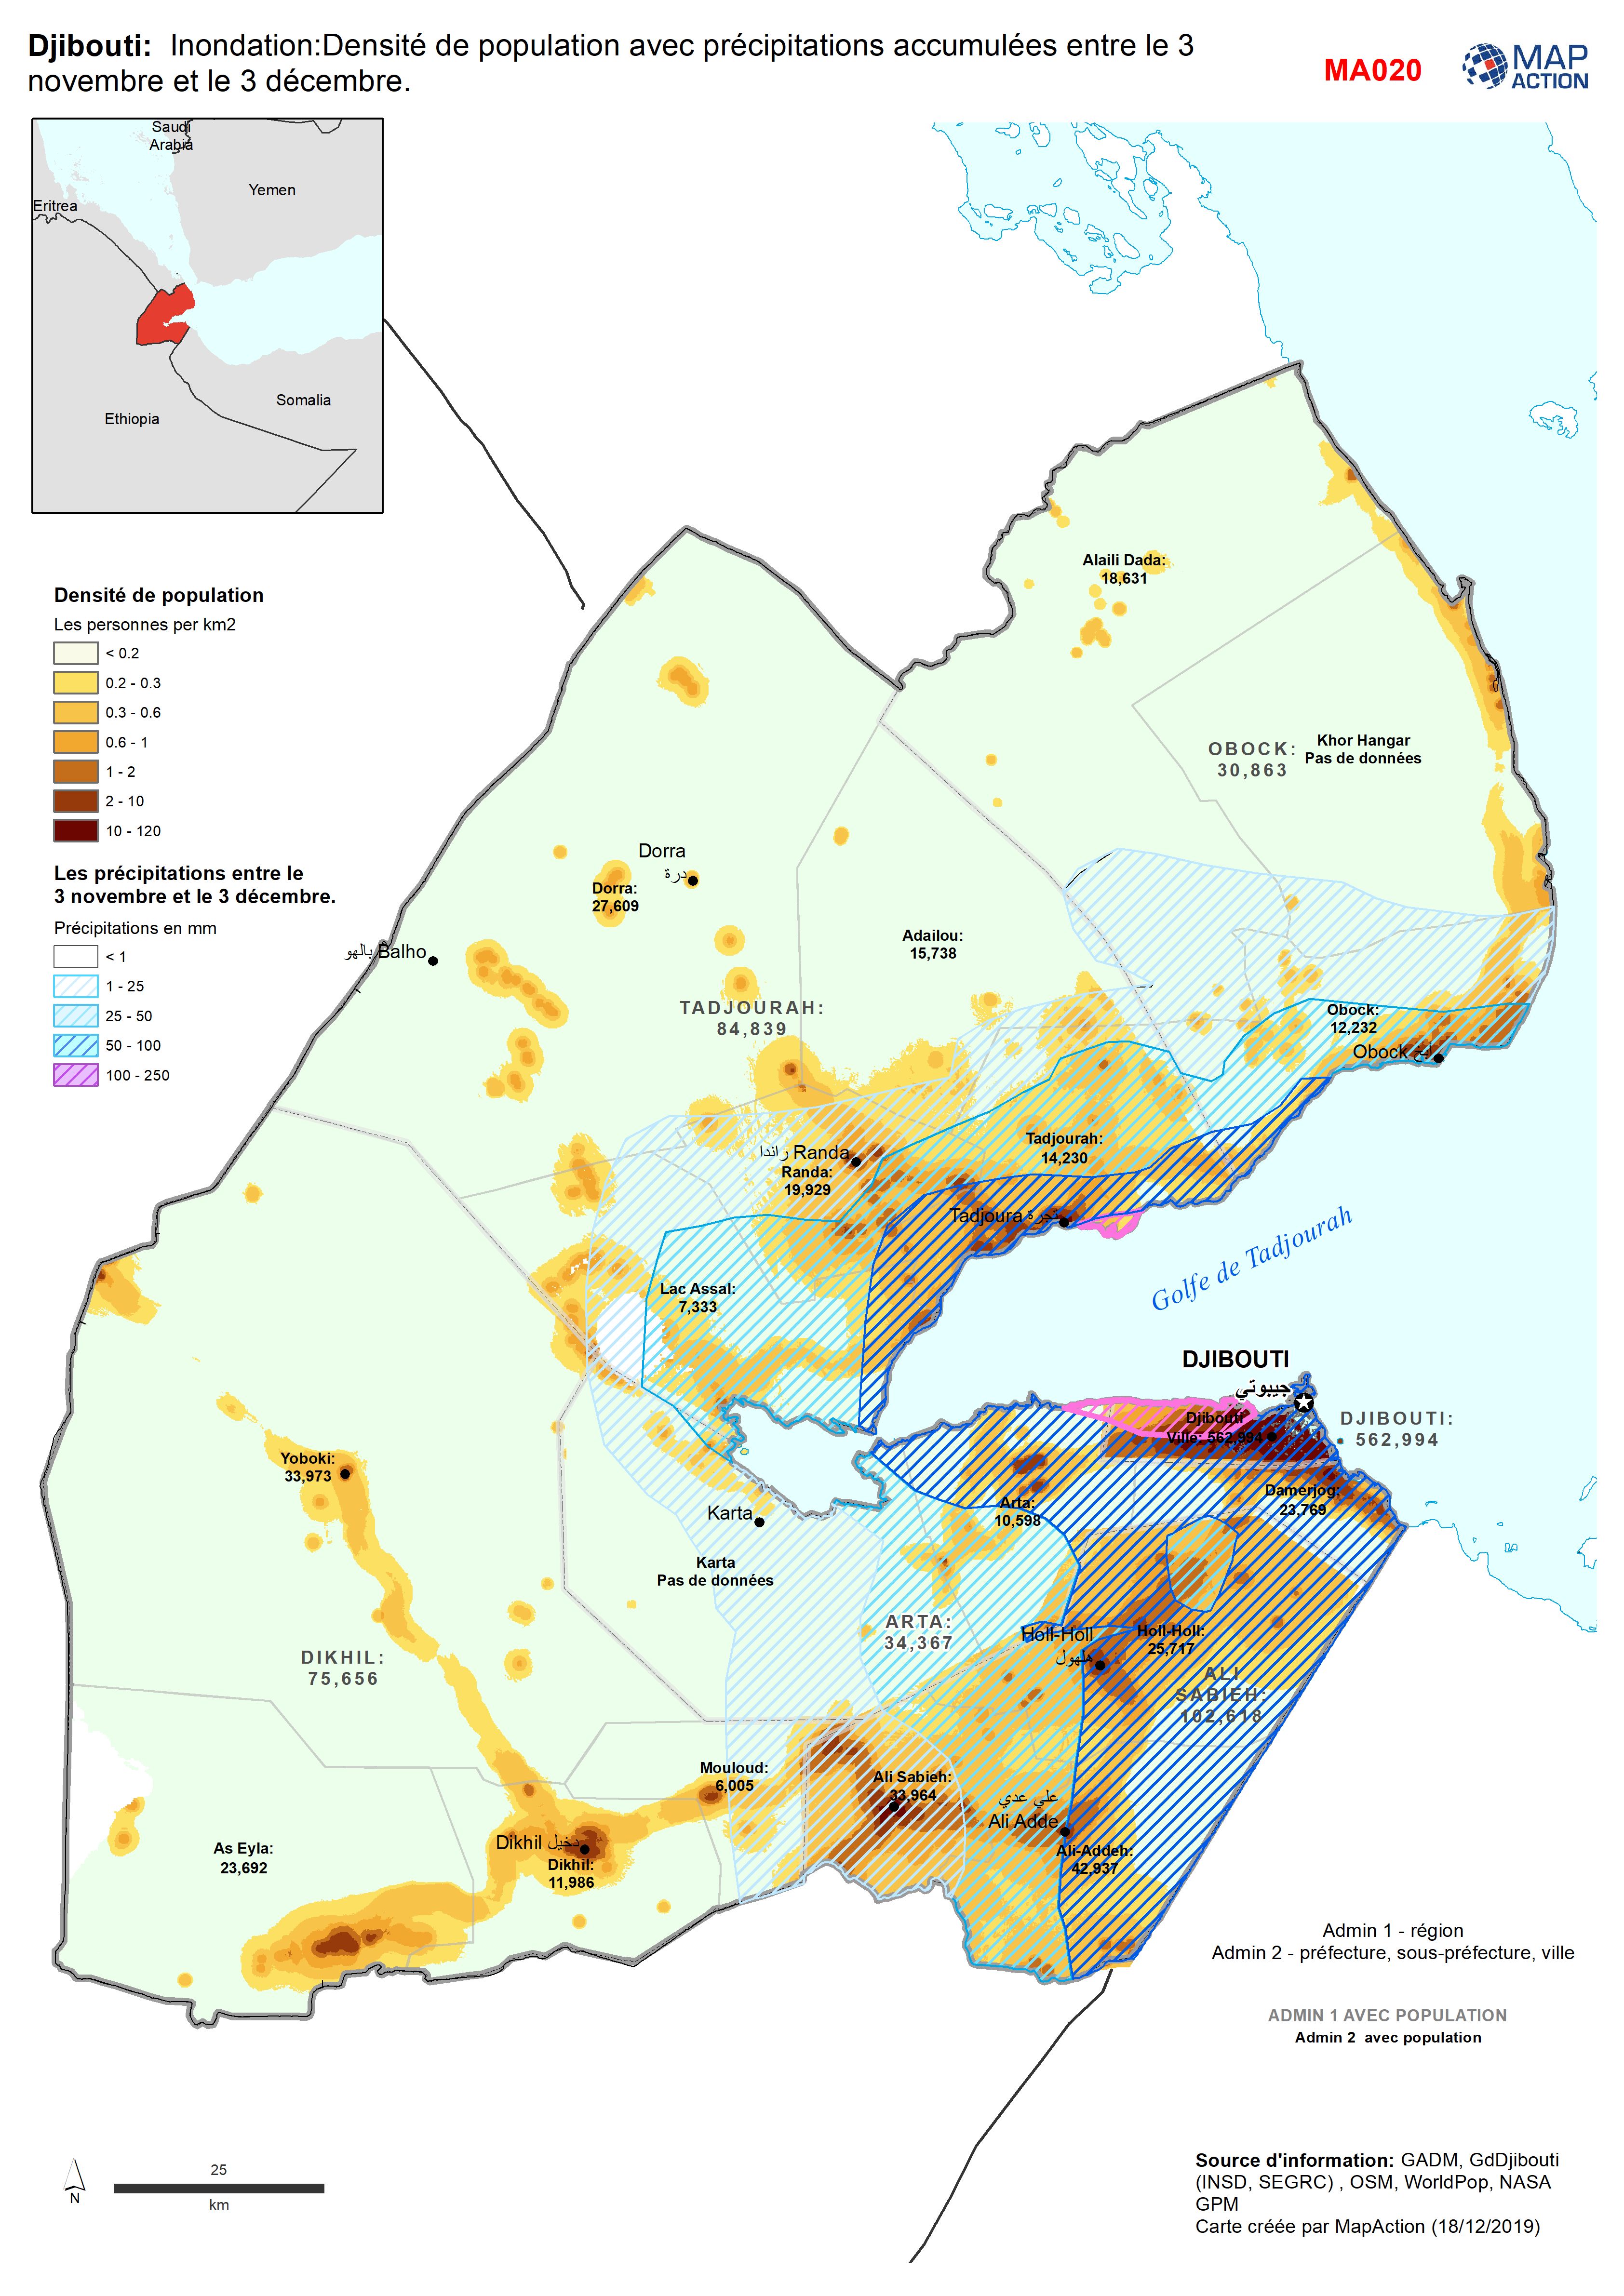
Djibouti: Inondation:Densité de population avec précipitations accumulées ent...
Population Density for 2018 with accumulated rainfall between 3 Nov - 3 Dec. -
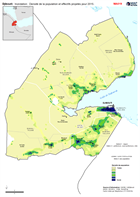
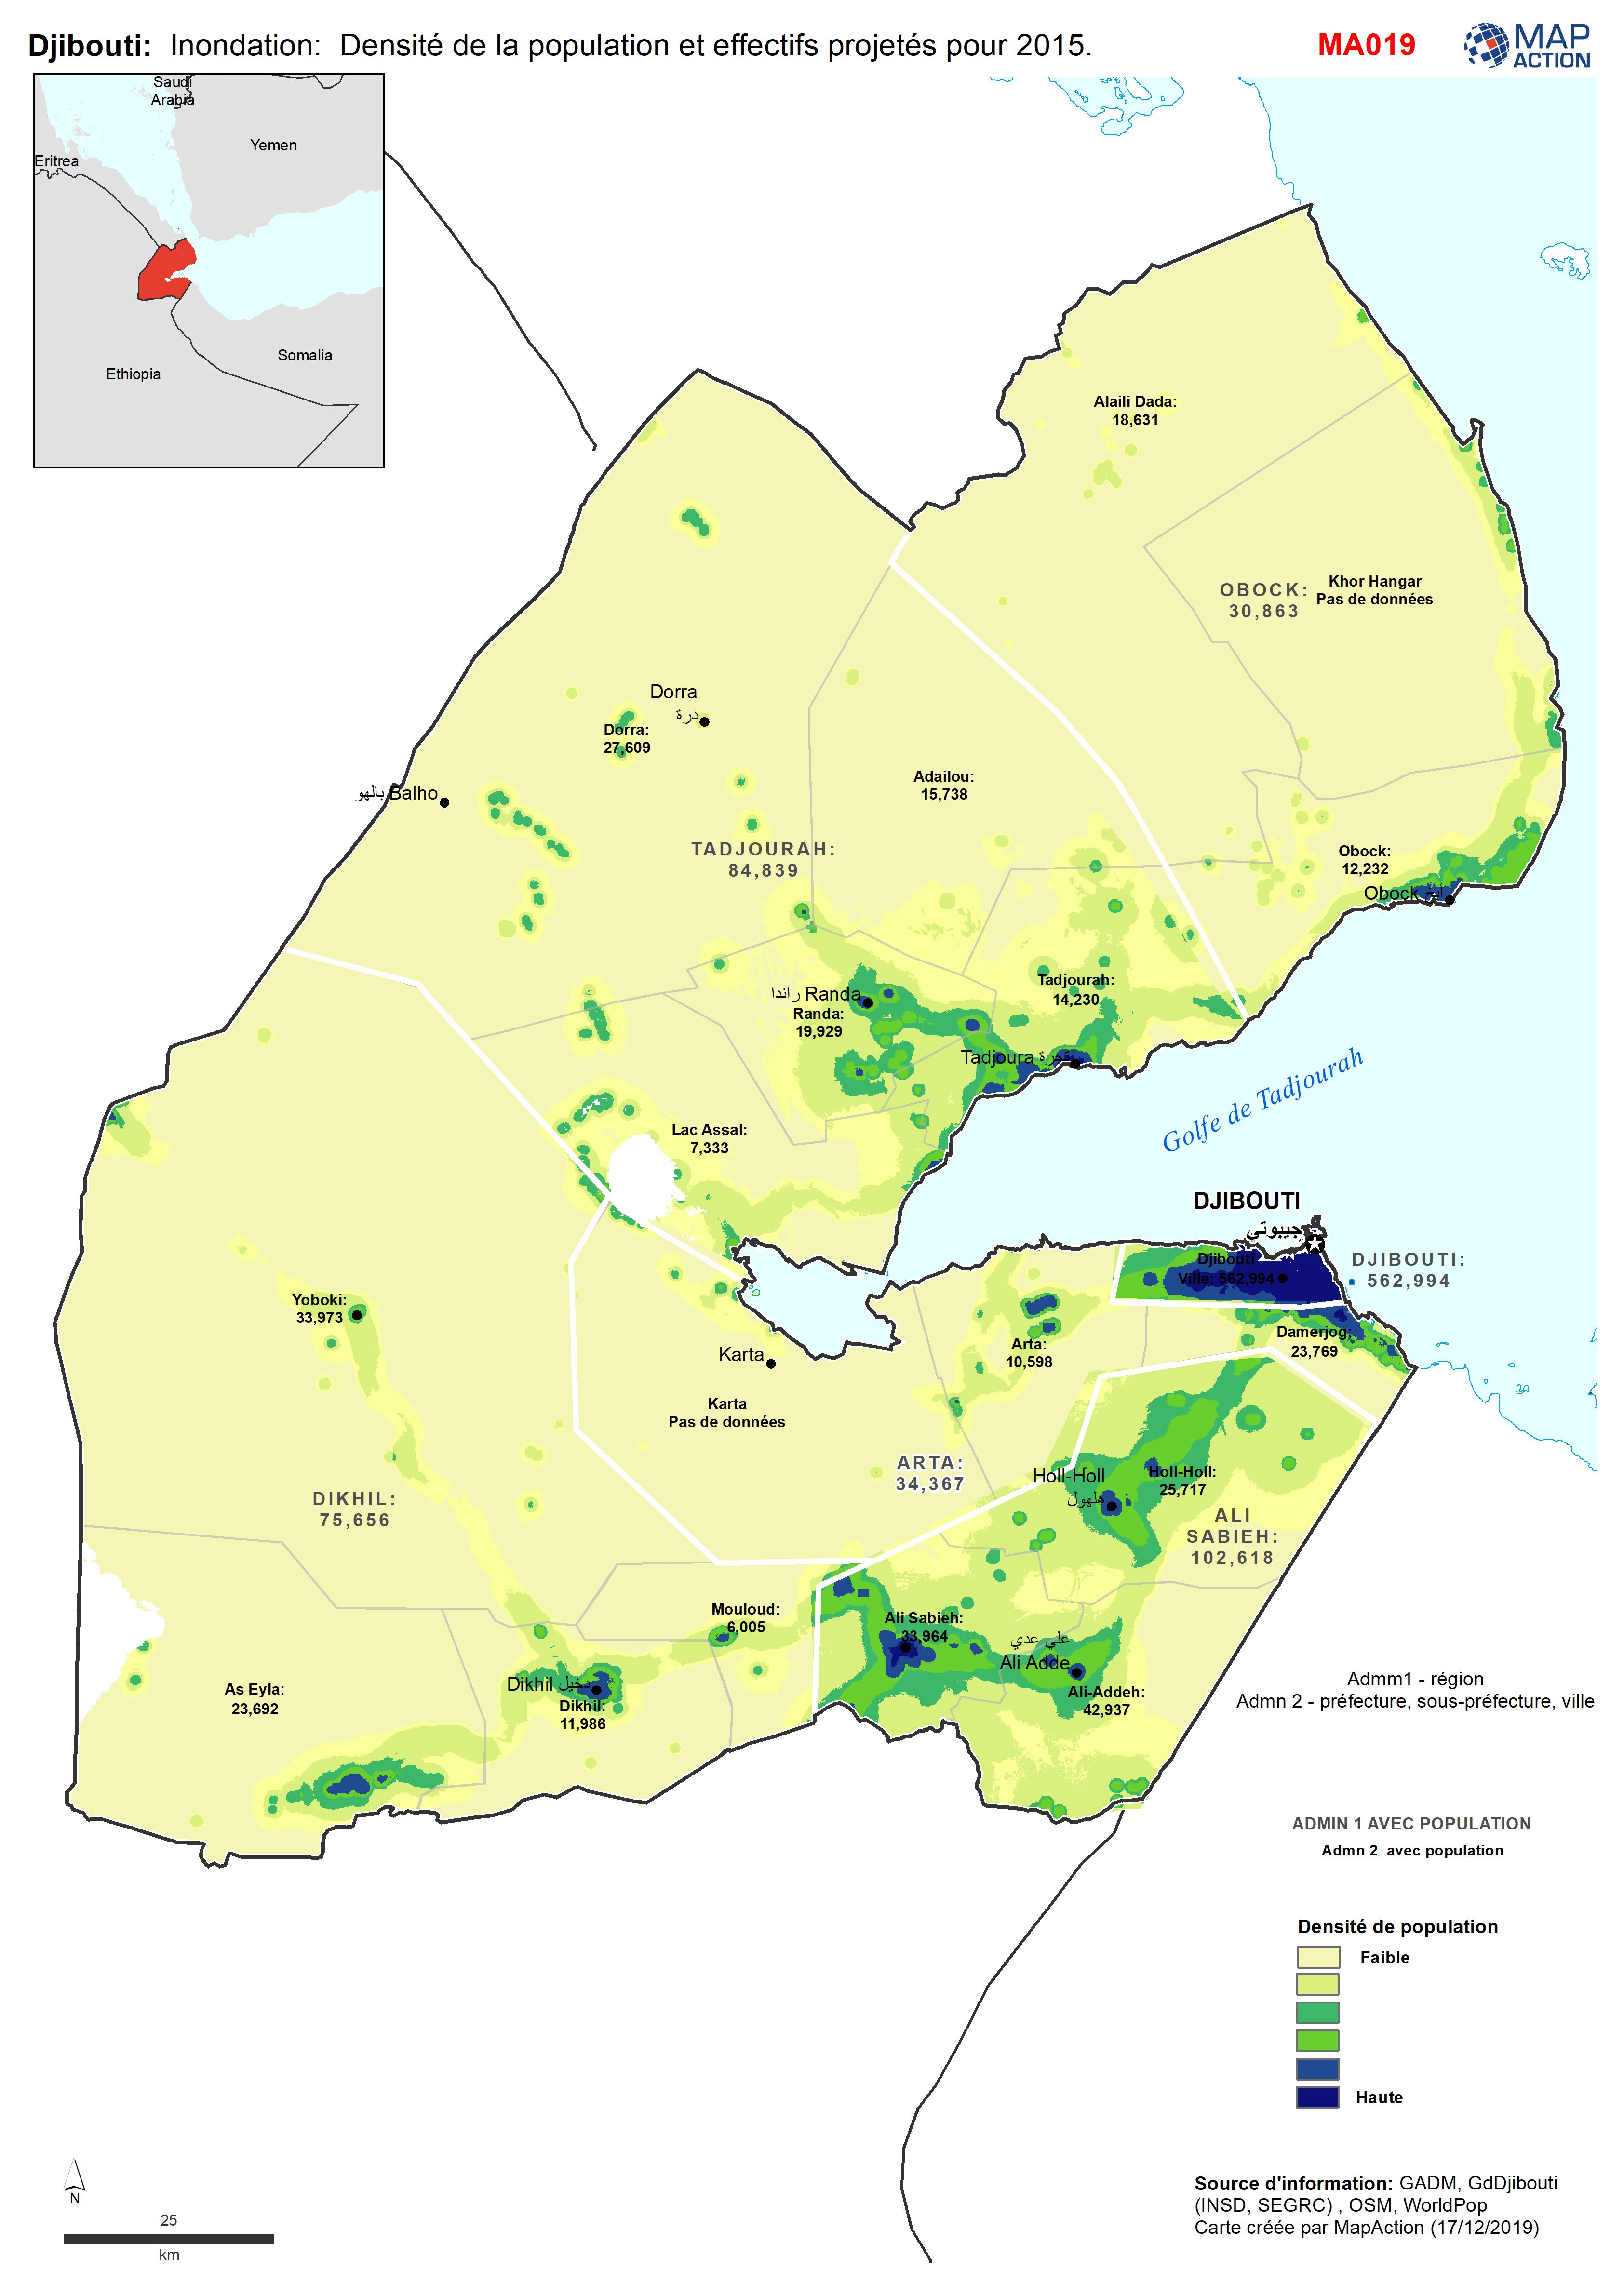
Djibouti: Inondation: Densité de la population et effectifs projetés pour 2015.
Population Density for 2018 with population totals projected forward from 2009 census to 2015 for Admin Level 1 (District/Region) and Admin Level 2 (Prefecture, Sous Prefecture... -

Djibouti: - Building Stock possibly affected or not affected by flooding - Dj...
Djibouti - Floods - Buildings around Djibouti Ville. Map shows building footprints (single houses, blocks of houses or other buidings) and whether they are likely to have been... -
Djibouti: Key Building Locations in affected and non-affected zones - Djibout...
Djibouti - Floods - Key Buildings around Djibouti Ville. Map shows locations of key buidings from government and OSM sources and whether they are likely to have been affected... -
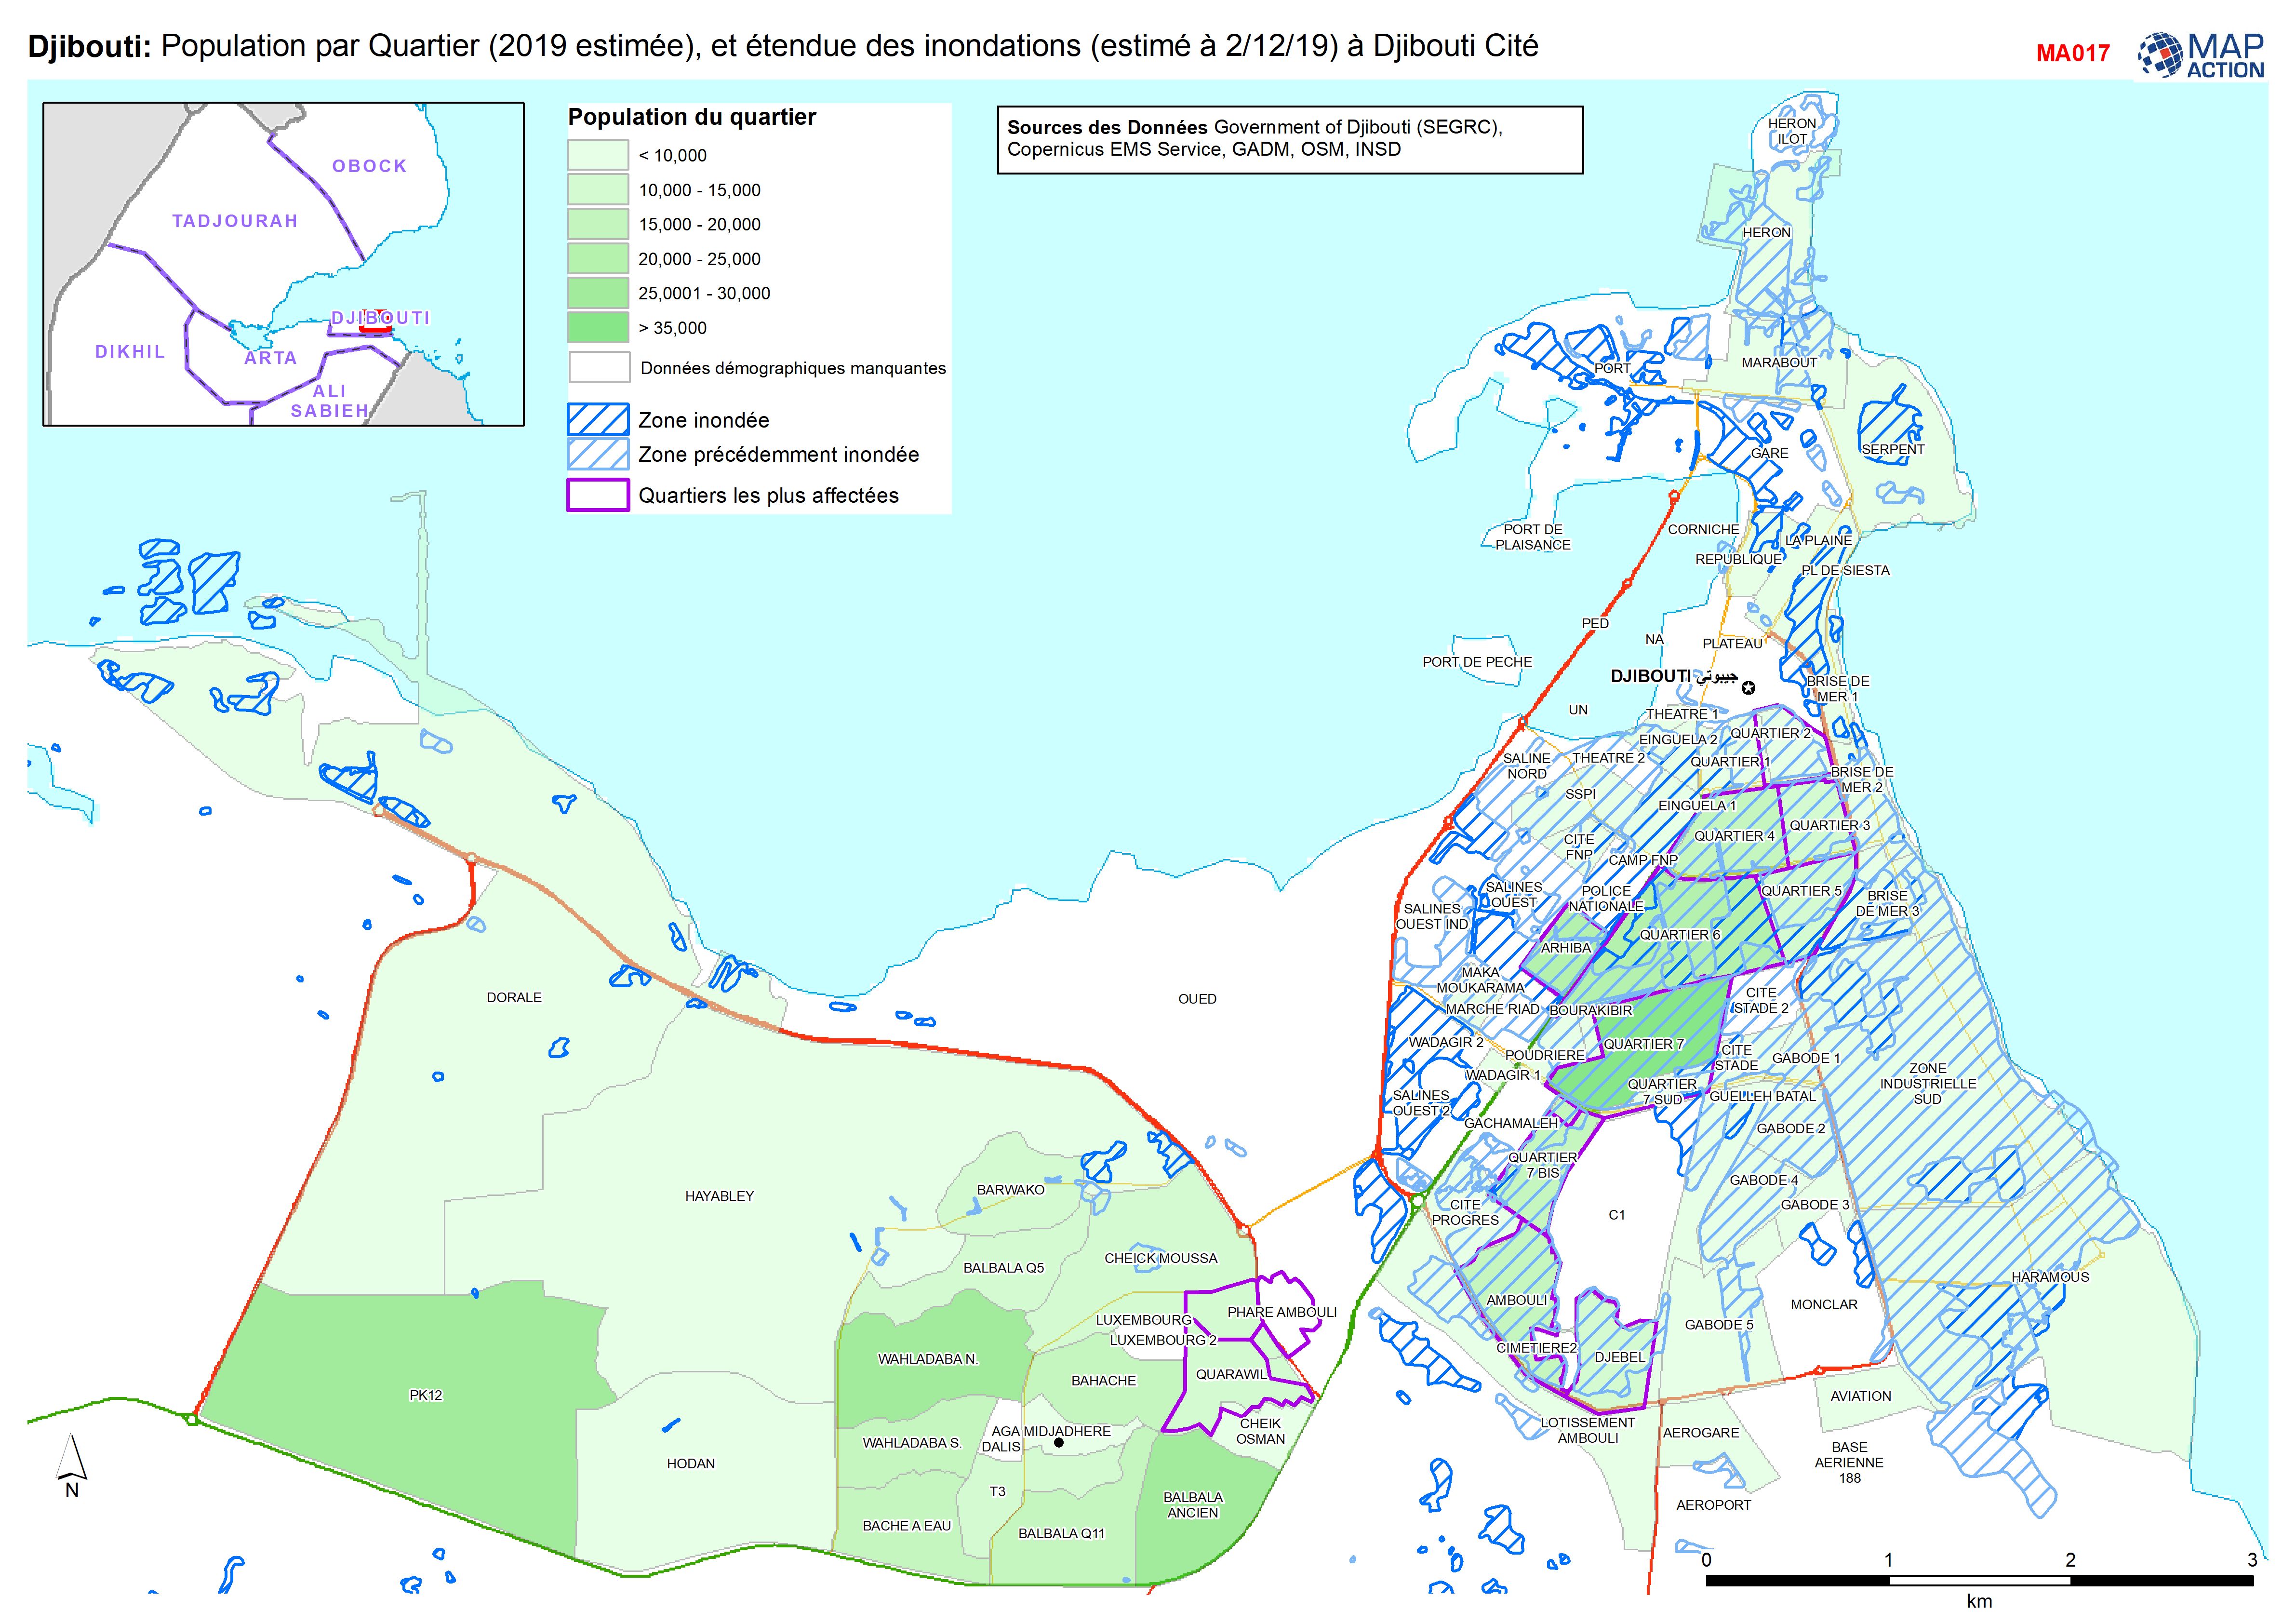
Djibouti: Population par Quartier (2019 estimée), et étendue des inondations ...
Population par Quartier (2019, estimée), et étendue des inondations (estimé à 2/12/19) à Djibouti Cité -

Djibouti: Inondation: Projection de la population pour 2015 par niveaux Admin...
Population totals projected forward from 2009 census to 2015 for Admin Level 1 (District/Region) and Admin Level 2 (Prefecture, Sous Prefecture and Ville). Note Admin 1 totals... -

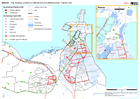
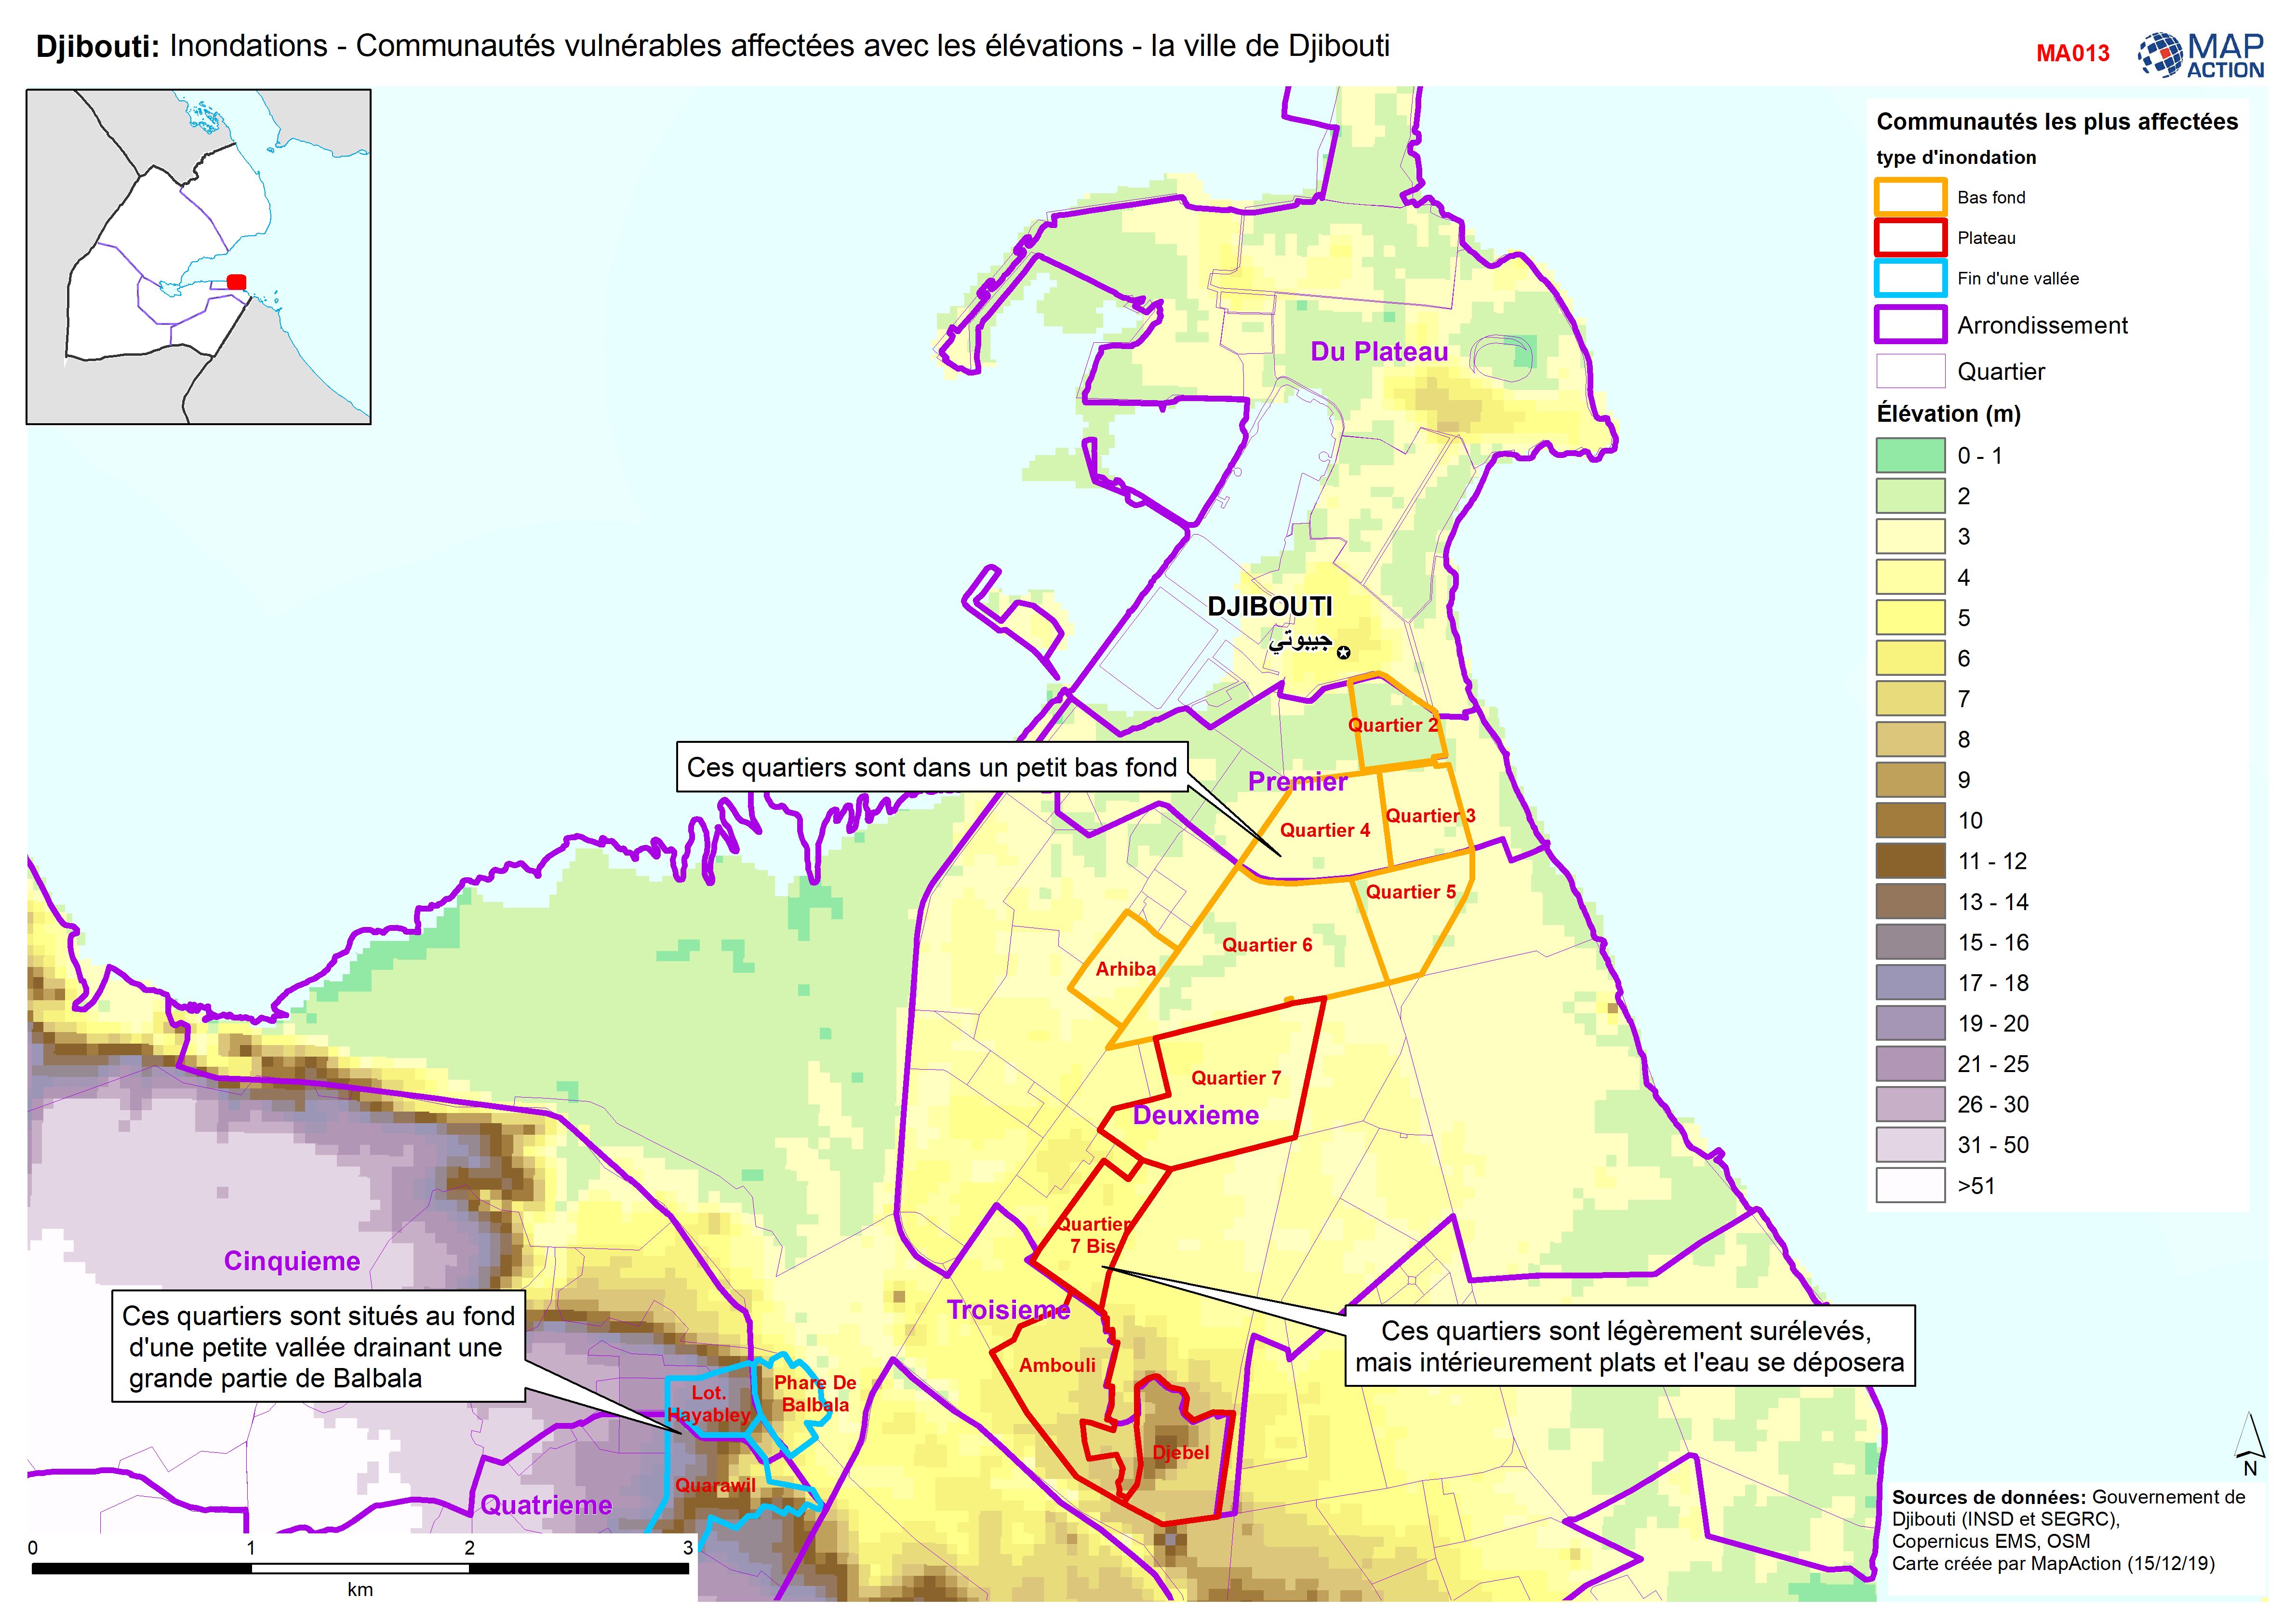
Djibouti: Inondations - Communautés vulnérables affectées avec les élévations...
Djibouti City - Map shows the most affected flooded communities, containing the most vulnerable populations, alongside elevation data to demonstrate the effects of elevation and...