-
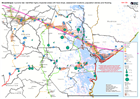
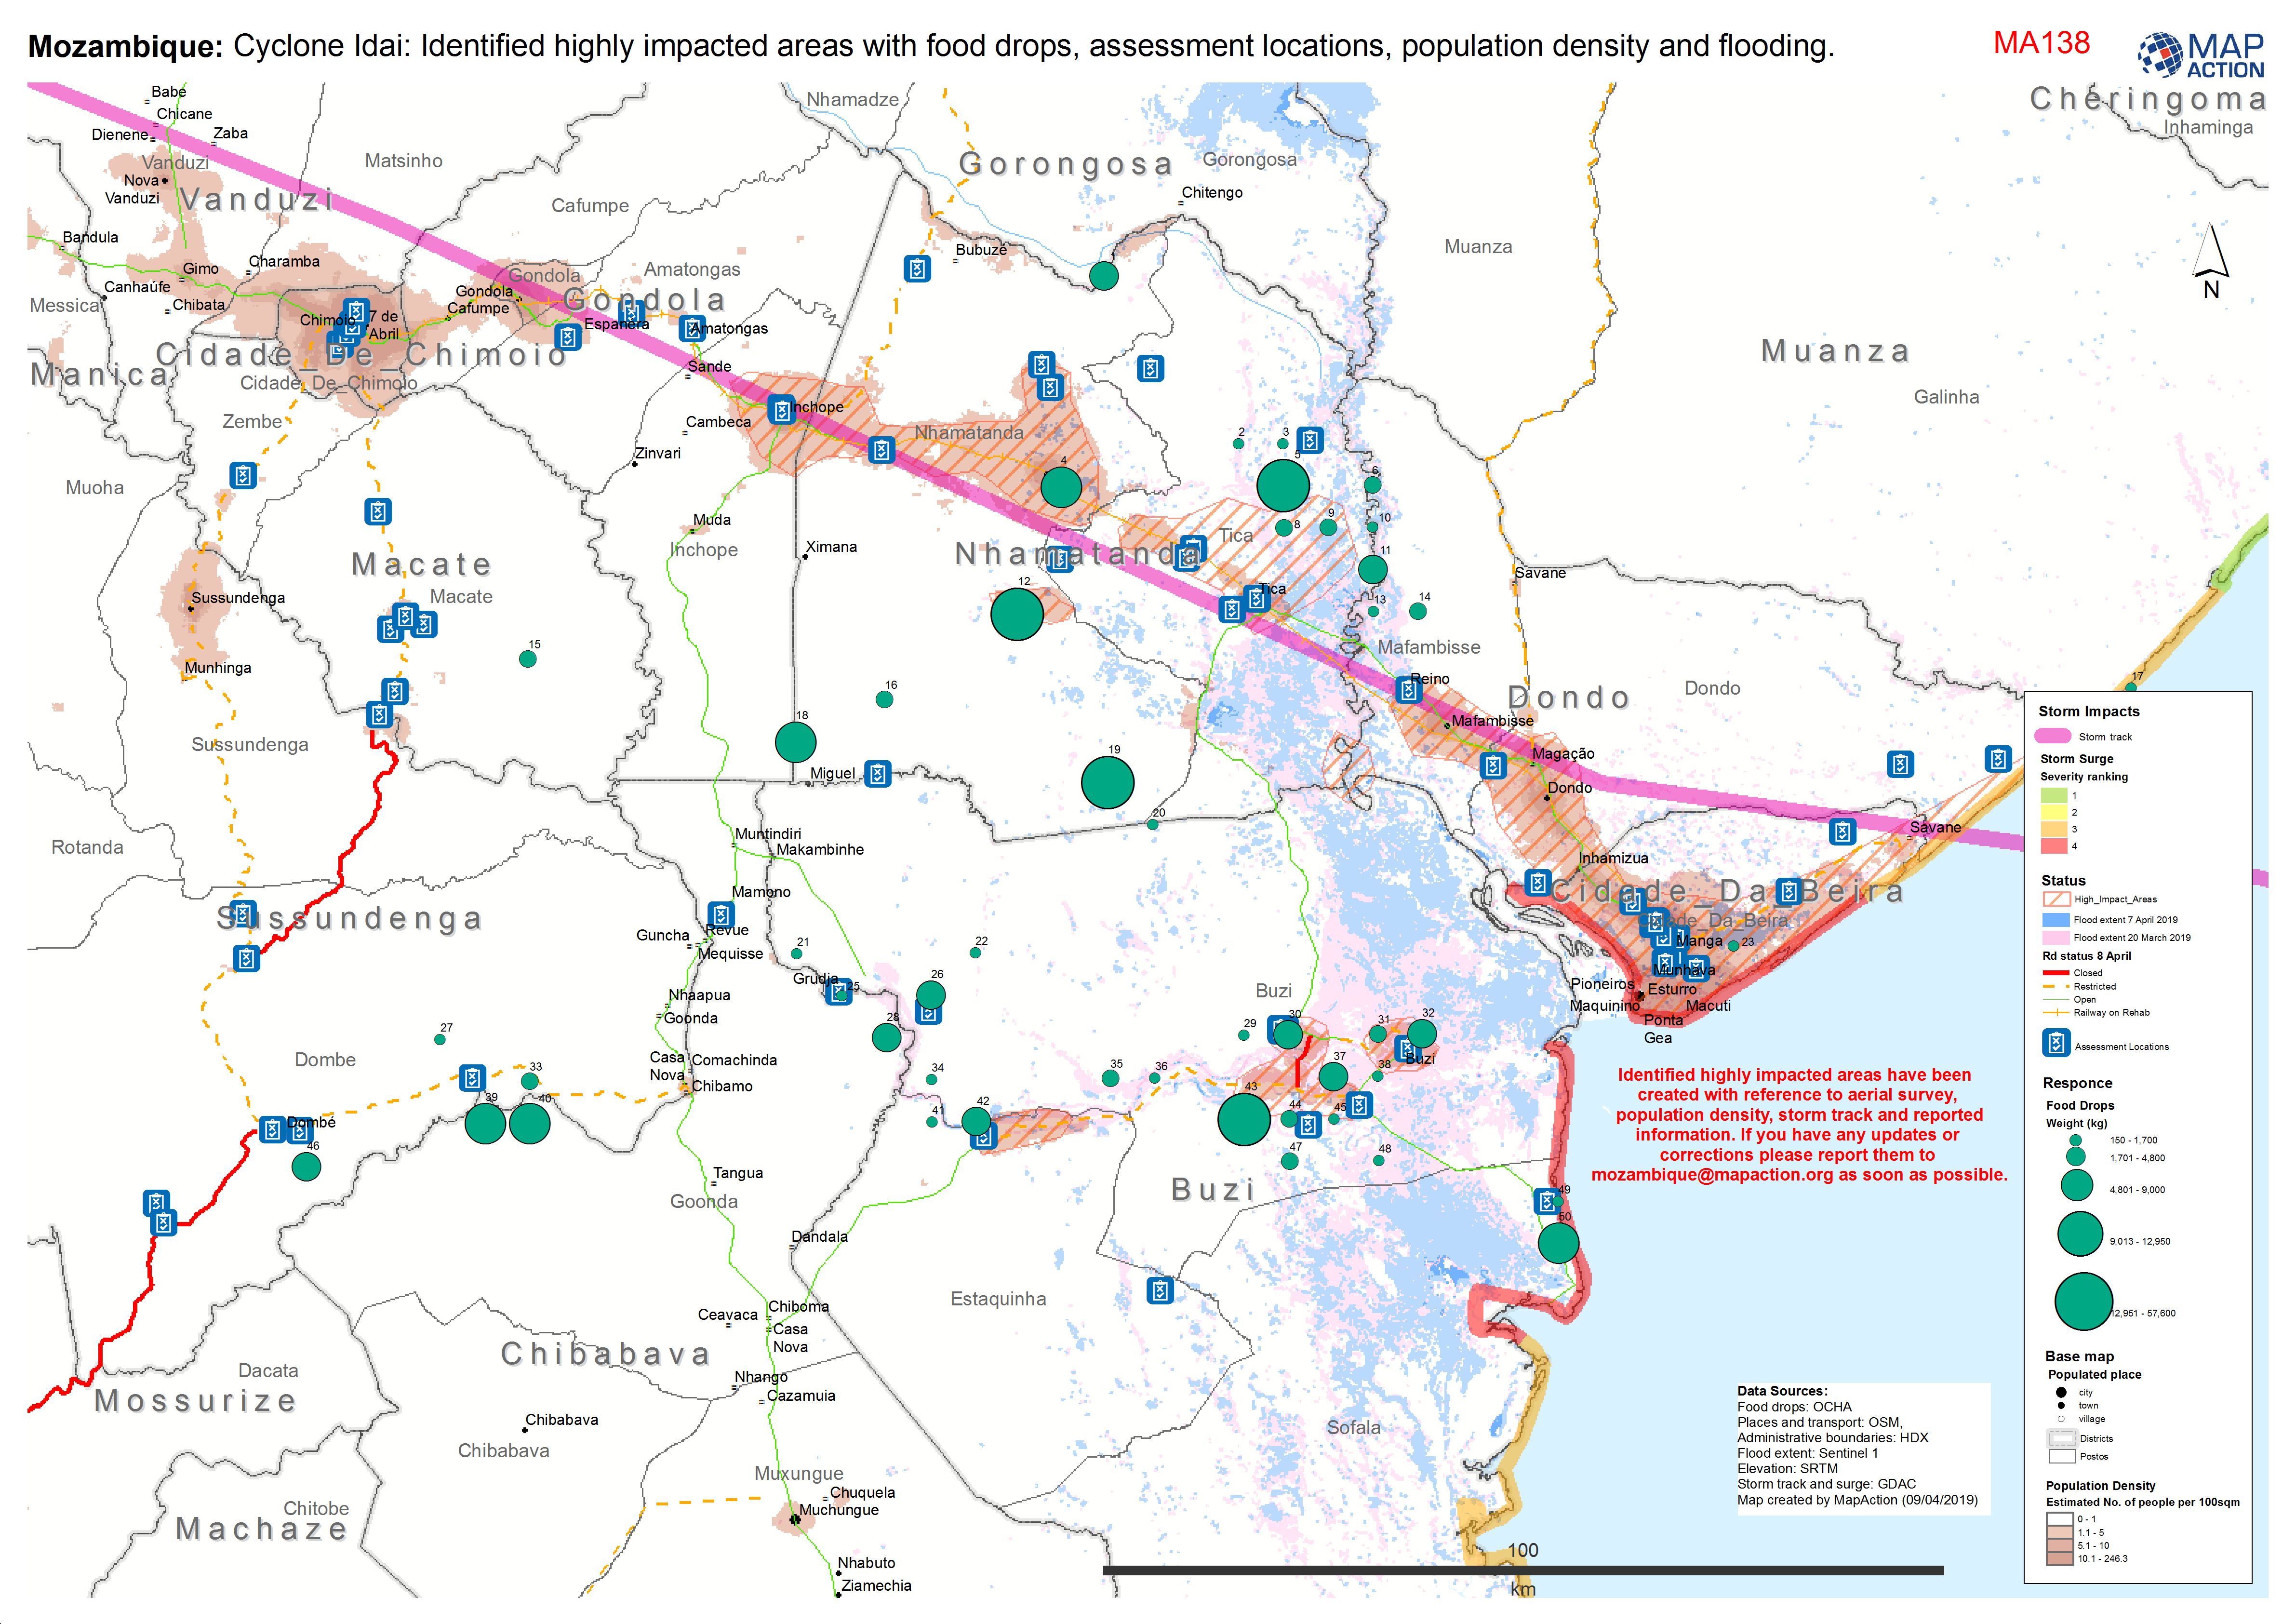
Mozambique: Cyclone Idai: Identified highly impacted areas with food drops, a...
Situation map showing areas of high impact, assessment locations, access and food drops to date. As at 9 April 2019. -
Mozambique - Cyclone Idai: Manica Province - Number of people affected by los...
The map shows the likely number of people effected by loss of crops. -
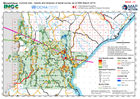
Mozambique: Cyclone Idai - results and analysis of aerial survey as of 29th M...
UNDAC and IFRC survey started 23rd March and will continue until finished -

Mozambique: Cyclone Idai - results and analysis of aerial survey as of 29th M...
UNDAC and IFRC survey started 23rd March and will continue until finished -
Mozambique: Cyclone Idai - results and analysis of aerial survey as of 28th M...
UNDAC and IFRC surey started 23rd March and will continue until finished -
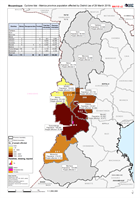
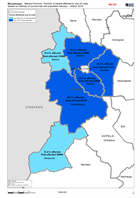
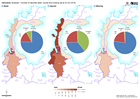
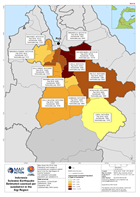
Mozambique: Cyclone Idai - Manica province population affected by District (...
This map shows the population affected by district for Manica province -
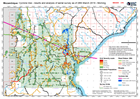
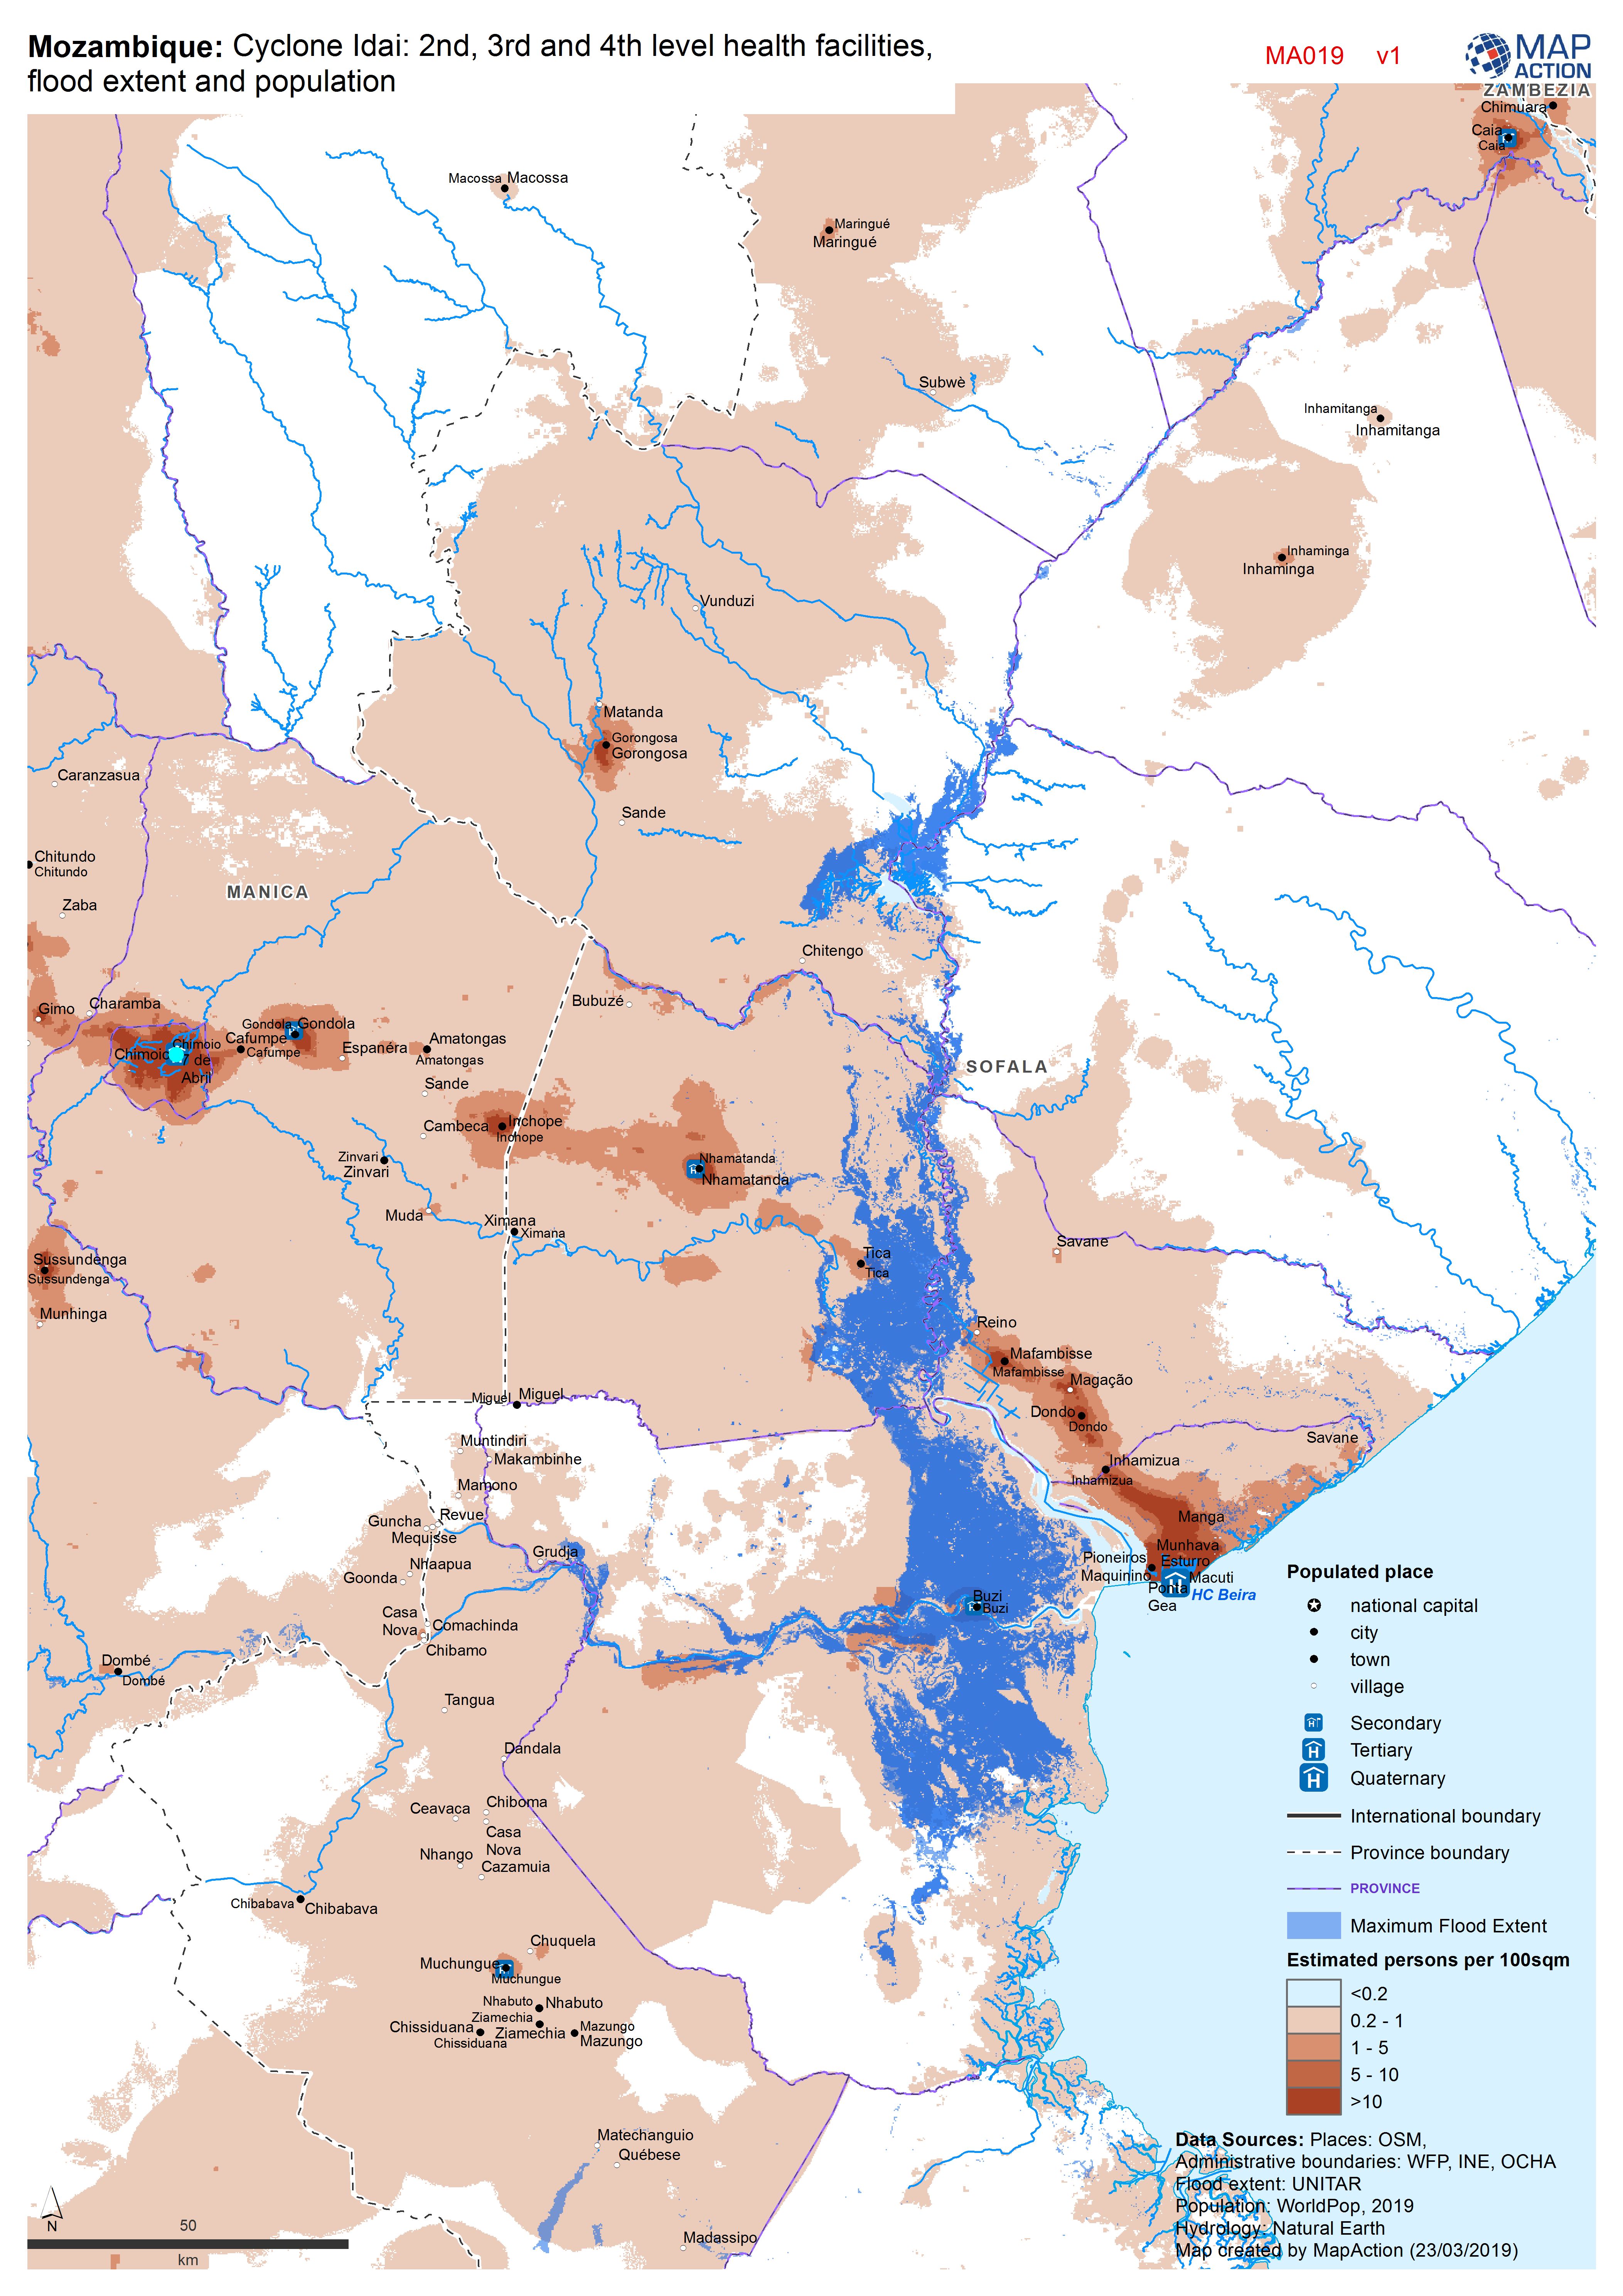
Mozambique: Cyclone Idai - 2nd, 3rd and 4th level health facilities, flood ex...
Map shows the population (based on WorldPop at 100m resolution generating through AI) and the Flood Extents known as of 19/20 March 2019 plus Health facilities -
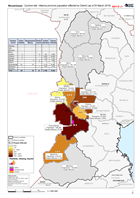
Mozambique: Cyclone Idai - Manica province population affected by District (a...
This map shows the population affected by district for Manica province -

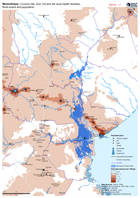
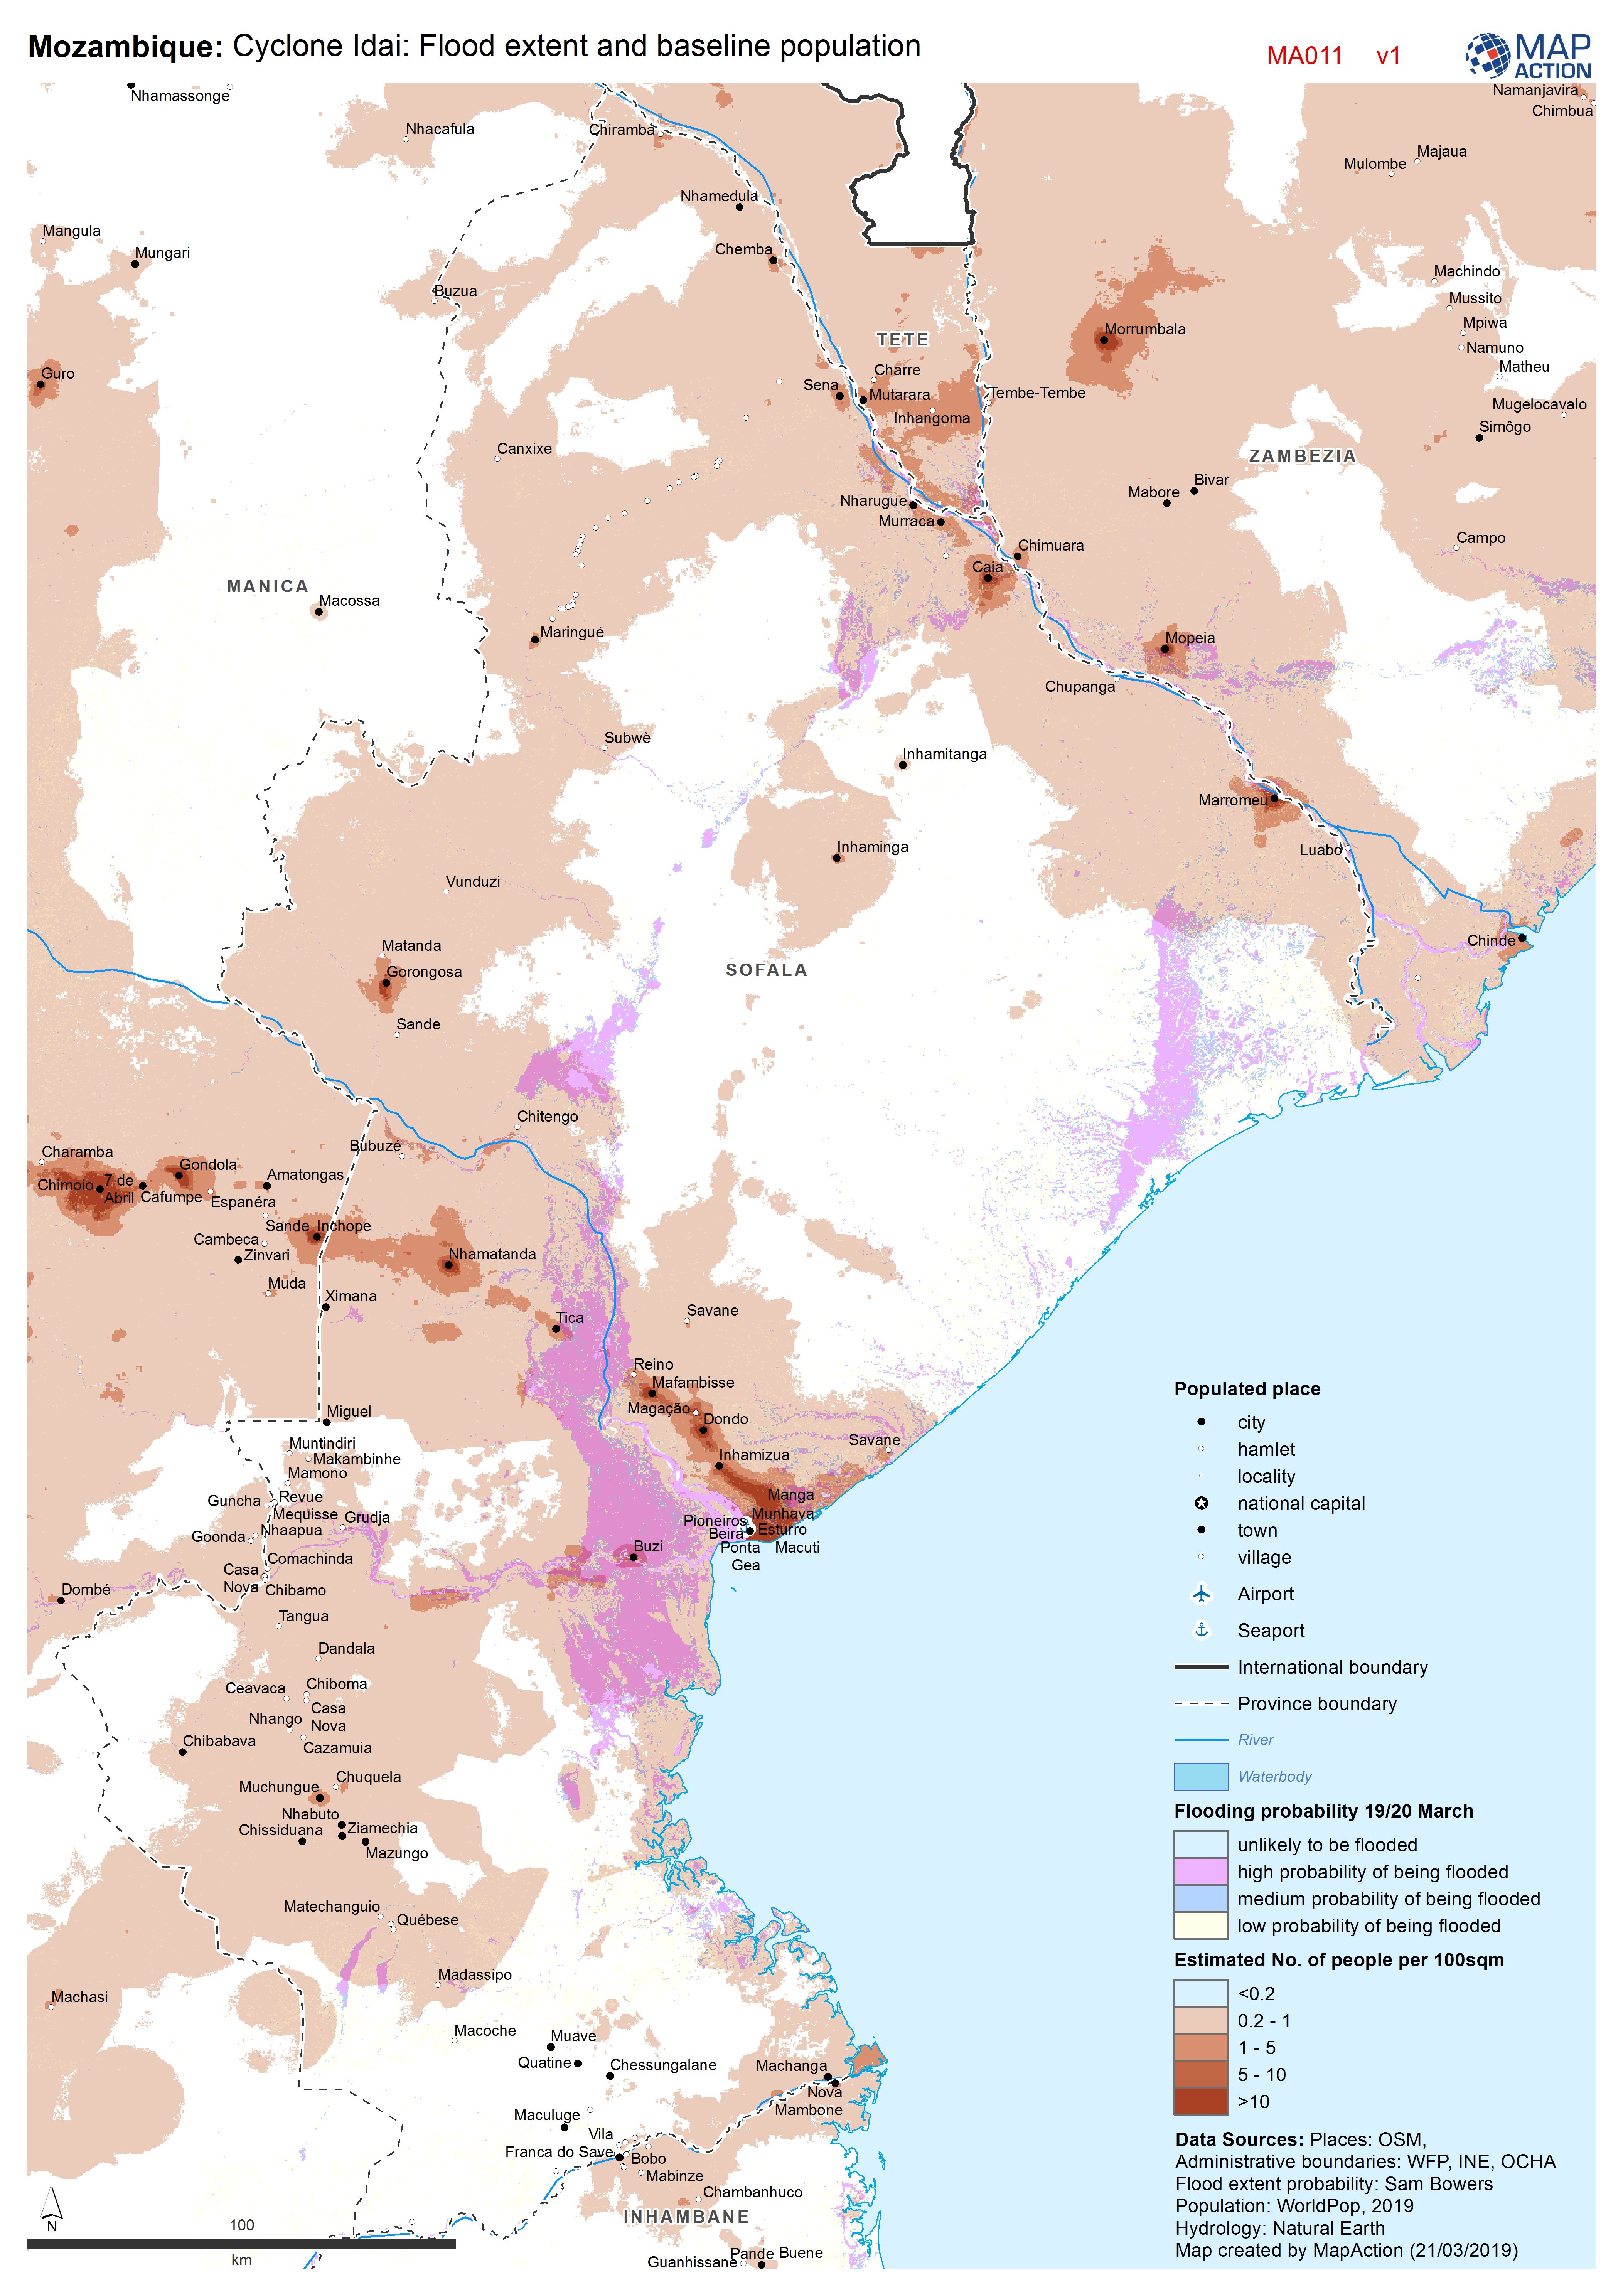
Cyclone Idai: Flood extent and baseline population
Map shows the population (based on WorldPop at 100m resolution generating through AI) and the Flood Extents known as of 19/20 March 2019 -

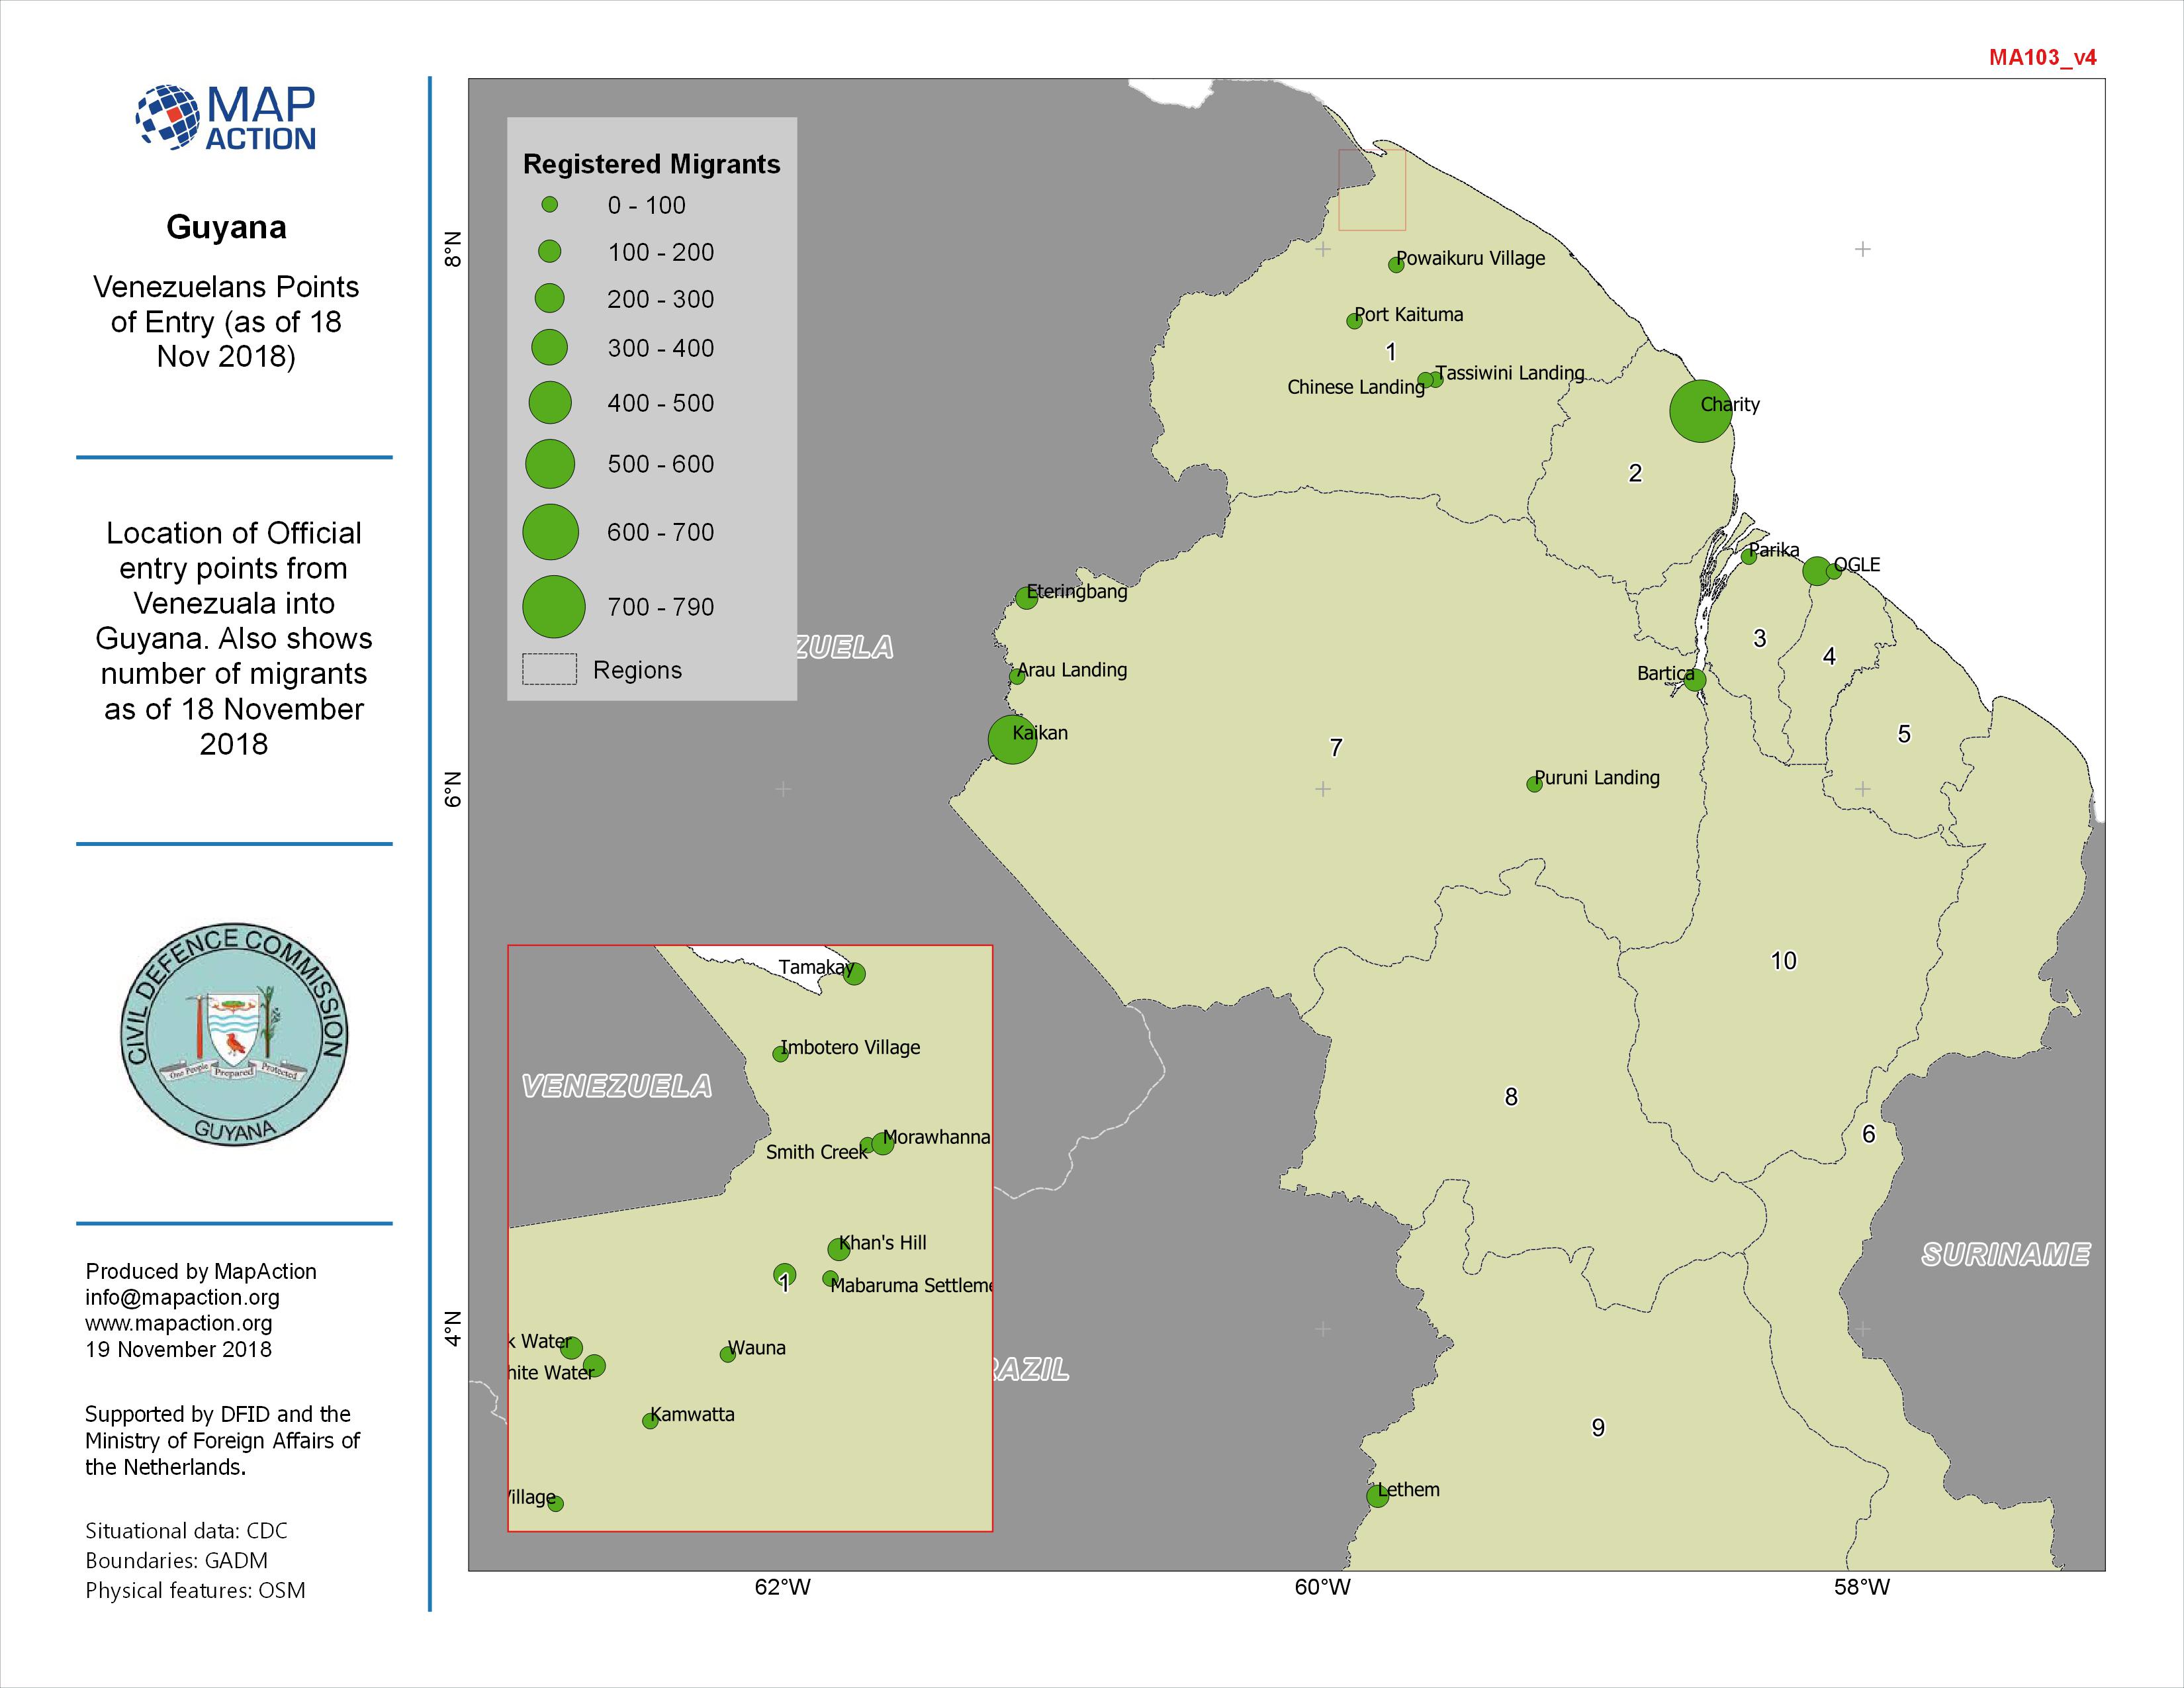
Guyana Venezuelans Points of Entry (as of 18 Nov 2018
Location of Official entry points from Venezuala into Guyana. Also shows number of migrants as of 18 November 2018 -

Guyana Venezuelans Points of Entry (as of 11 Nov 2018
Location of Official entry points from Venezuala into Guyana. Also shows number of migrants as of 11 November 2018 -
Guyana Venezuelans Points of Entry (as of 04 Nov 2018
Location of Official entry points from Venezuala into Guyana. Also shows number of migrants as of 04 November 2018 -

Indonesia: Sulawesi - Number of families at IDP camps (as at 22 Oct 2018)
Map shows the number families at IDP camps visited by the ERAT team. -
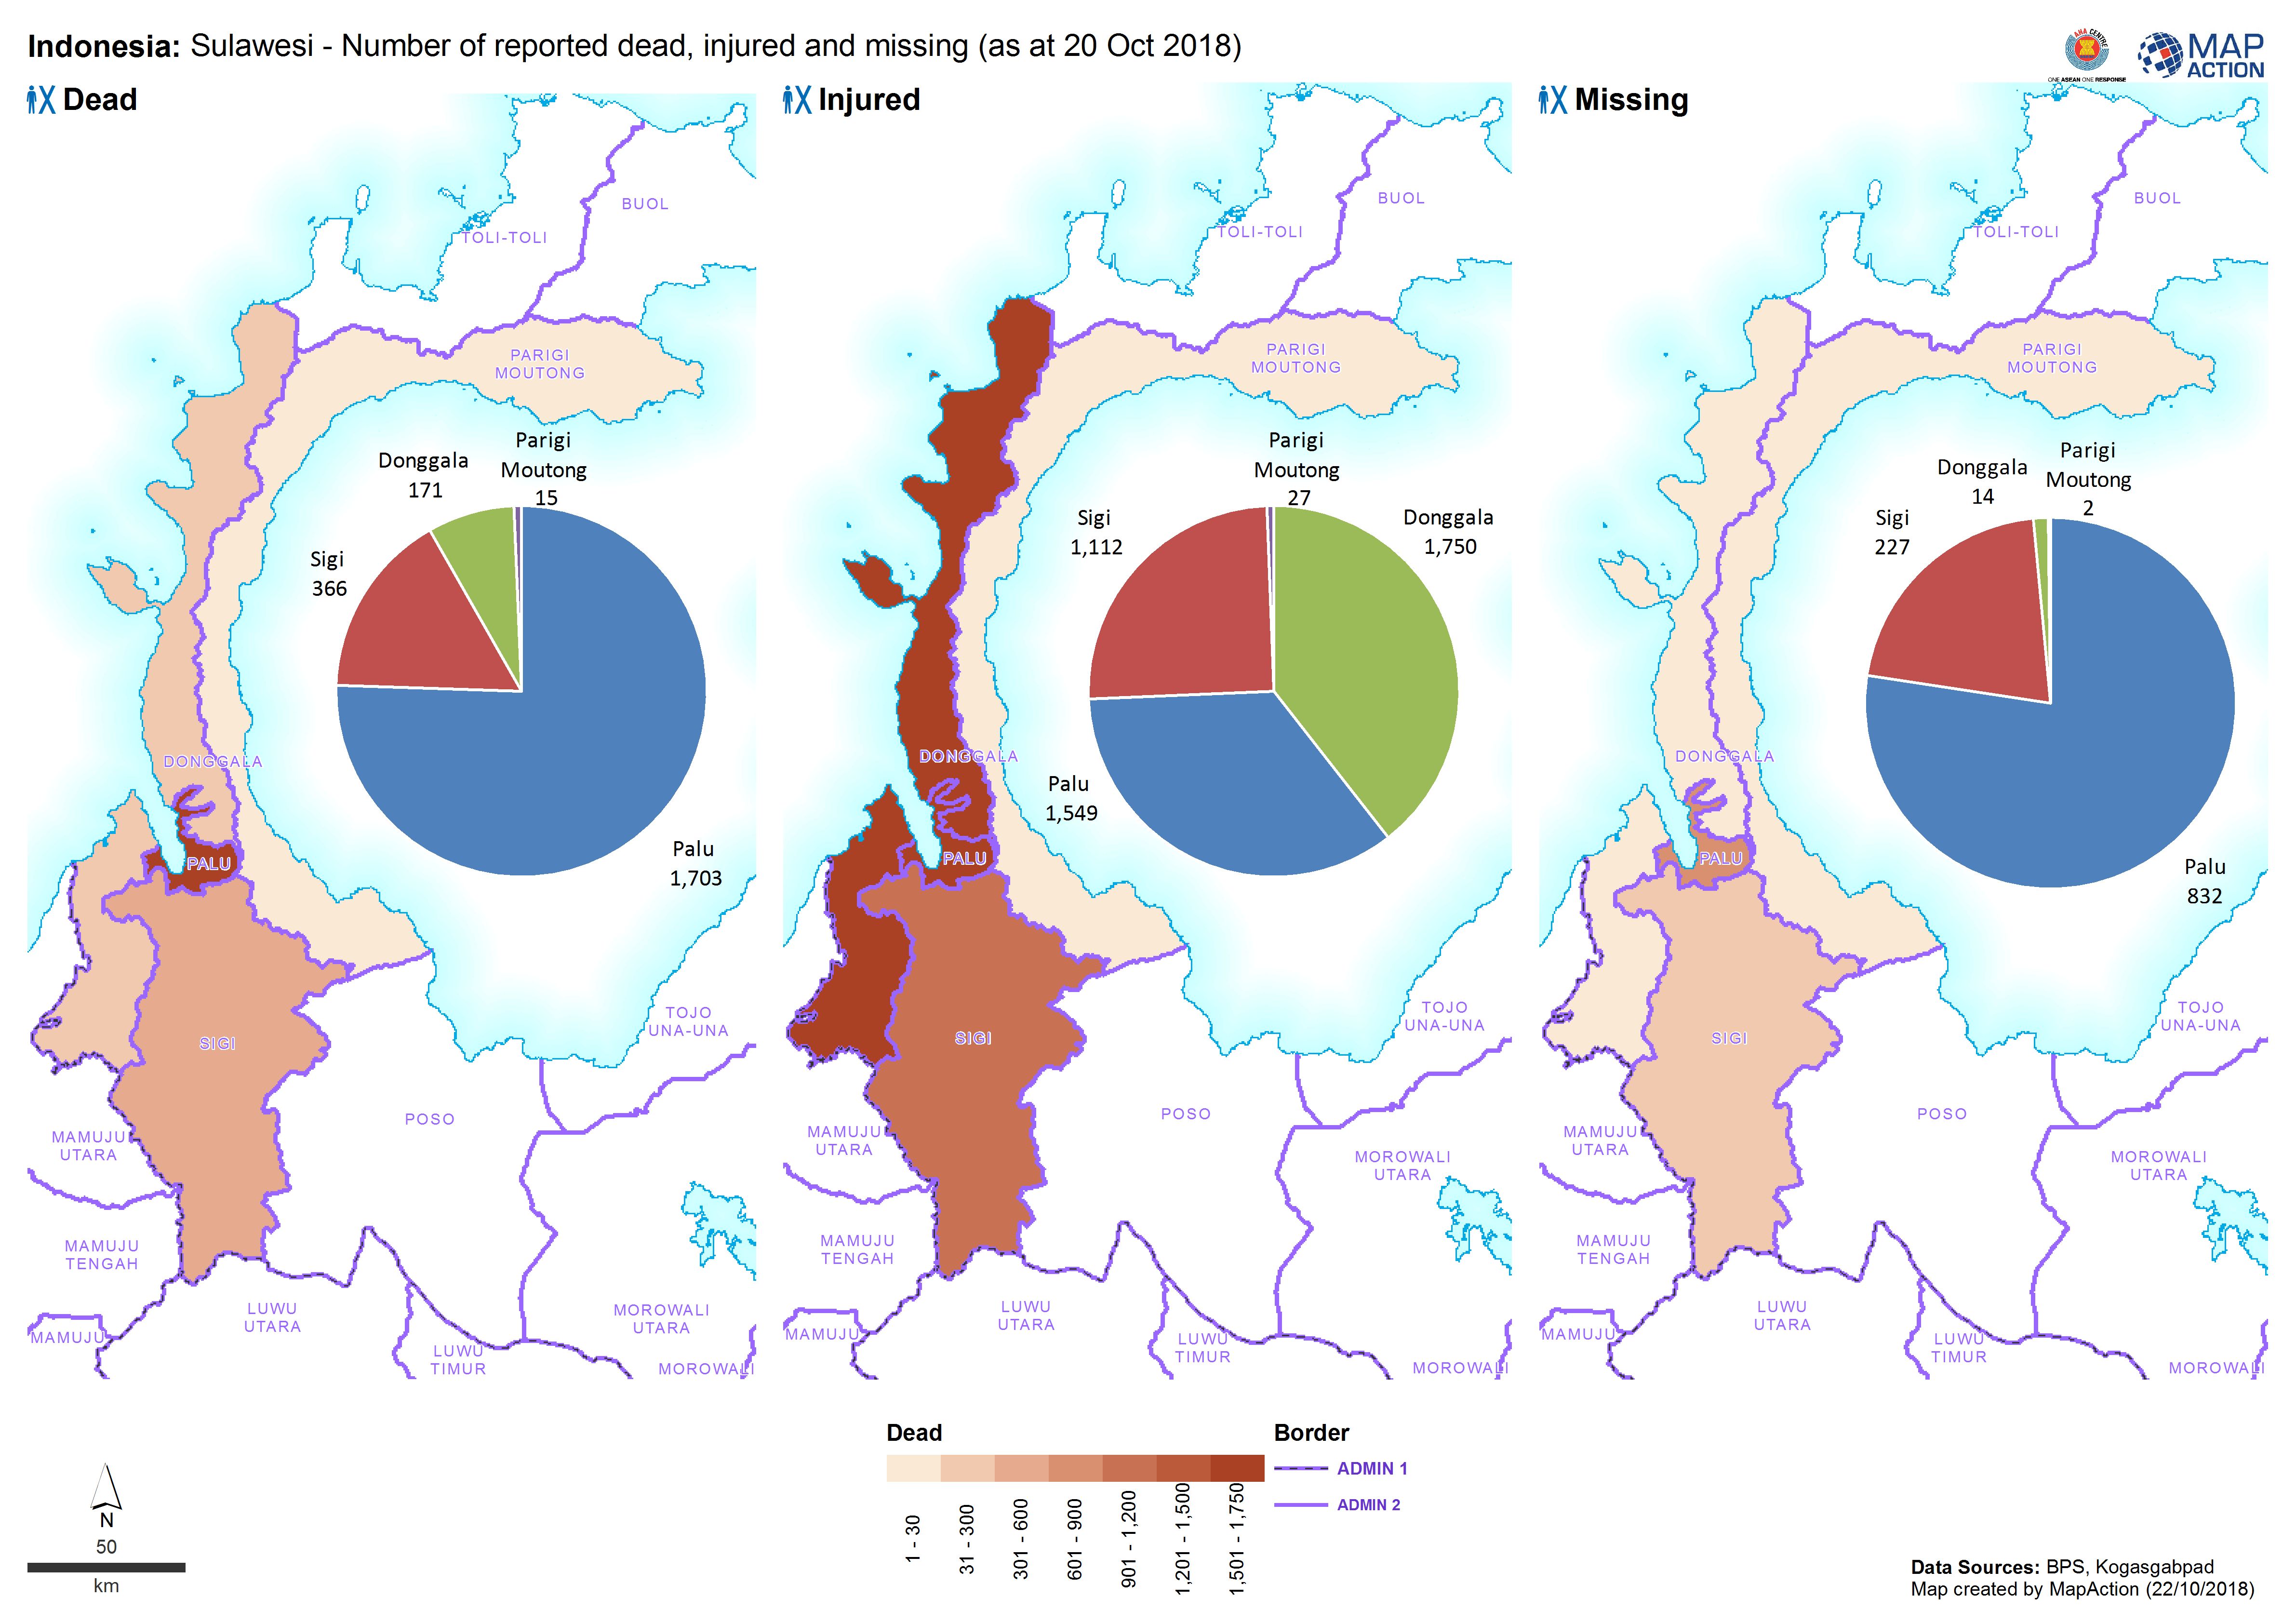
Indonesia: Sulawesi - Number of reported dead, injured and missing (as at 20 ...
Map shows the number of reported dead, injured and missing. -
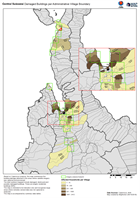
Central Sulawesi Damaged Buildings per Administrative Village Boundary
Based on Copernicus analysis, this map summarises the building damage detected in the areas where satellite imagery was captured and processed. The total numbers mapped include... -
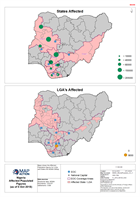
Nigeria Affected Populated Figures (as of 5 Oct 2018)
Maps shows the Affected Population figures for LGAs and States the NEMA SitRep -

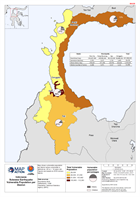
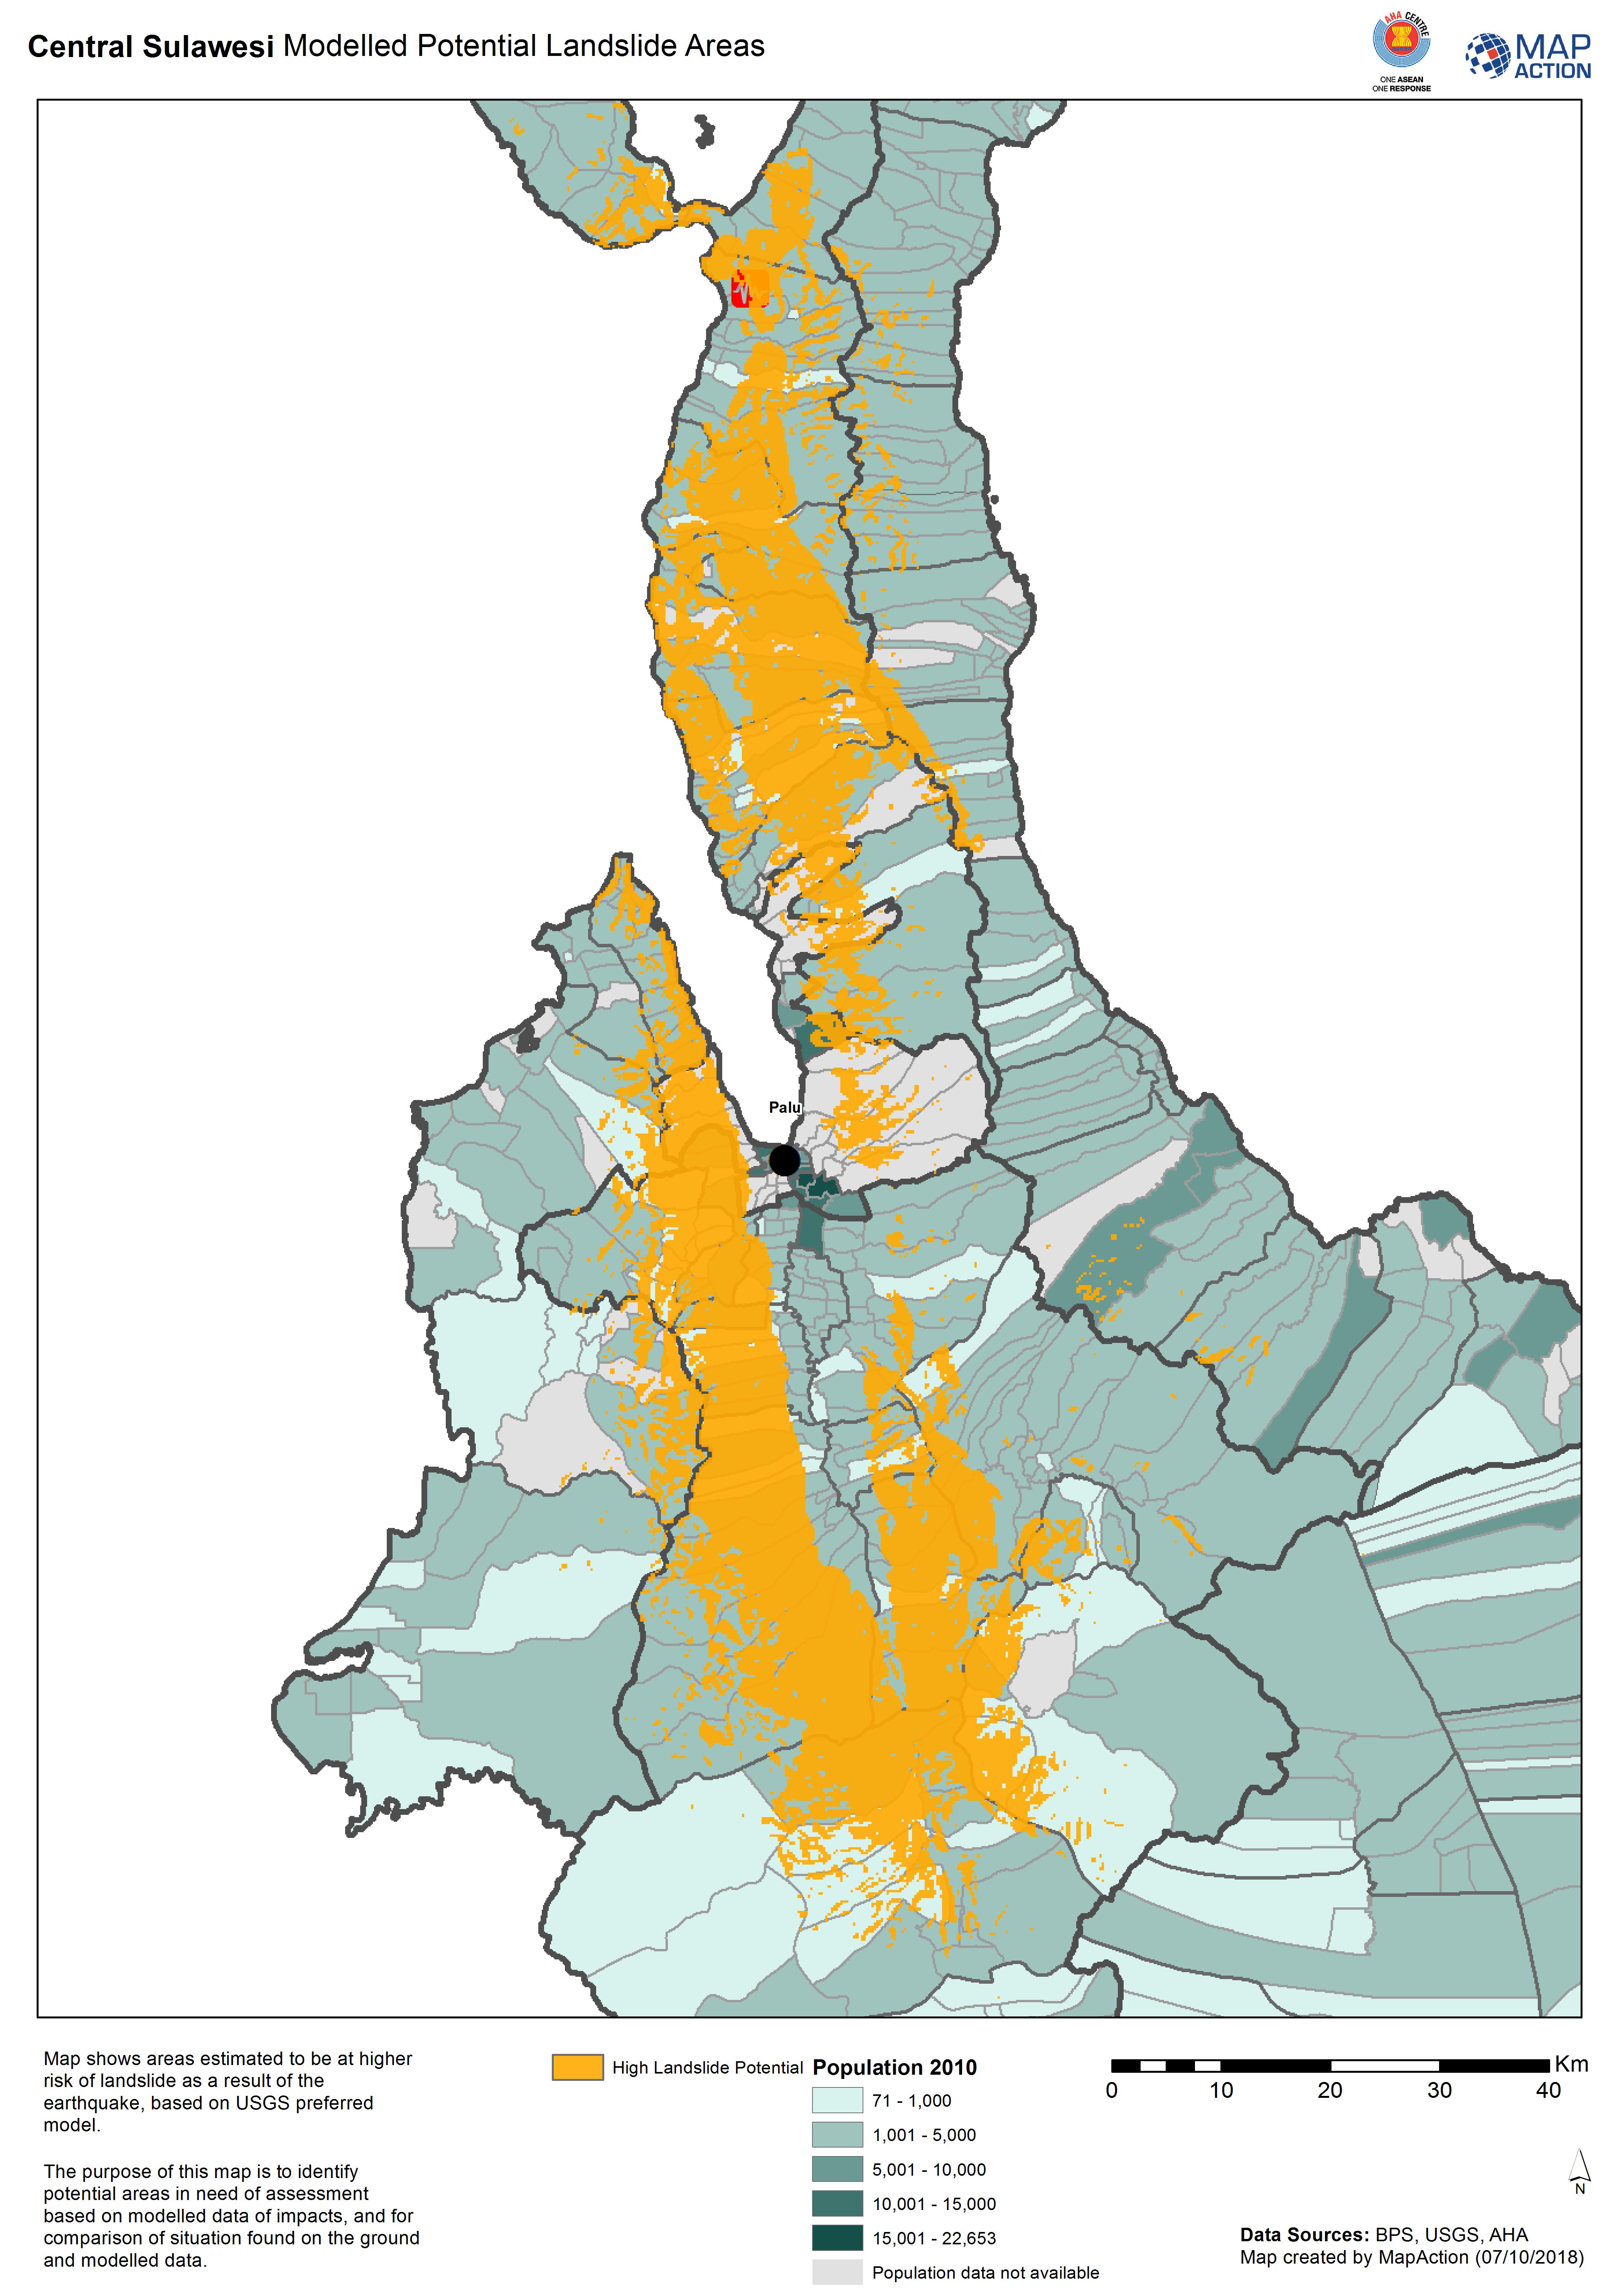
Central Sulawesi Modelled Potential Landslide Areas
Map shows areas estimated to be at higher risk of landslide as aresult of the earthquake, based on USGS preferred model. -

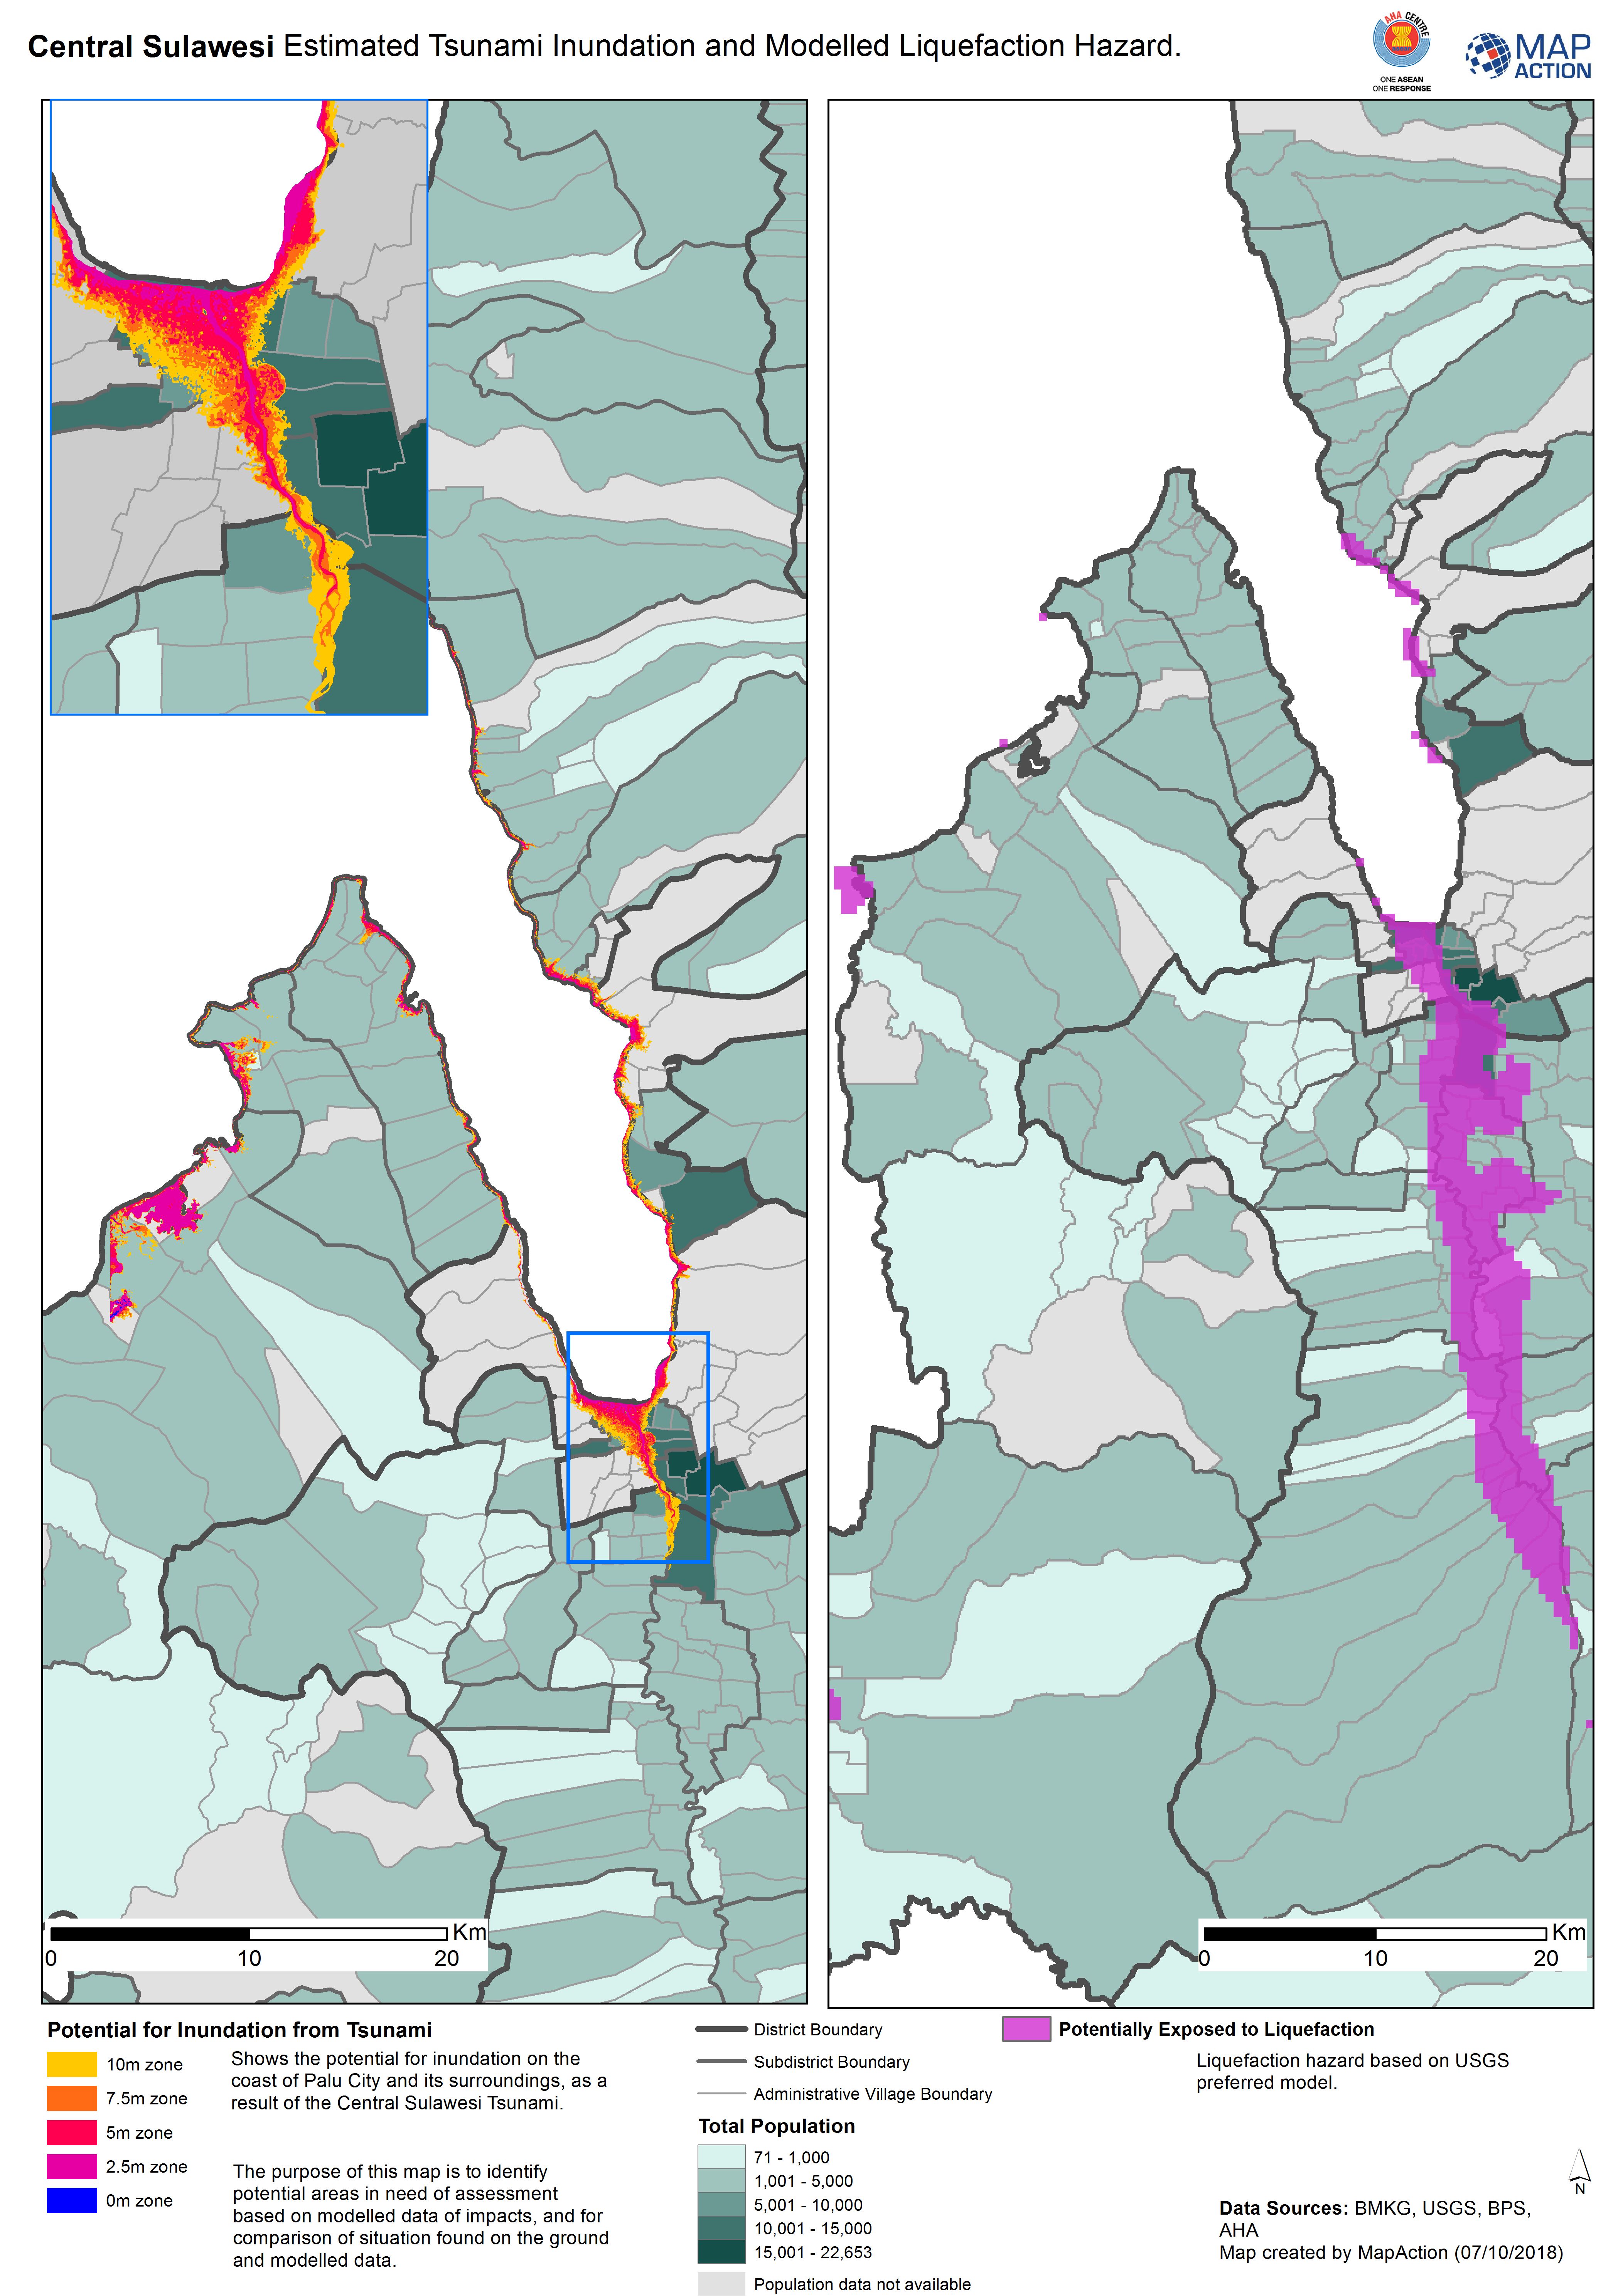
Central Sulawesi Estimated Tsunami Inundation and Modelled Liquefaction Hazard.
Shows the potential for inundation on the coast of Palu City and its surroundings, as a result of the Central Sulawesi Tsunami. The purpose of this map is to identify potential... -
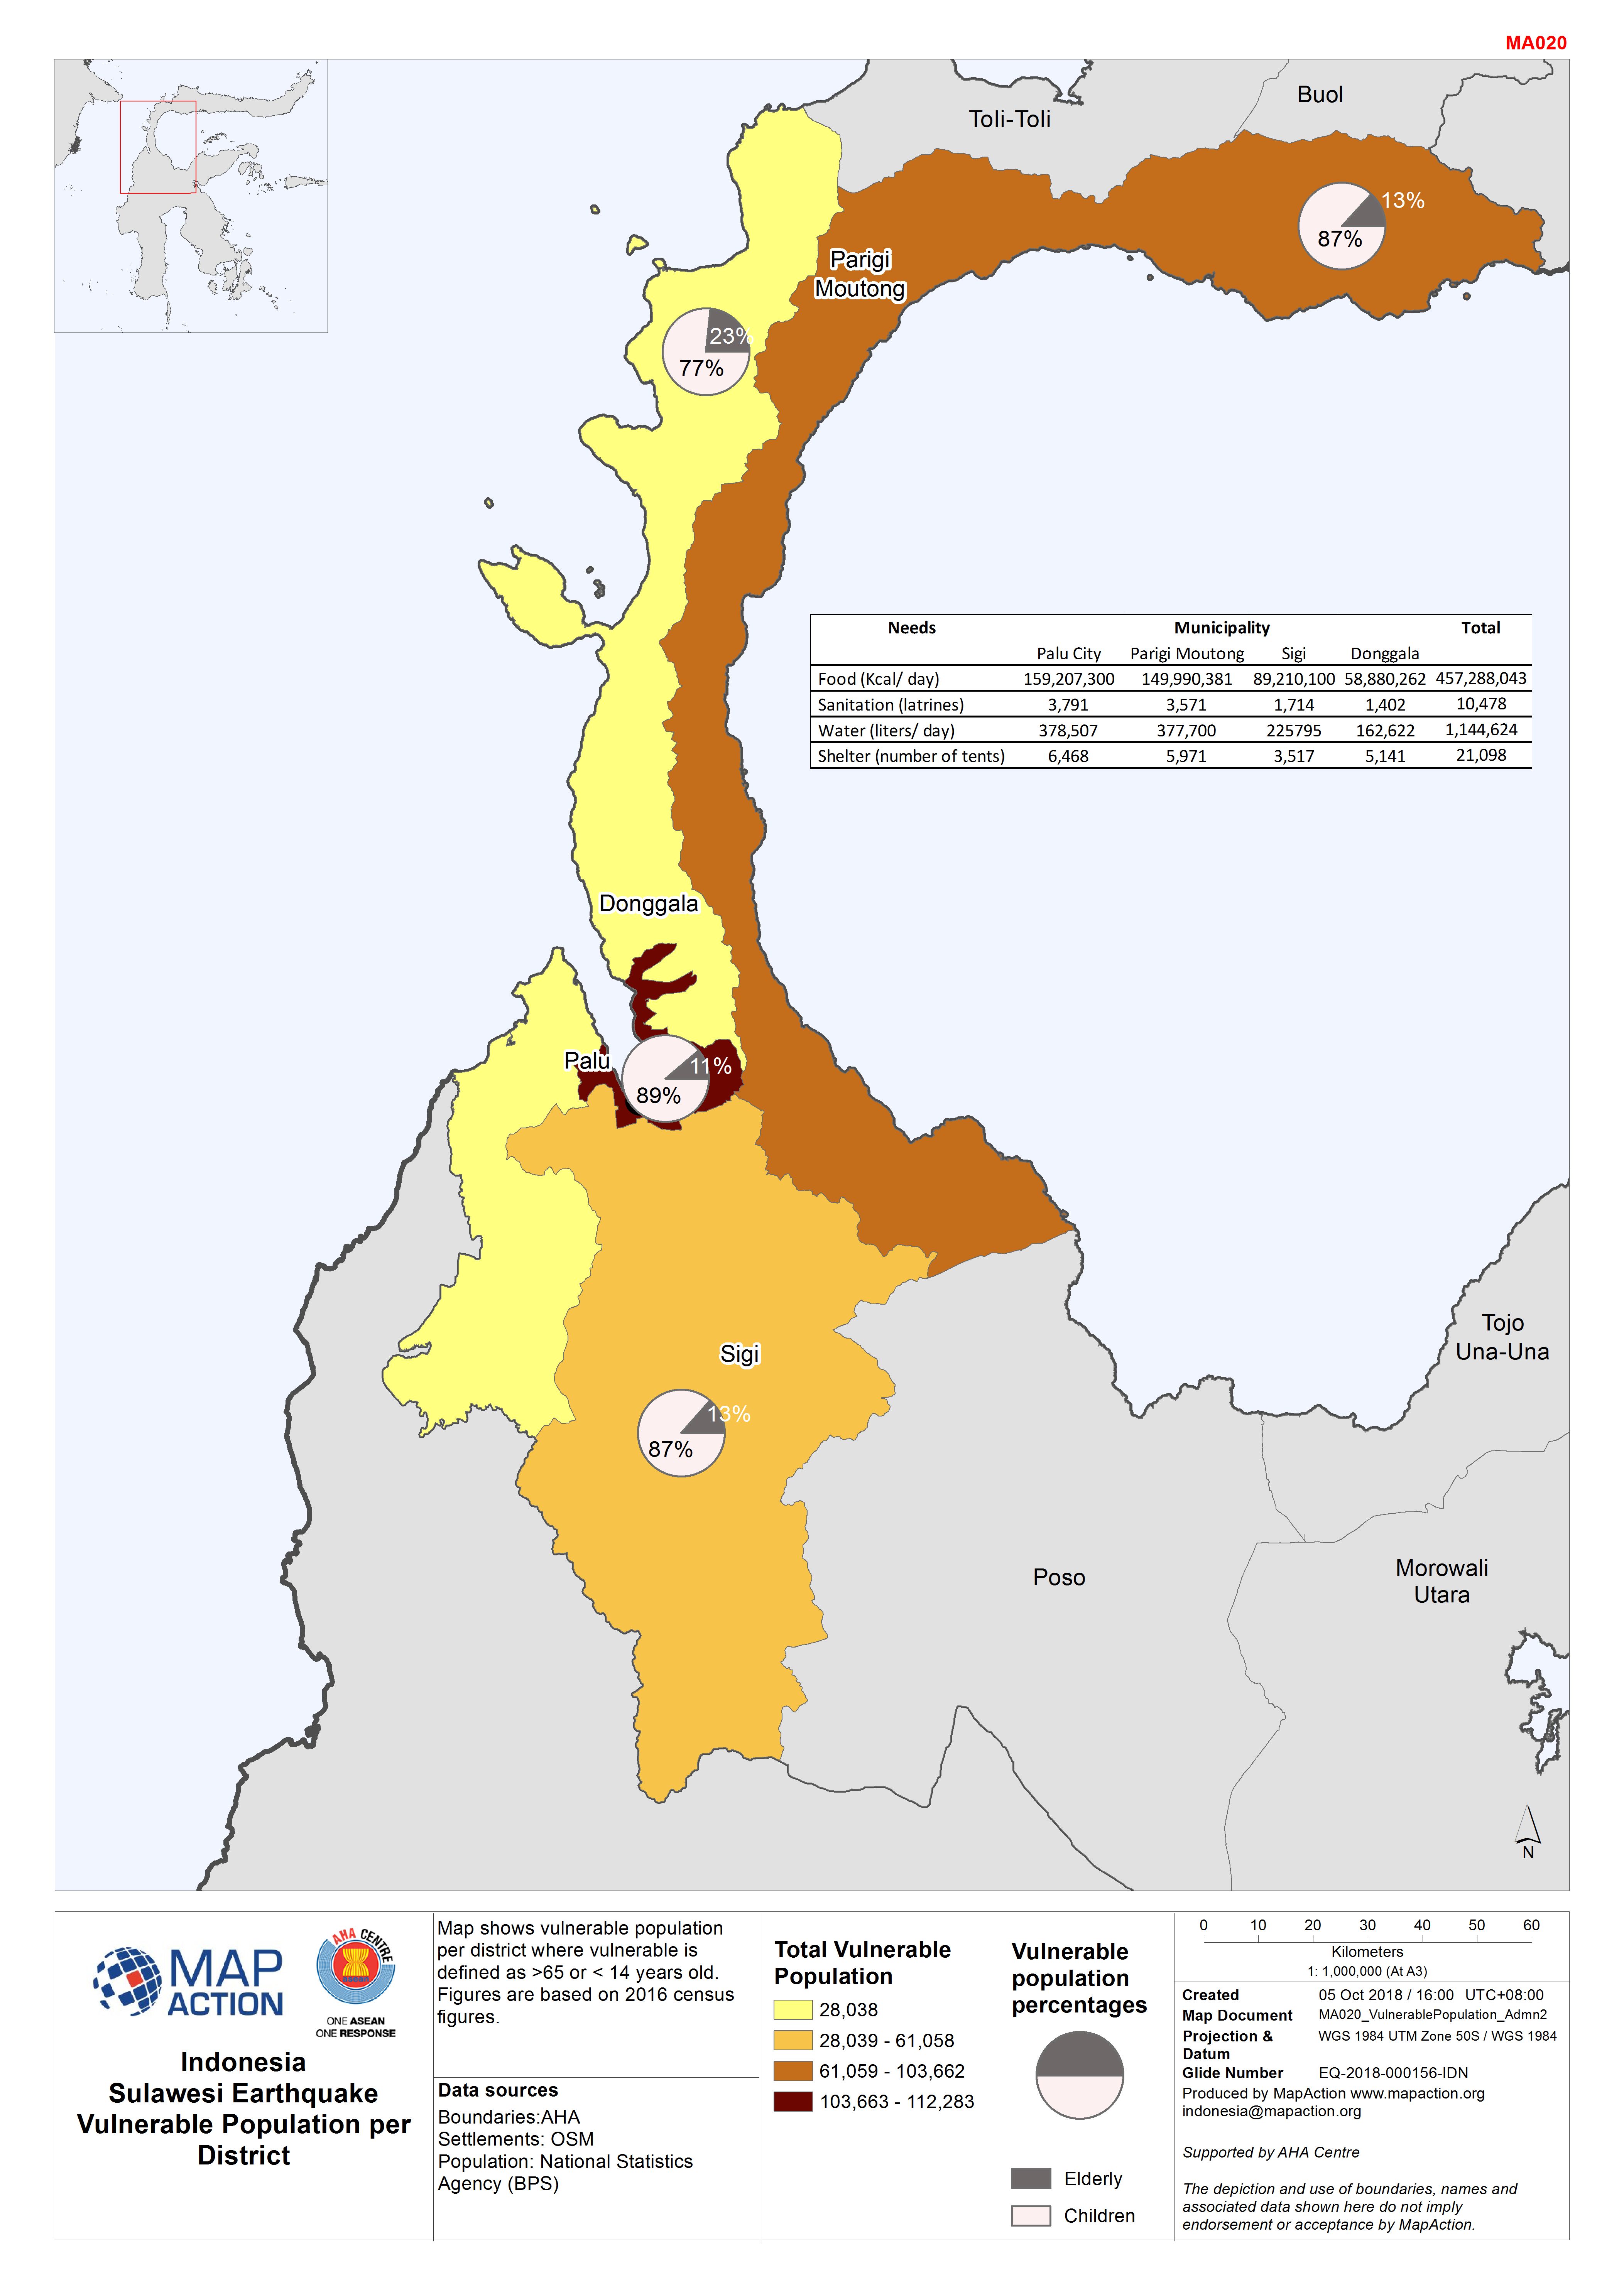
Indonesia Sulawesi Earthquake Vulnerable Population per District
Map shows vulnerable population per district where vulnerable is defined as >65 or < 14 years old. Figures are based on 2016 census figures. -
Indonesia Sulawesi Earthquake Estimated caseload per subdistrict in the Sigi ...
Map shows the 2016 Total Population and number of households per subdistrict (admin level 3) for the Sigi Region of Central Sulawesi. The estimated vulnerable population per...