-
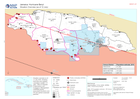
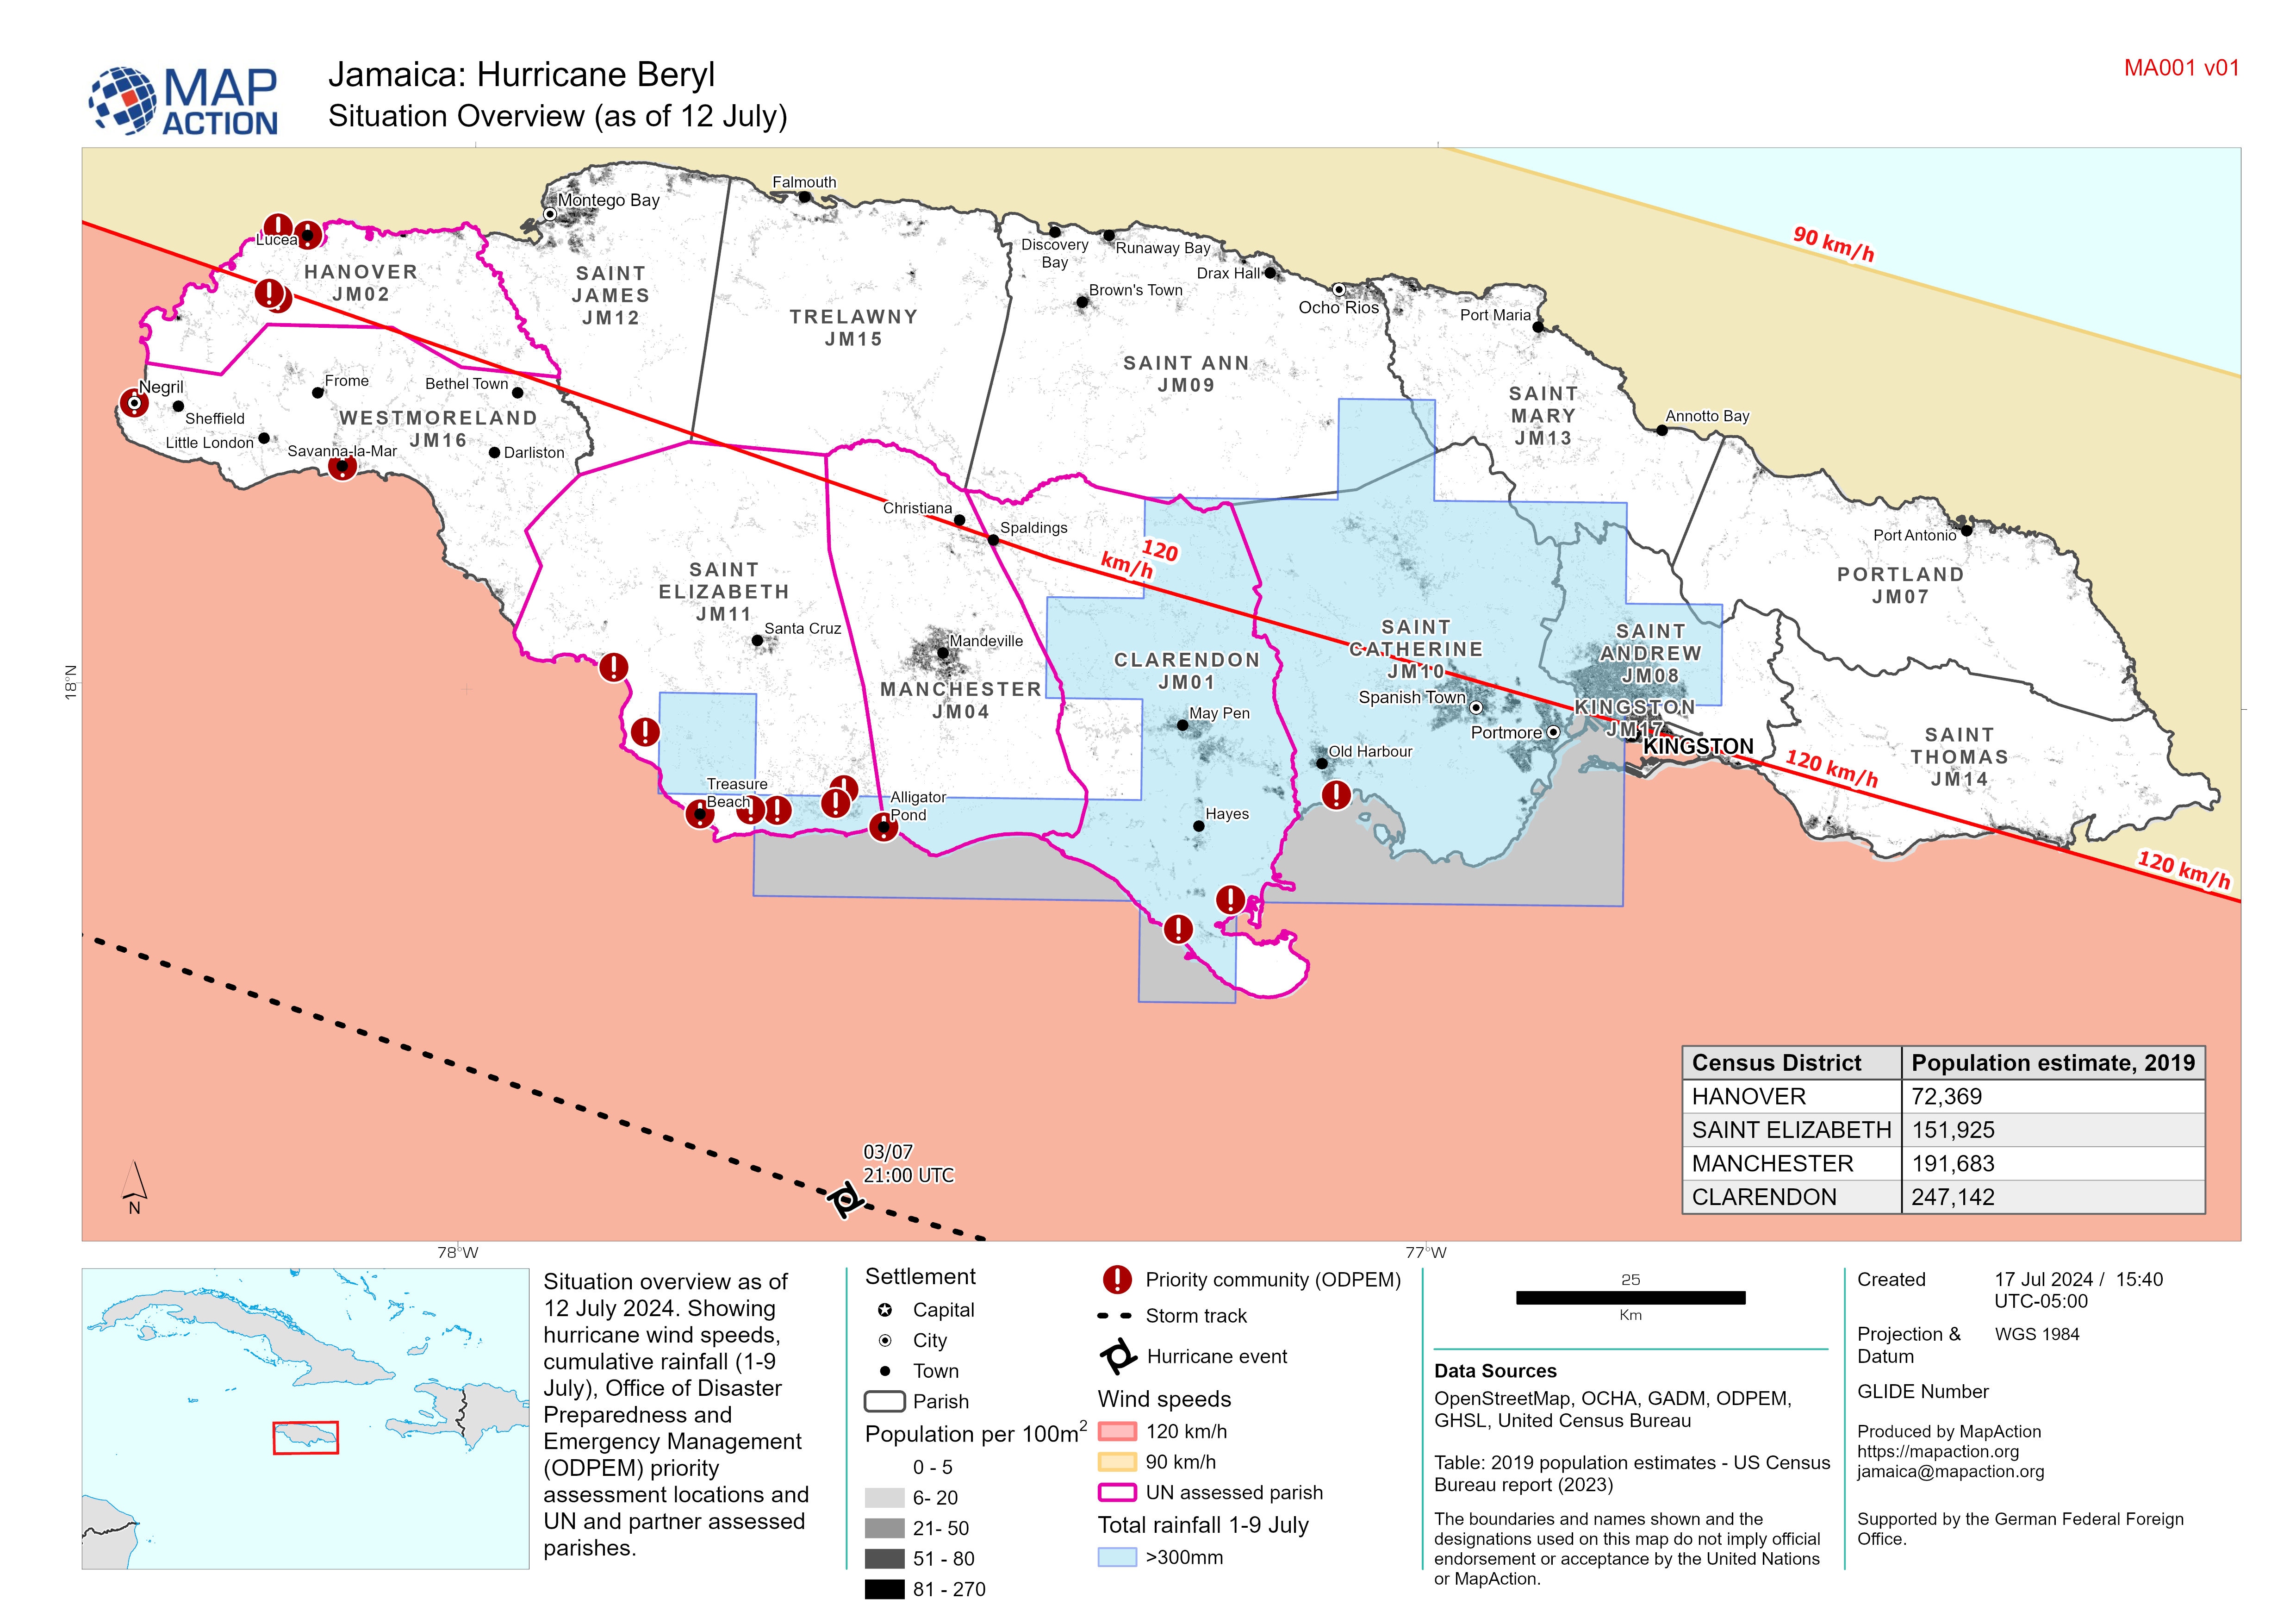
Situation Overview (as of 12 July)
Situation overview as of 12 July 2024. Showing hurricane wind speeds, cumulative rainfall (1-9 July), Office of Disaster Preparedness and Emergency Management (ODPEM) priority... -

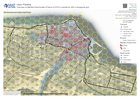
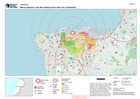
COPERNICUS EMS Building Assessment 5 July - Union Island: Atlas
Overview of Union Island showing damage assessment data sourced from Copernicus EMS, 5 July. -

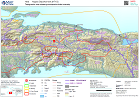
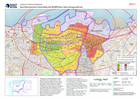
Buildings and Extent of Wildfires within NEMO Area of Focus:
A map showing building footprints and the extent of wildfires derived by the Copernicus Emergency Mapping Service (EMS) and from Sentinel-2 satellite images. Populated areas and... -
Overview of affected Governorate of Derna (LY0101) overlaid by 250 m hexagona...
Overview of affected area overlaid by 250 m diameter hexagonal grid -

Overview of affected governorate of Derna (LY0101)
Overview of affected area showing transport infrastructure and natural features with flood extents -

Precipitación acumulada en los departamentos afectados entre el 28 de marzo y...
Lluvia acumulada en los departamentos afectados entre el 28 de marzo y el 10 de abril de 2023 -

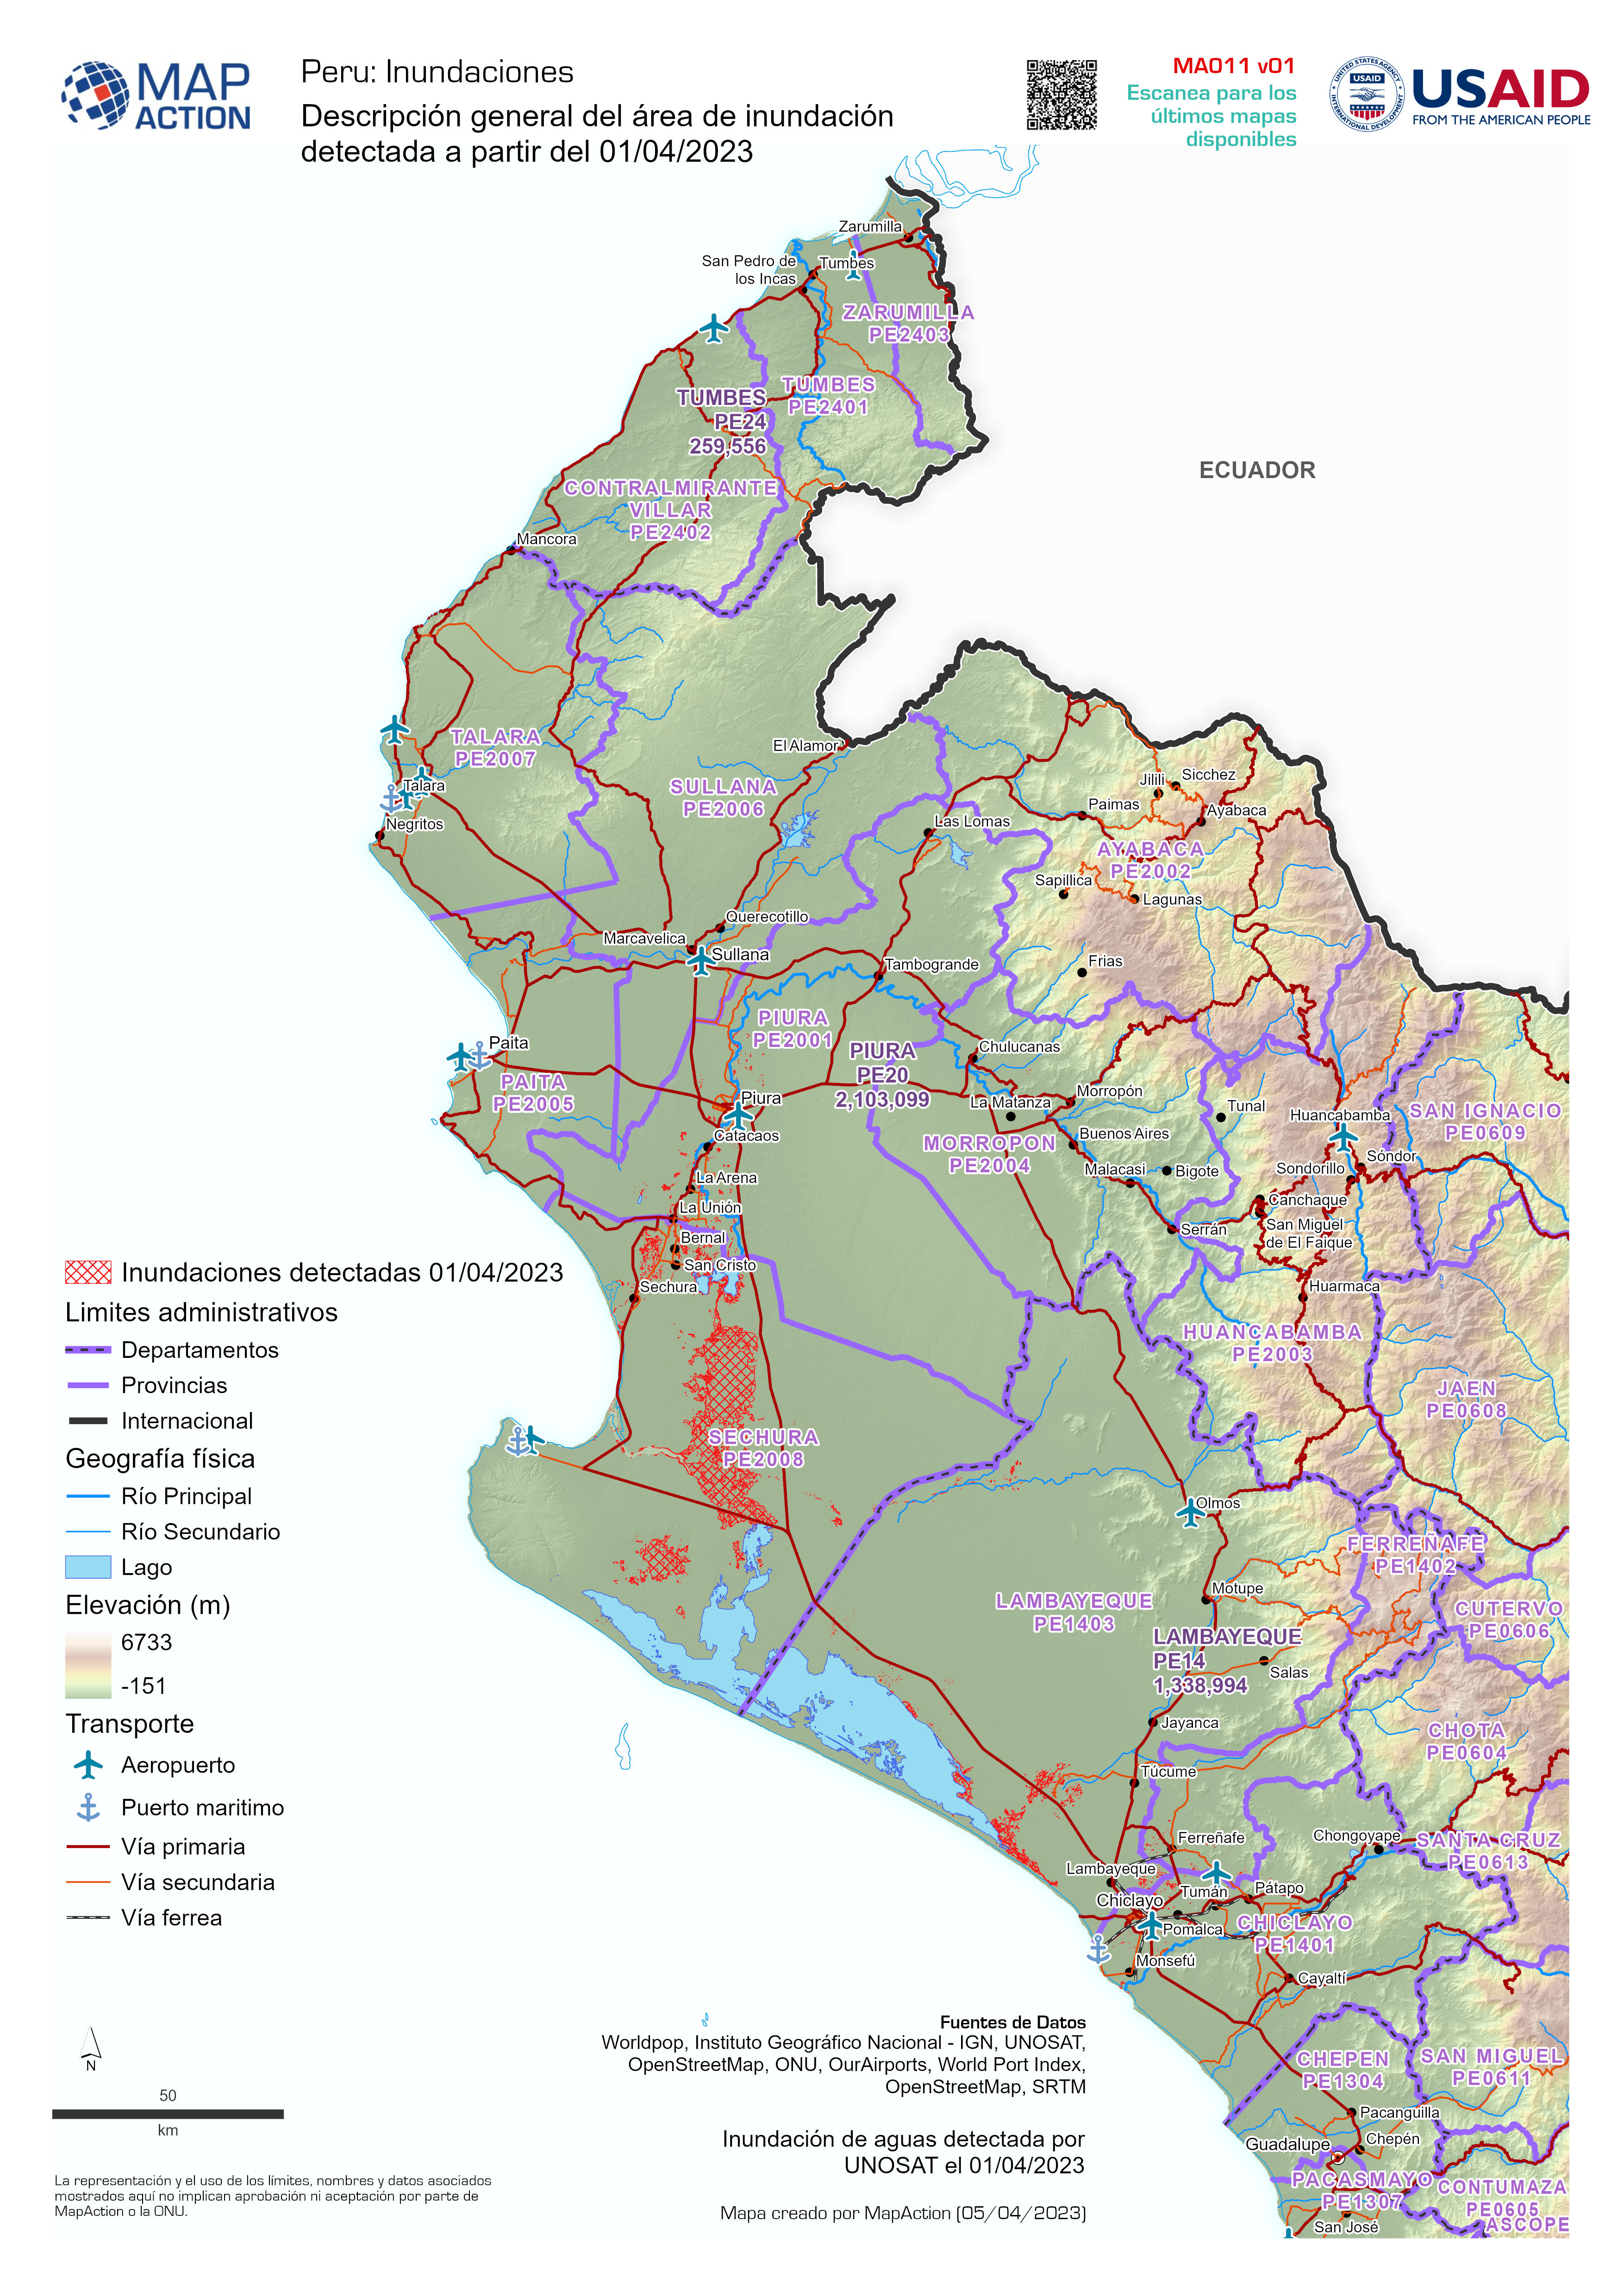
Descripción general del área de inundación detectada a partir del 01/04/2023
Inundación de aguas detectada por UNOSAT el 01/04/2023 -
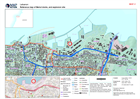
Flooded areas from 15 to 30 August from GFM
Flooded areas from 15 to 30 from GFM show with main cities, roads and railways -

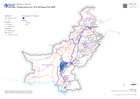
Cumulative rainfall from 1st to 7th February 2022, elevation and rivers
Map shows the 7 day cumulative rainfall, storm track, rivers and elevation during Cyclone Batsirai. -
Topographic map showing earthquake shake intensity
Topographic maps of southern Haiti, with earthquake shake intensity contours -

Topographic map showing earthquake shake intensity
Topographic map of Grande 'Anse, Nippes and South Départements, with earthquake shake intensity contours -

Topographic map showing earthquake shake intensity
Topographic map by Département, with earthquake shake intensity contours -

Nicaragua: Potential storm track, elevation and municipalities: 4 Nov 2020, 0...
This map shows the Hurricane Eta affected administration level 2 municipalities for Nicaragua with predicted wind speed cones, aganst elevation data and settlement locations. -

Nicaragua: Potential storm track, elevation and municipalities: 3 Nov 2020, ...
This map shows the affected administration level 2 municipalities for Nicaragua, with population estimates and predicted wind speed cones. -
Zone Socio-economic Vulnerability with ACAPS blast radius damage estimate
The socio-economic status of households living pre-blast in each zone was estimated by UN-Habitat based on (1) a national ranking of 498 disadvantaged area undertaken to inform... -
Beirut explosion site with infrastructure sites and vulnerability
Beirut explosion site with infrastructure sites and vulnerability. -
Reference map of Beirut docks, and explosion site
Reference map of Beirut docks, and explosion site -

Migration Crisis - Reference map of most affected sub-districts
This is a reference map showing major roads and towns, as well as elevation data (30m SRTM) for select districts in the North West of the Syrian Arab Republic. Affected...

