-

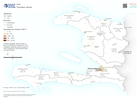
Baseline population
Population density shown based on Worldpop estimates for 2020. Population totals in table and labels are based on data from Seychelles National Bureau of Statistics for each... -

-

Population Density for Affected Provinces
Morocco population density for affected provinces at 1 km2 spatial distribution from 2020 WorldPop data. Tabular population data at province level supplied by Haut Commissaire... -

-

Flood Extents (As of 02 Dec 2023) and Baseline Population
Table shows estimated baseline population in 2022 for affected regions in South Somalia. Population distribution shown on map is based on Worldpop estimate for 2020. Flood... -

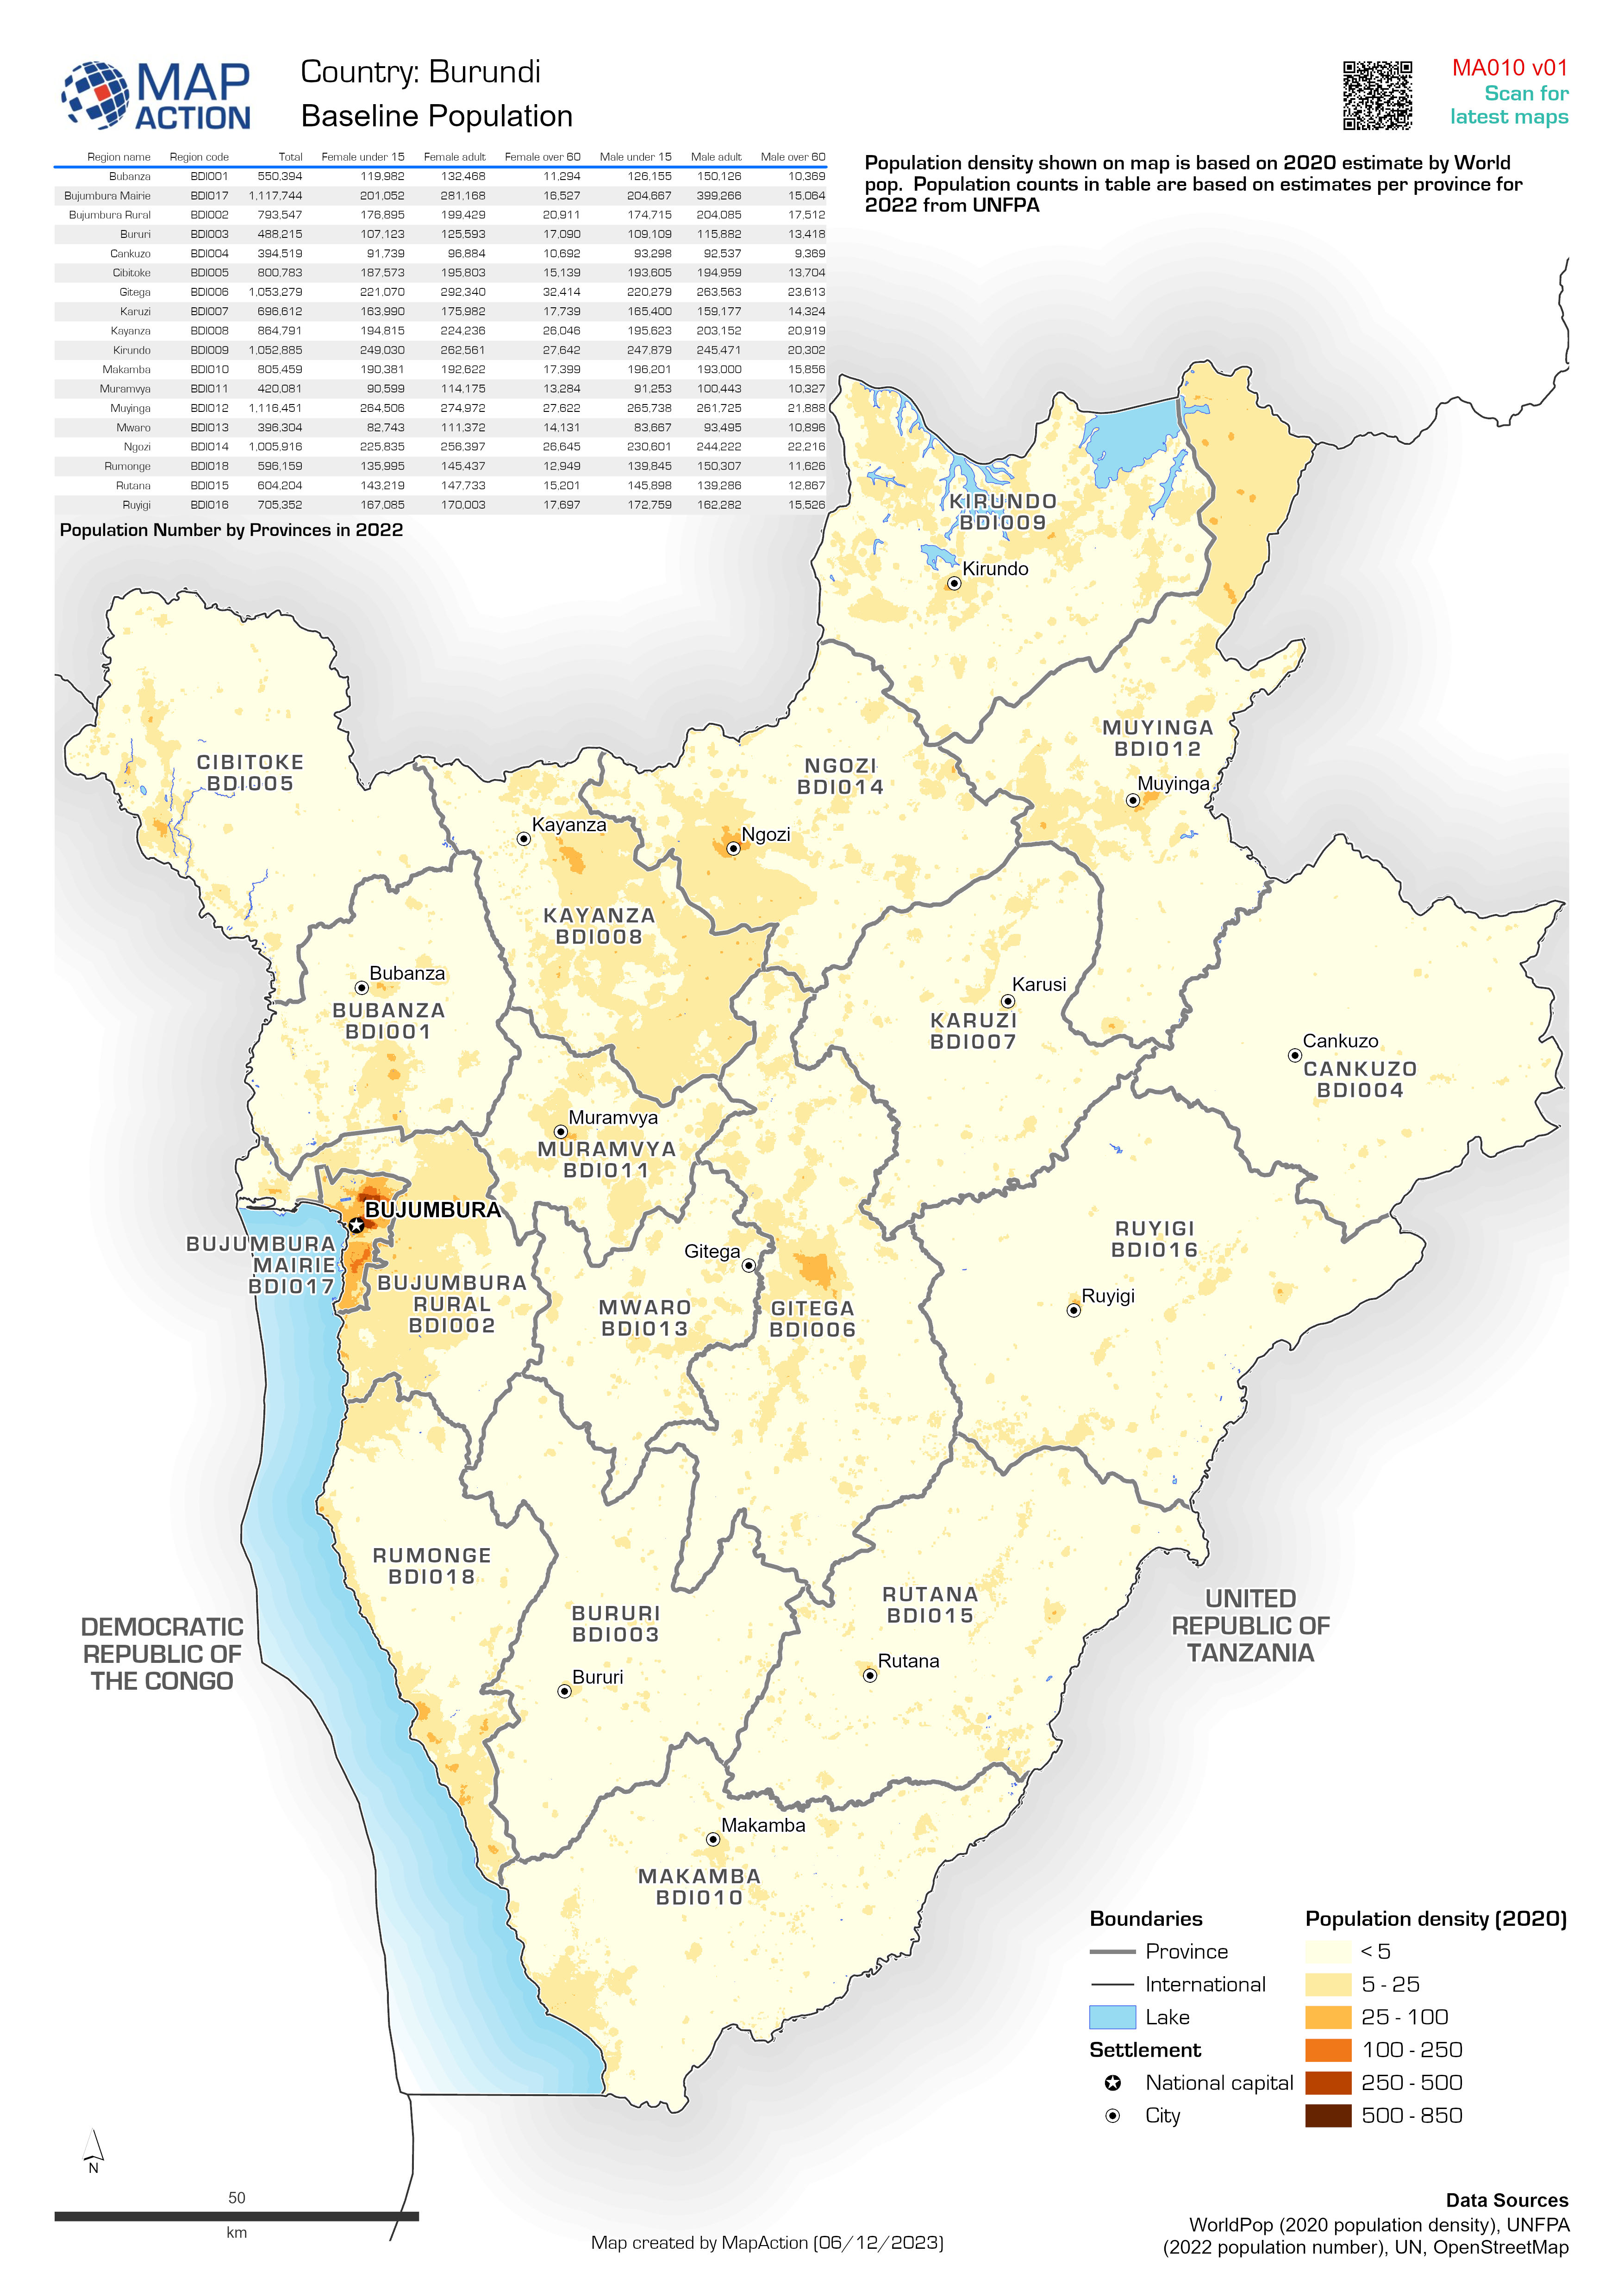
Baseline population
Population density shown on the map is based on 2020 estimates by Worldpop. Counts in table are based on estimates for 2023 by the Philippines Statistics Authority (PSA) -

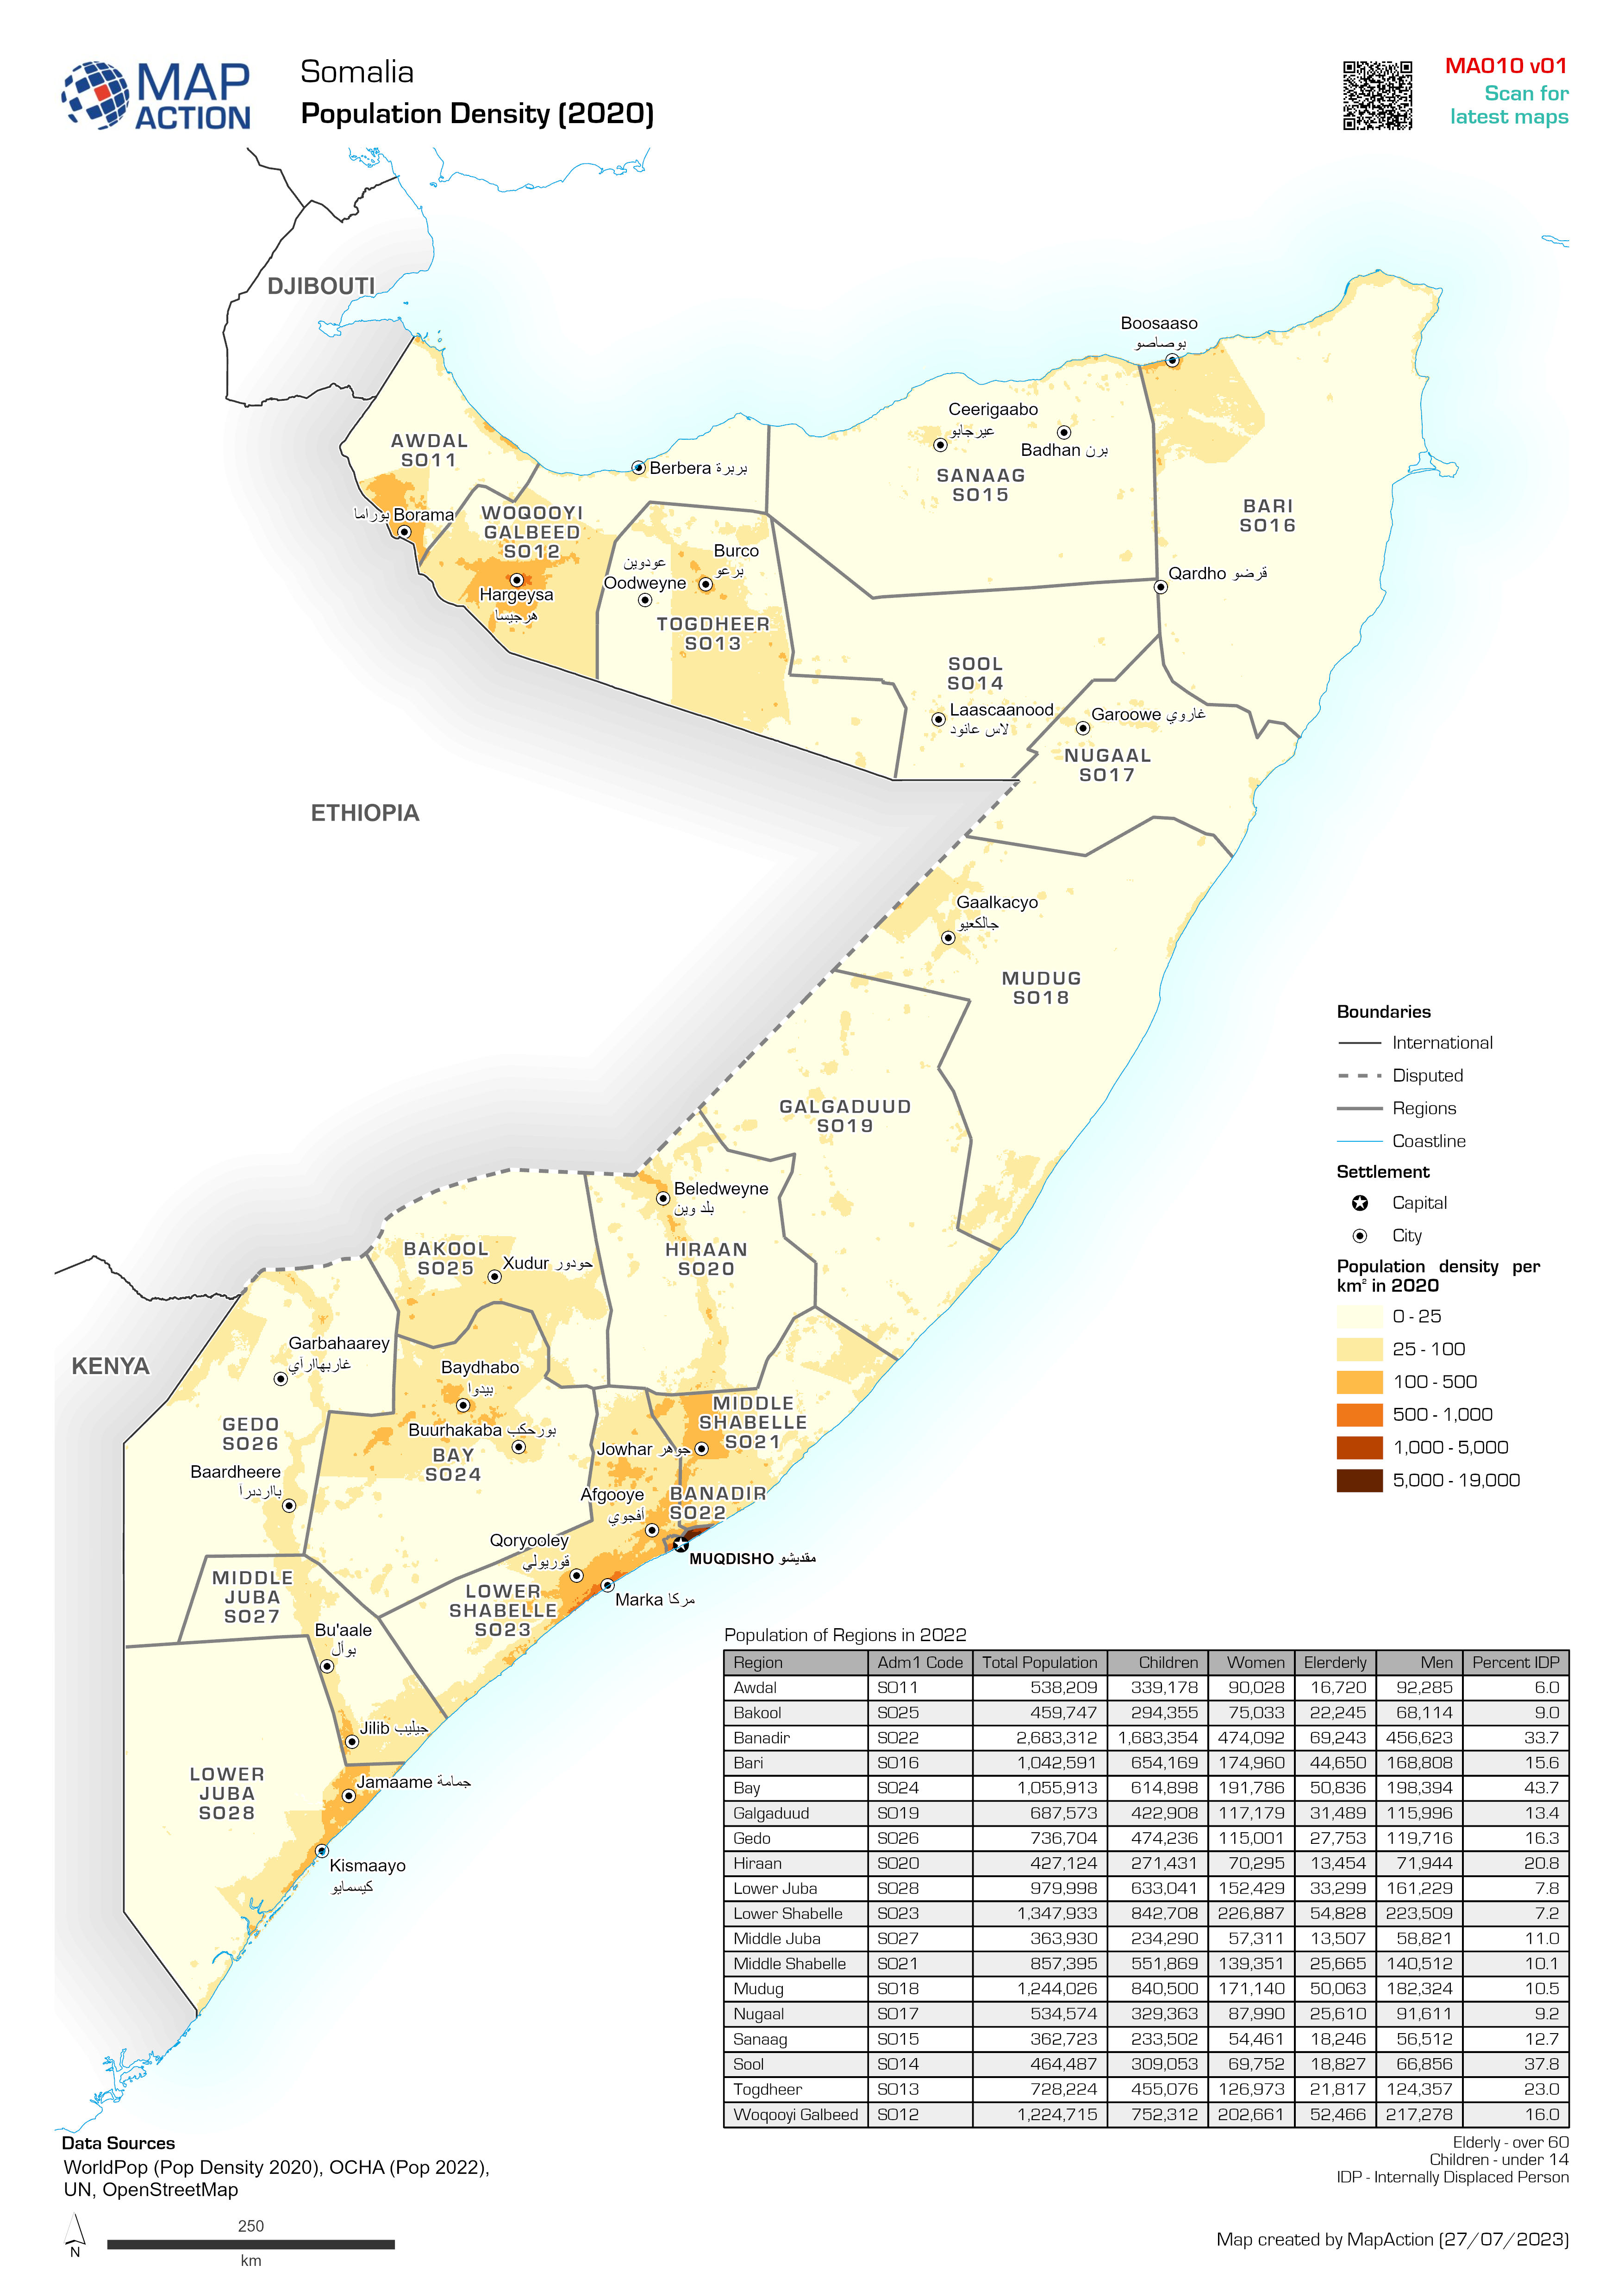
Population Density
Table shows estimated baseline population in 2022 for each Region. Population distribution shown on map is based on Worldpop estimate for 2020. -

Baseline population for affected area
Baseline population for the area of Ghana affected by flooding. Image of population density based on Worldpop estimates for 2020. Population totals labelled were published by... -

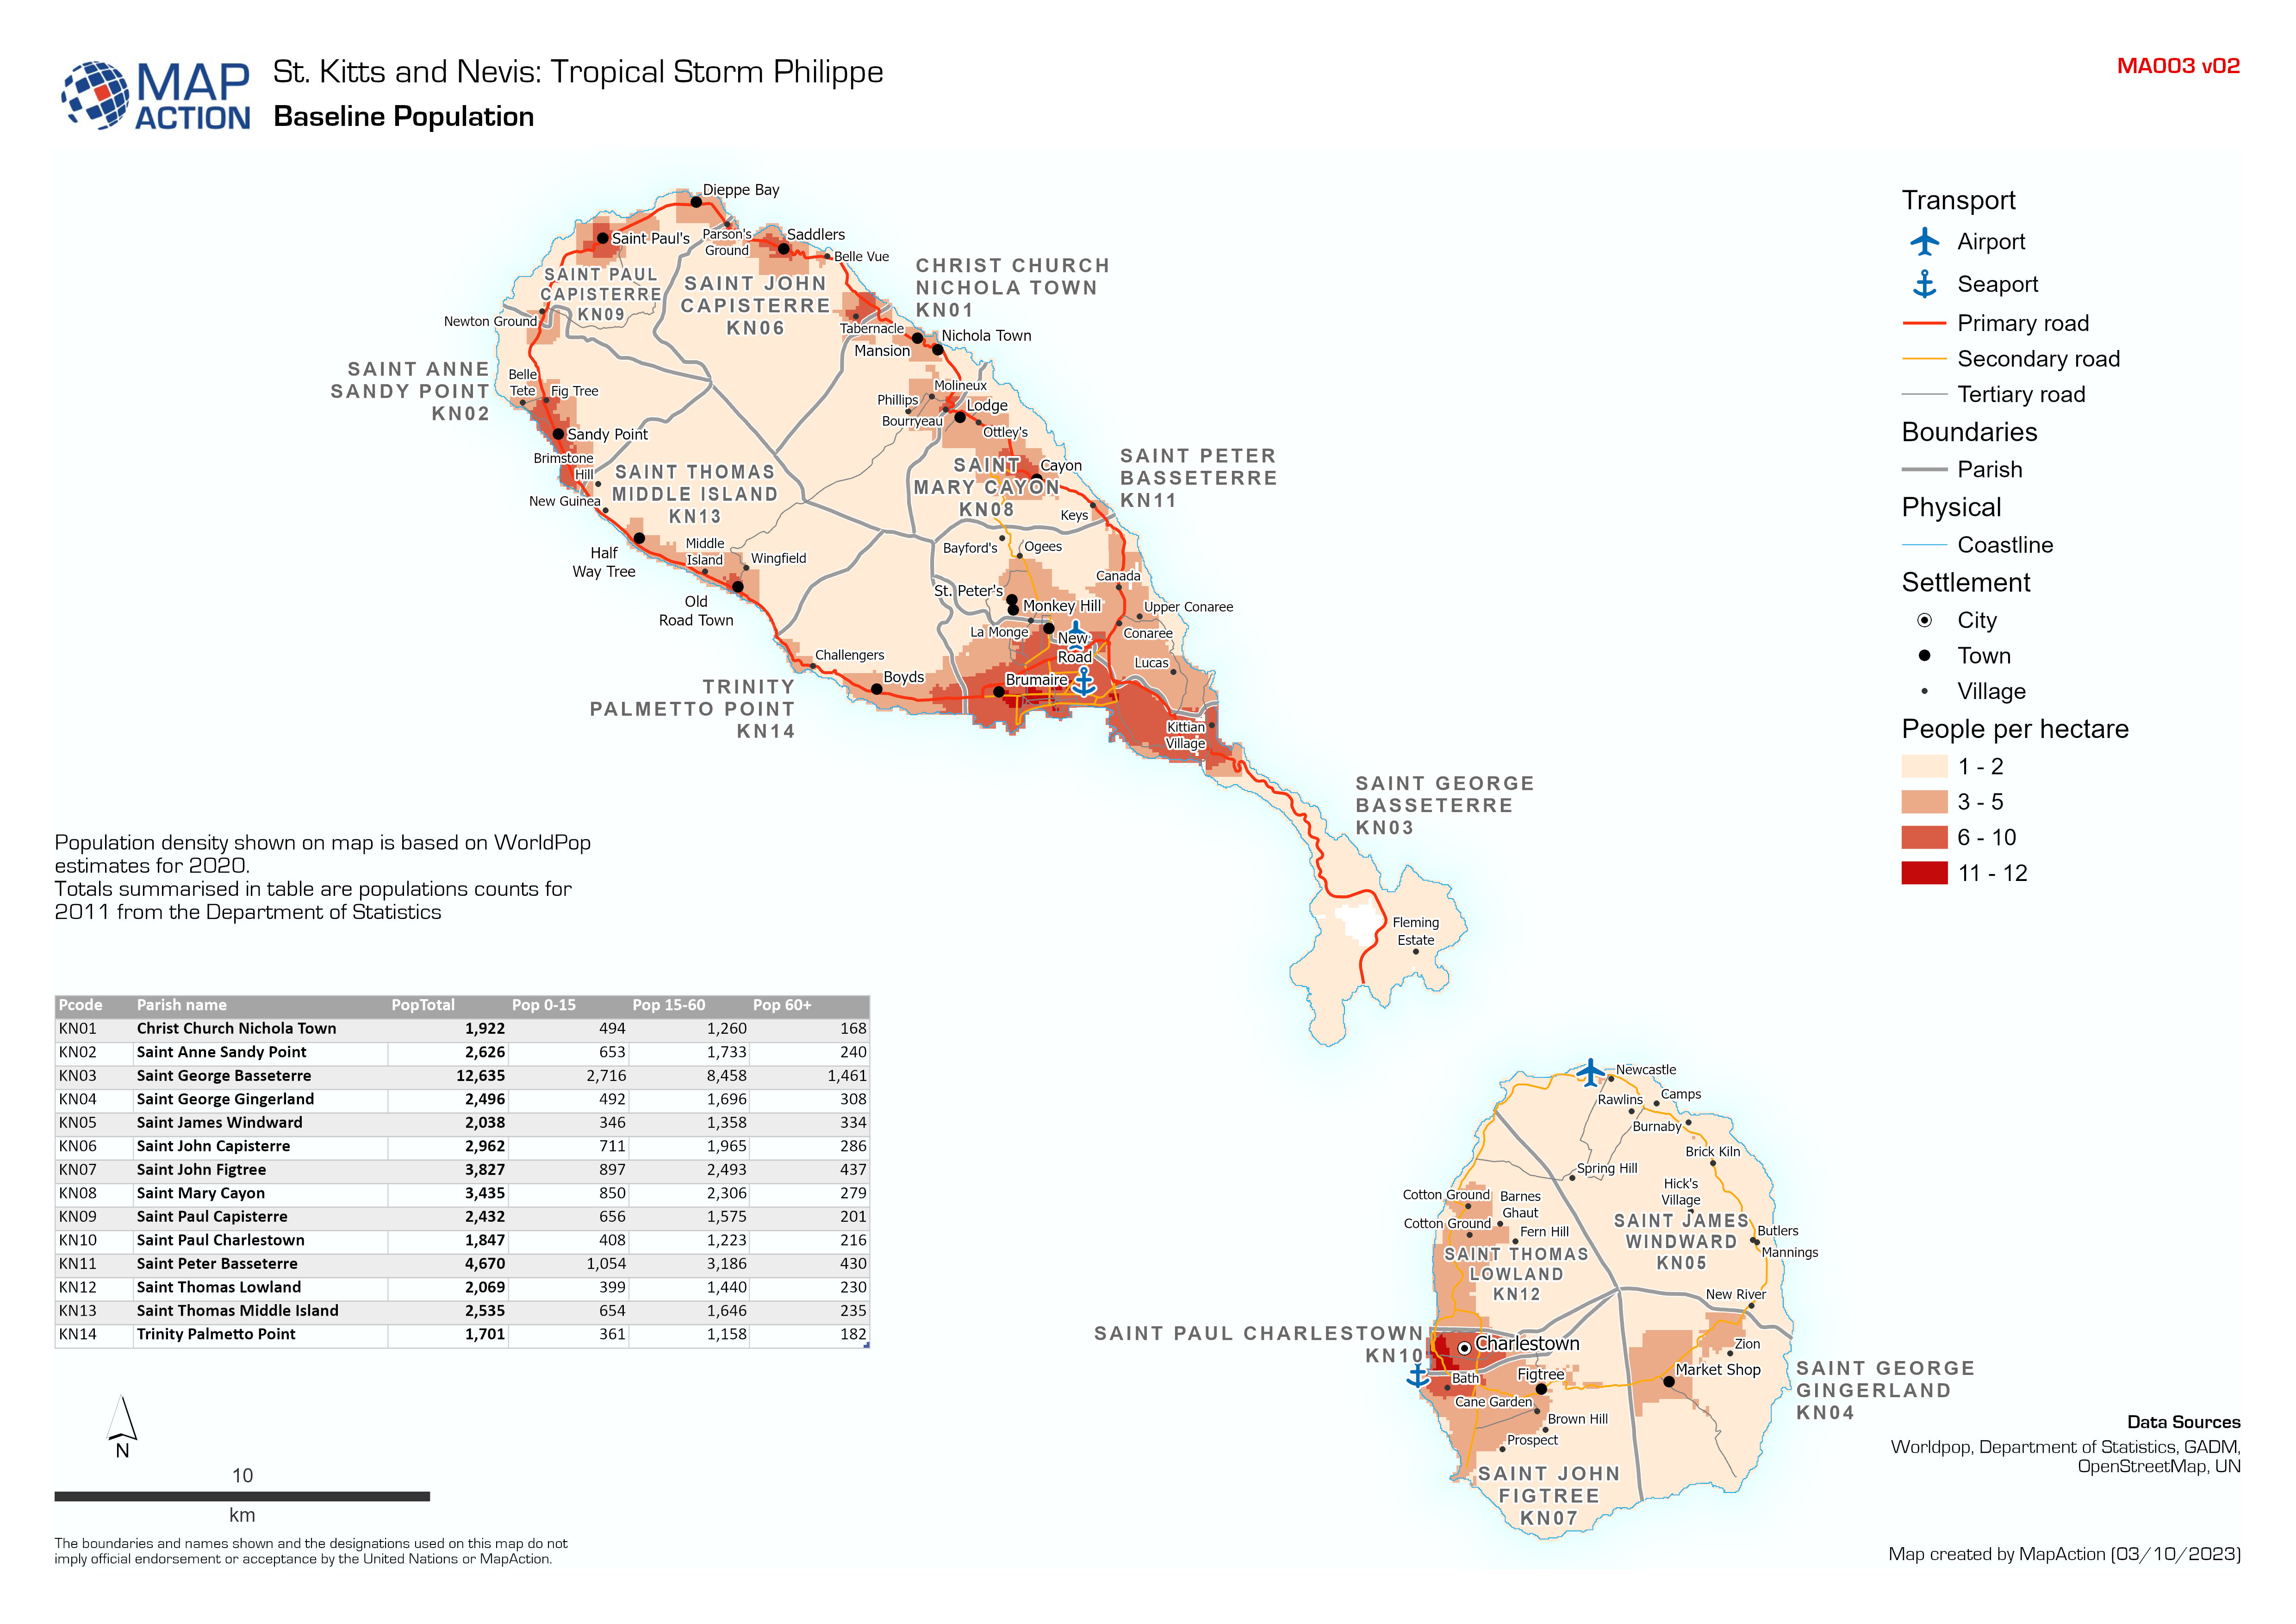
Baseline Population
Population density shown on map is based on WorldPop estimates for 2020. Totals summarised in table are populations counts for 2011 from the Department of Statistics -

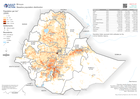
Population Density (2020)
Country overview showing estimated population in 2022 for each district and summary statistics for each Region, including SADD breakdown. -
Population density
Gridded population density shown is based on Worldpop estimates for 2020. Population totals per province based on 2022 estimates by UNOCHA are listed in province labels -

Population Density
The map shows the spatial distribution of population density in 2020 from WorldPop. The data is based on country totals adjusted to match the corresponding UNPD estimates.... -
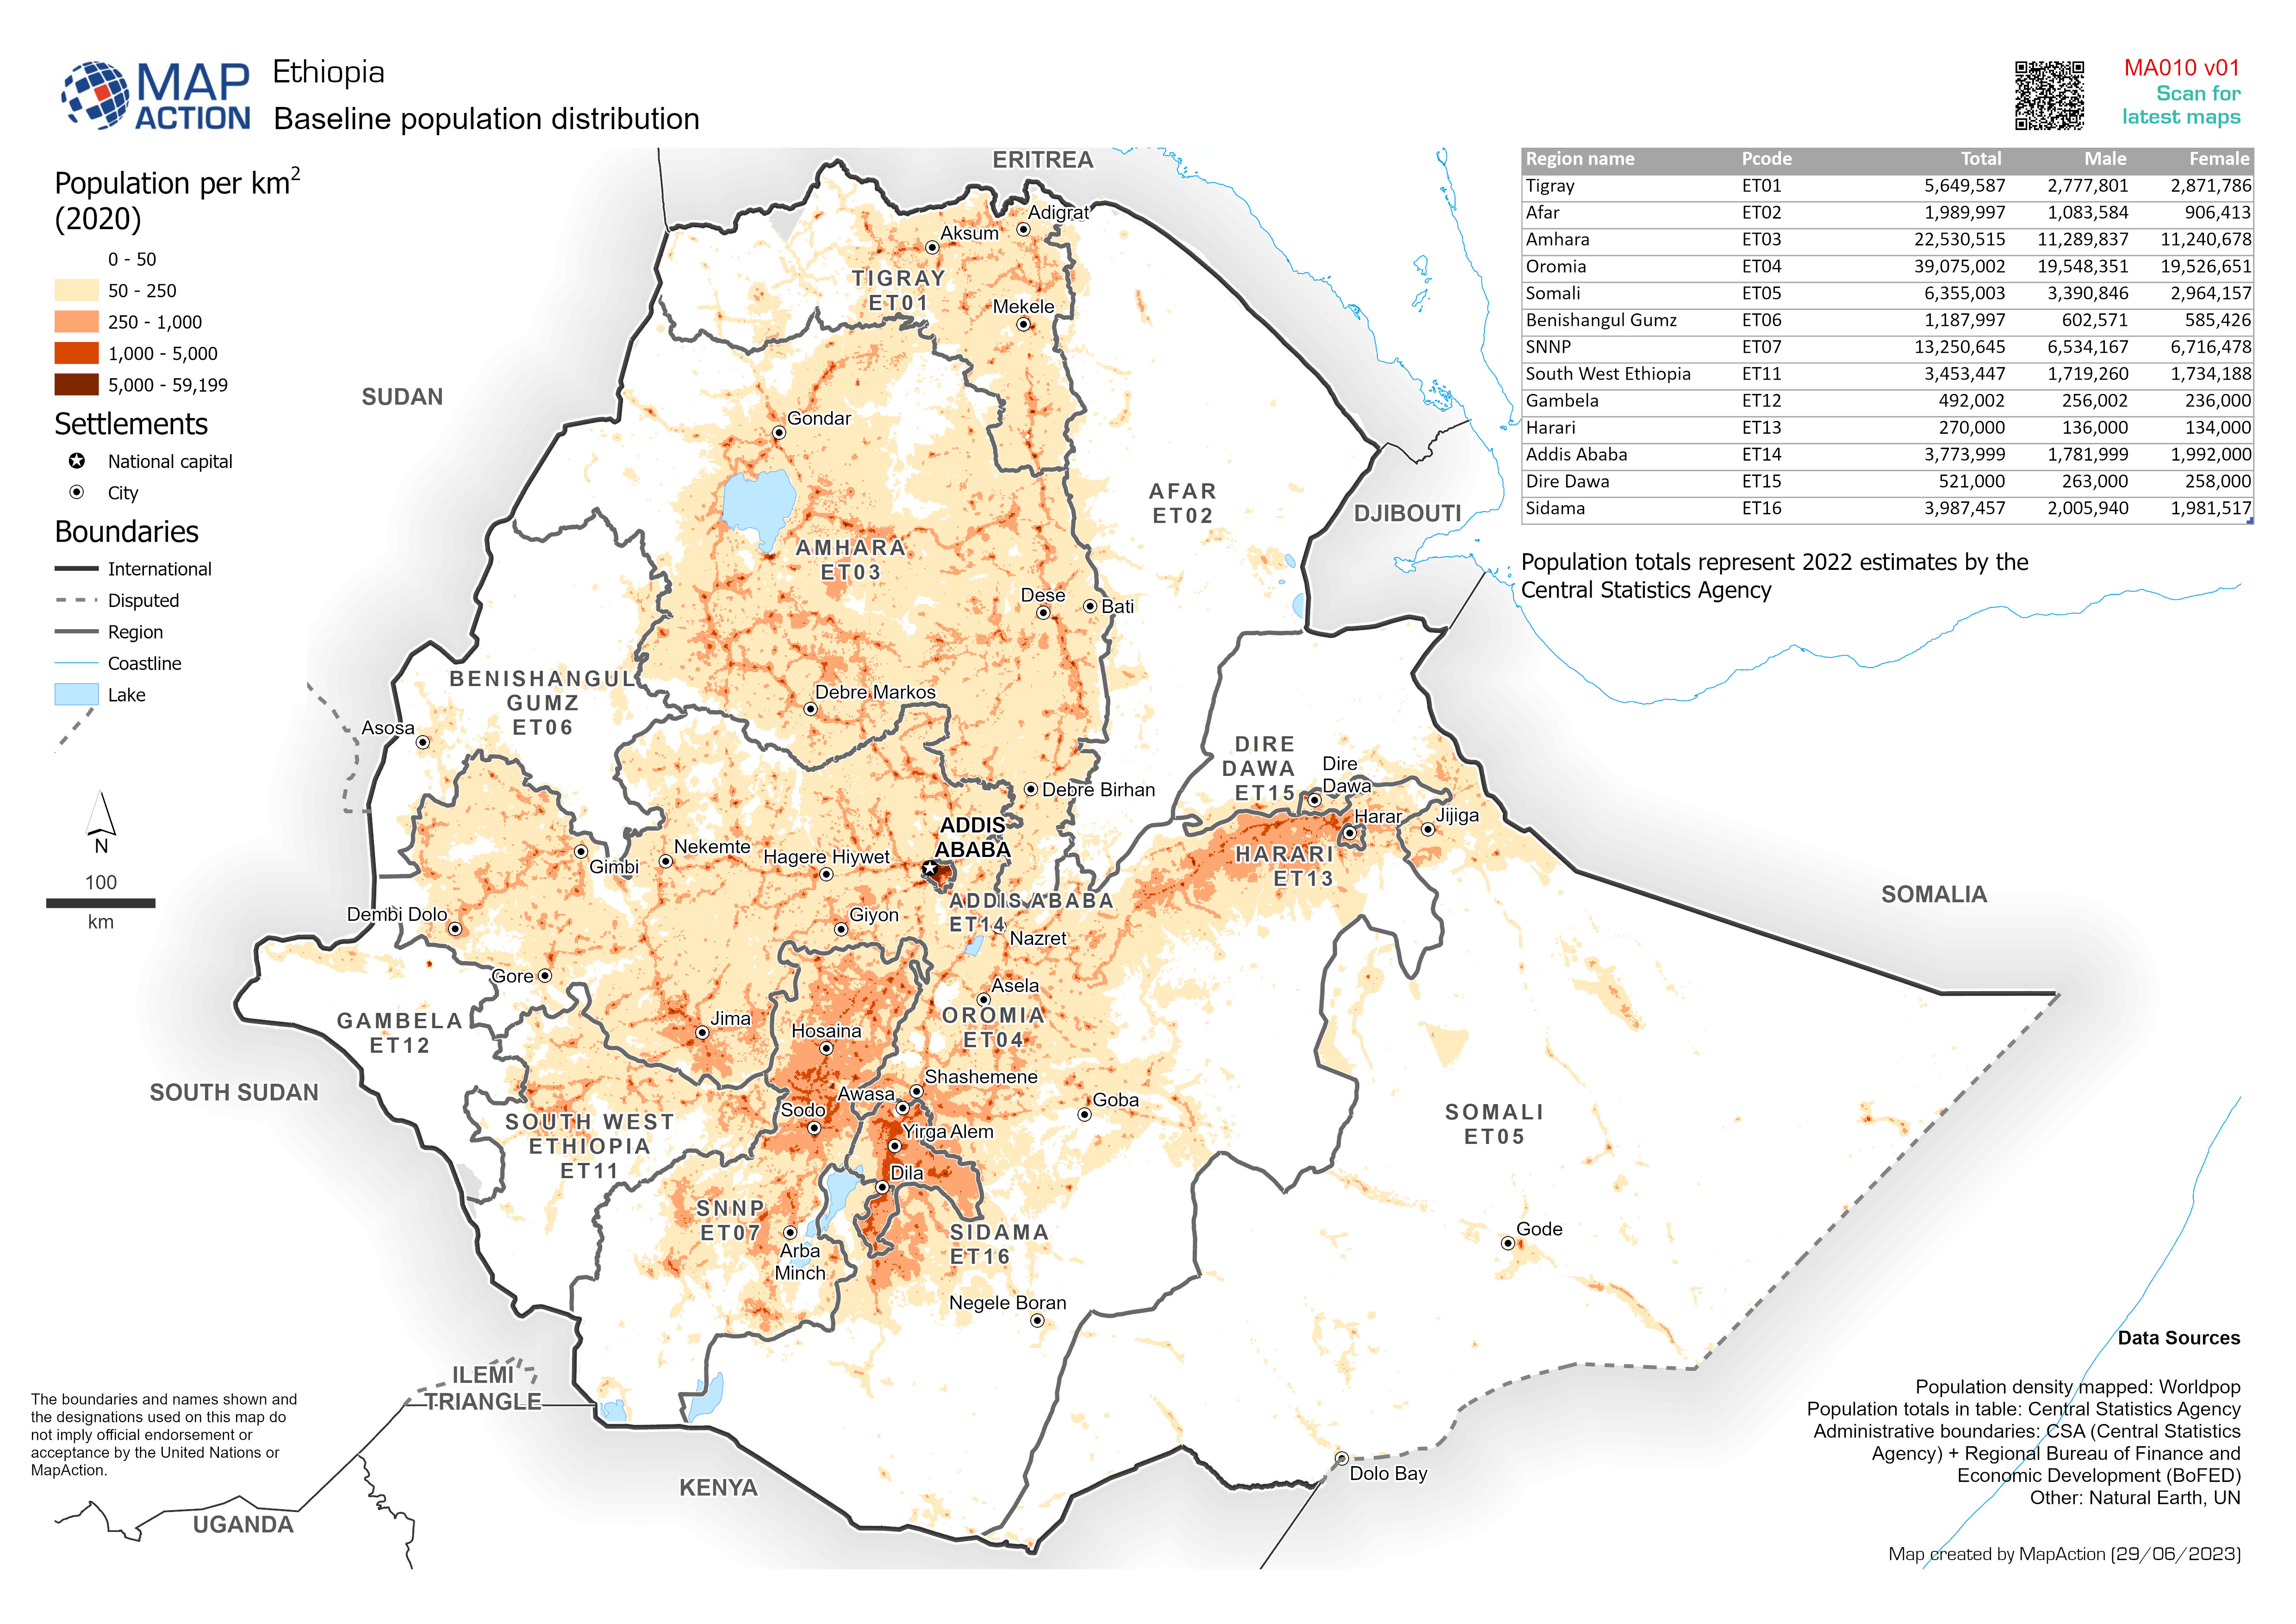
Baseline population distribution
Baseline population. Population density shown is Worldpop estimate for 2020. Population totals represent 2022 estimates by the Central Statistics Agency -

Baseline population estimates
Tables and graphs based upon population data for 2019 from Pakistan Bureau of Statistics. Population density shown on map is based on Worldpop estimate for 2020 -

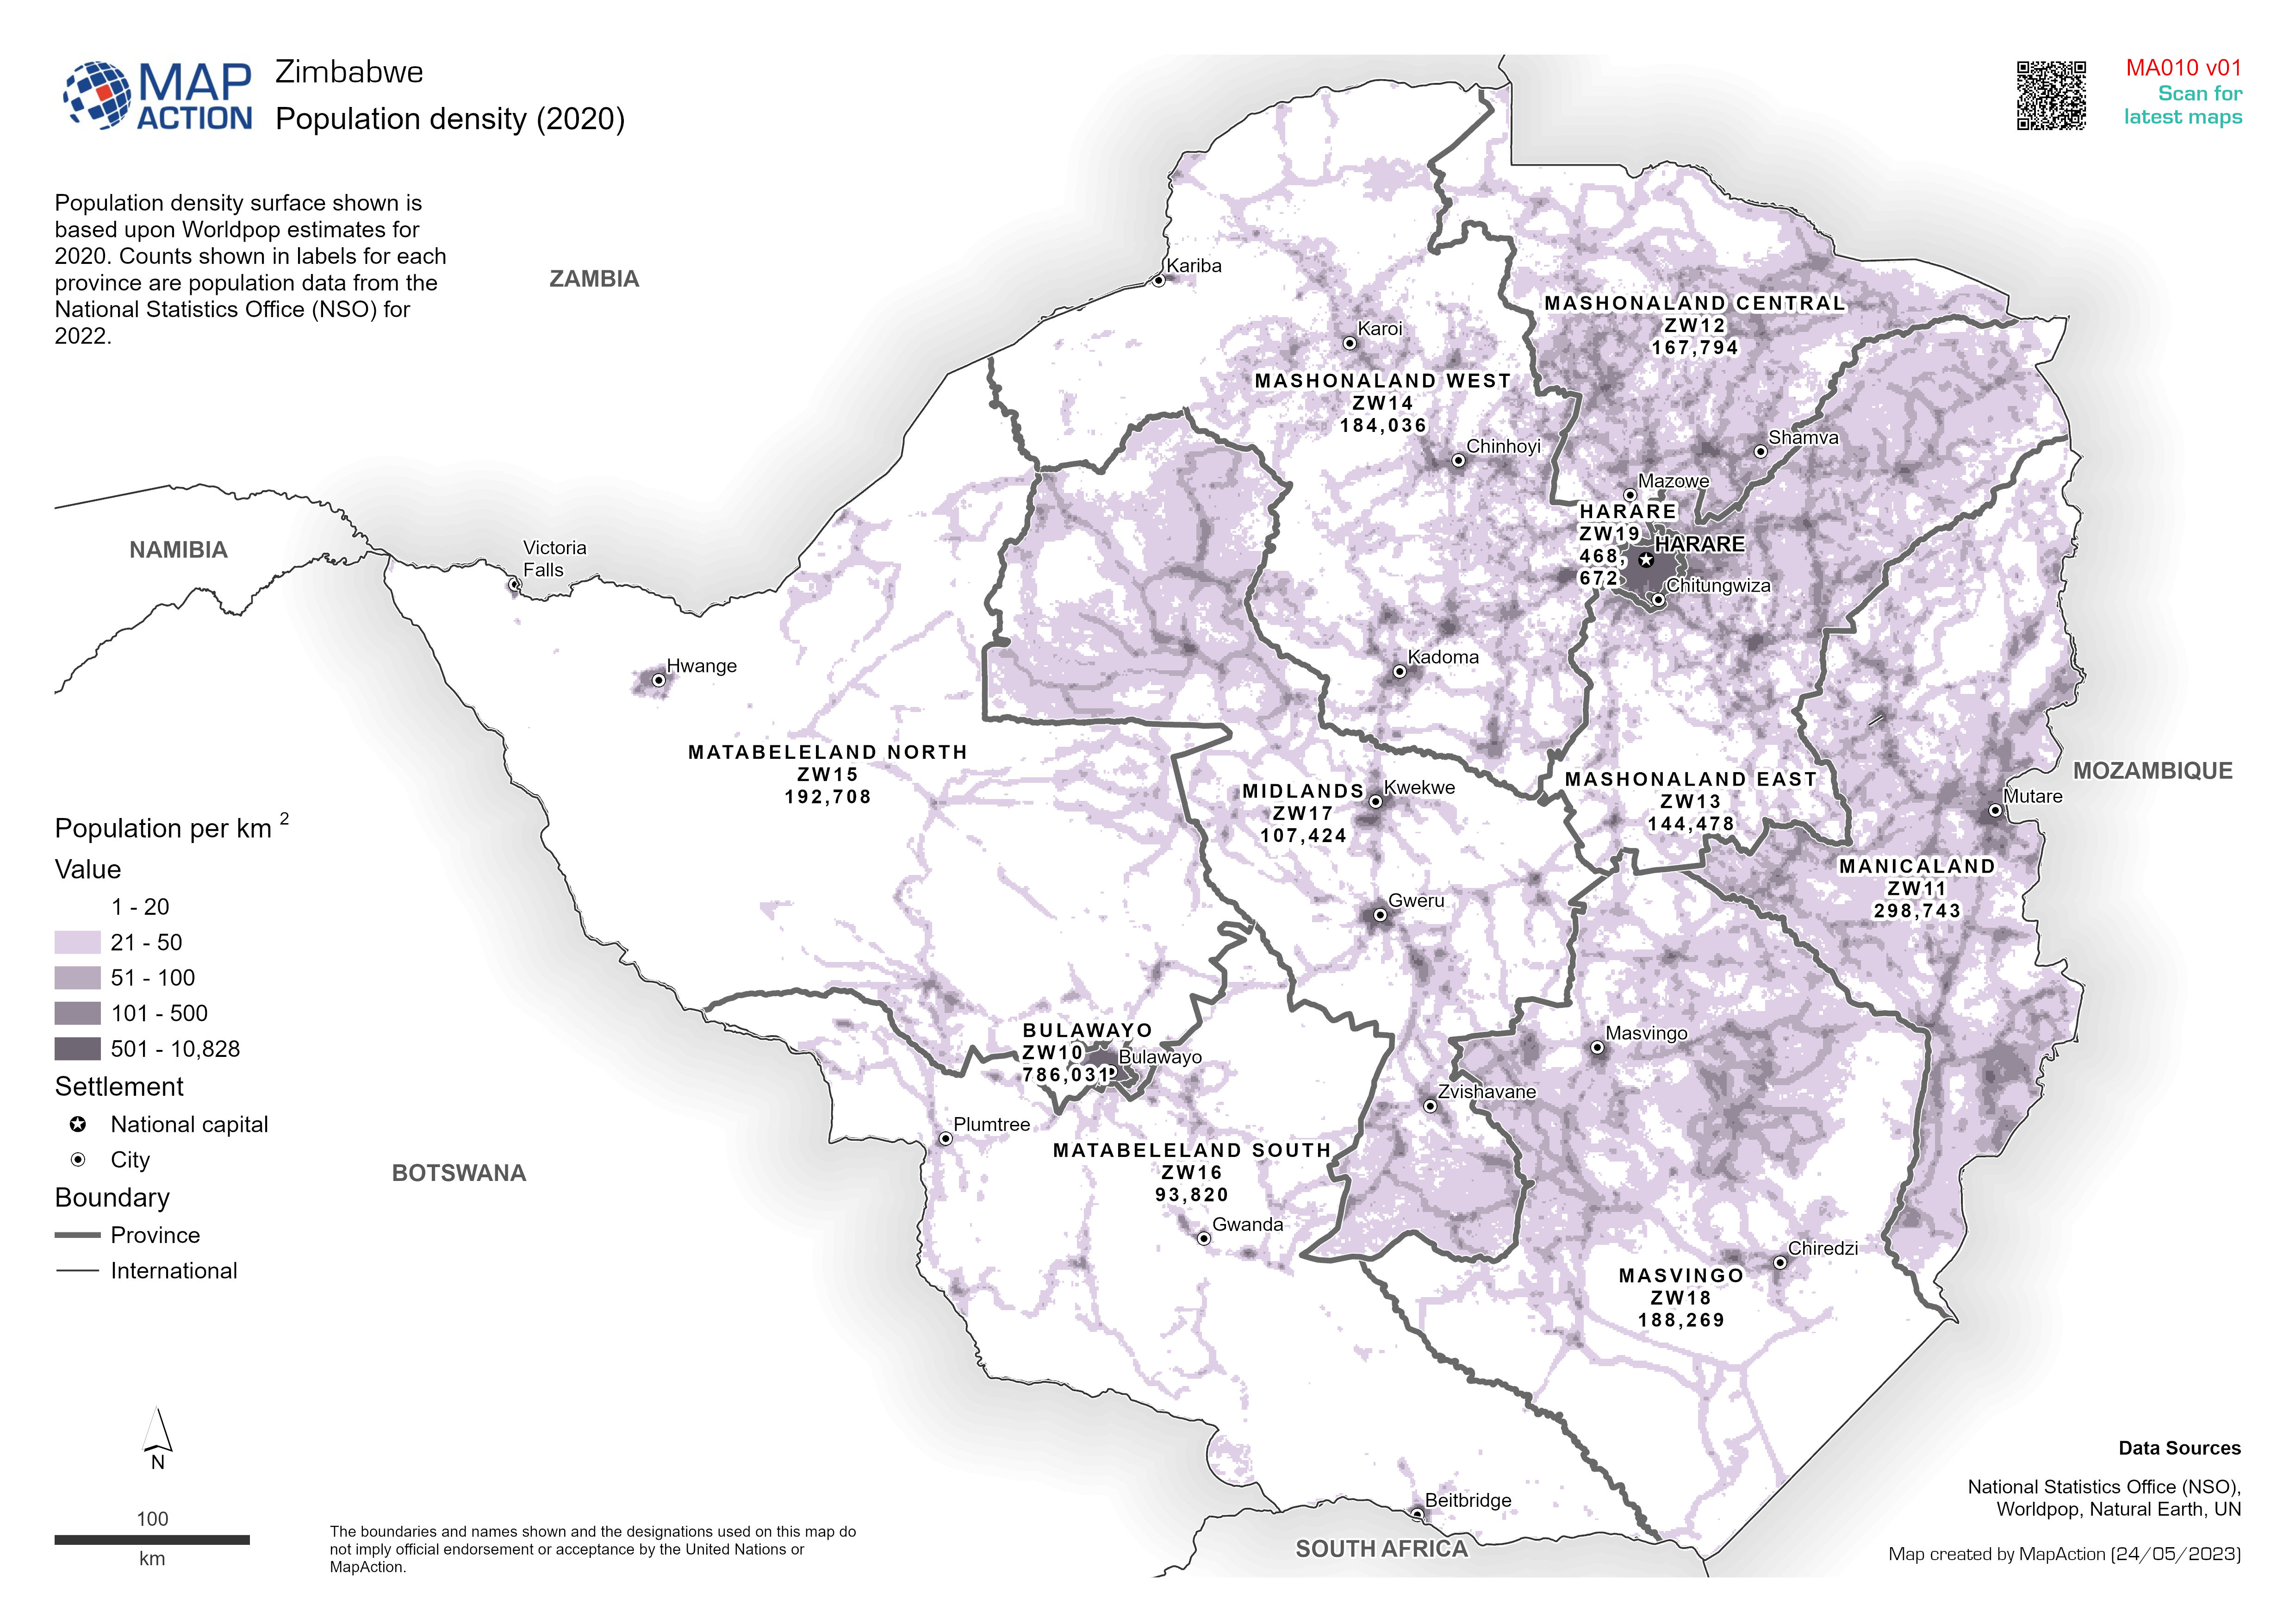
Population density (2020)
Population density surface shown is based upon Worldpop estimates for 2020. Counts shown in labels for each province are population data from the National Statistics Office... -

Storm path tropical cyclone Mocha (as of 15 May 2023) with baseline populatio...
Storm path as reported by Joint Typhoon Warning Centre. Population totals in table are 2022 estimates by UNFPA and US Census Bureau (USCB). Baseline population distribution... -

Baseline population for 2022
Population totals in table are 2022 estimates by UNFPA and US Census Bureau (USCB) Baseline population distribution mapped is 2022 estimates by Kontur -

Baseline population: Population density estimates for 2020 and population cou...
Baseline population. Population density 2020 (based on Worldpop estimates) and 2022 population counts labelled per state (based on projections from Central Bureau of... -

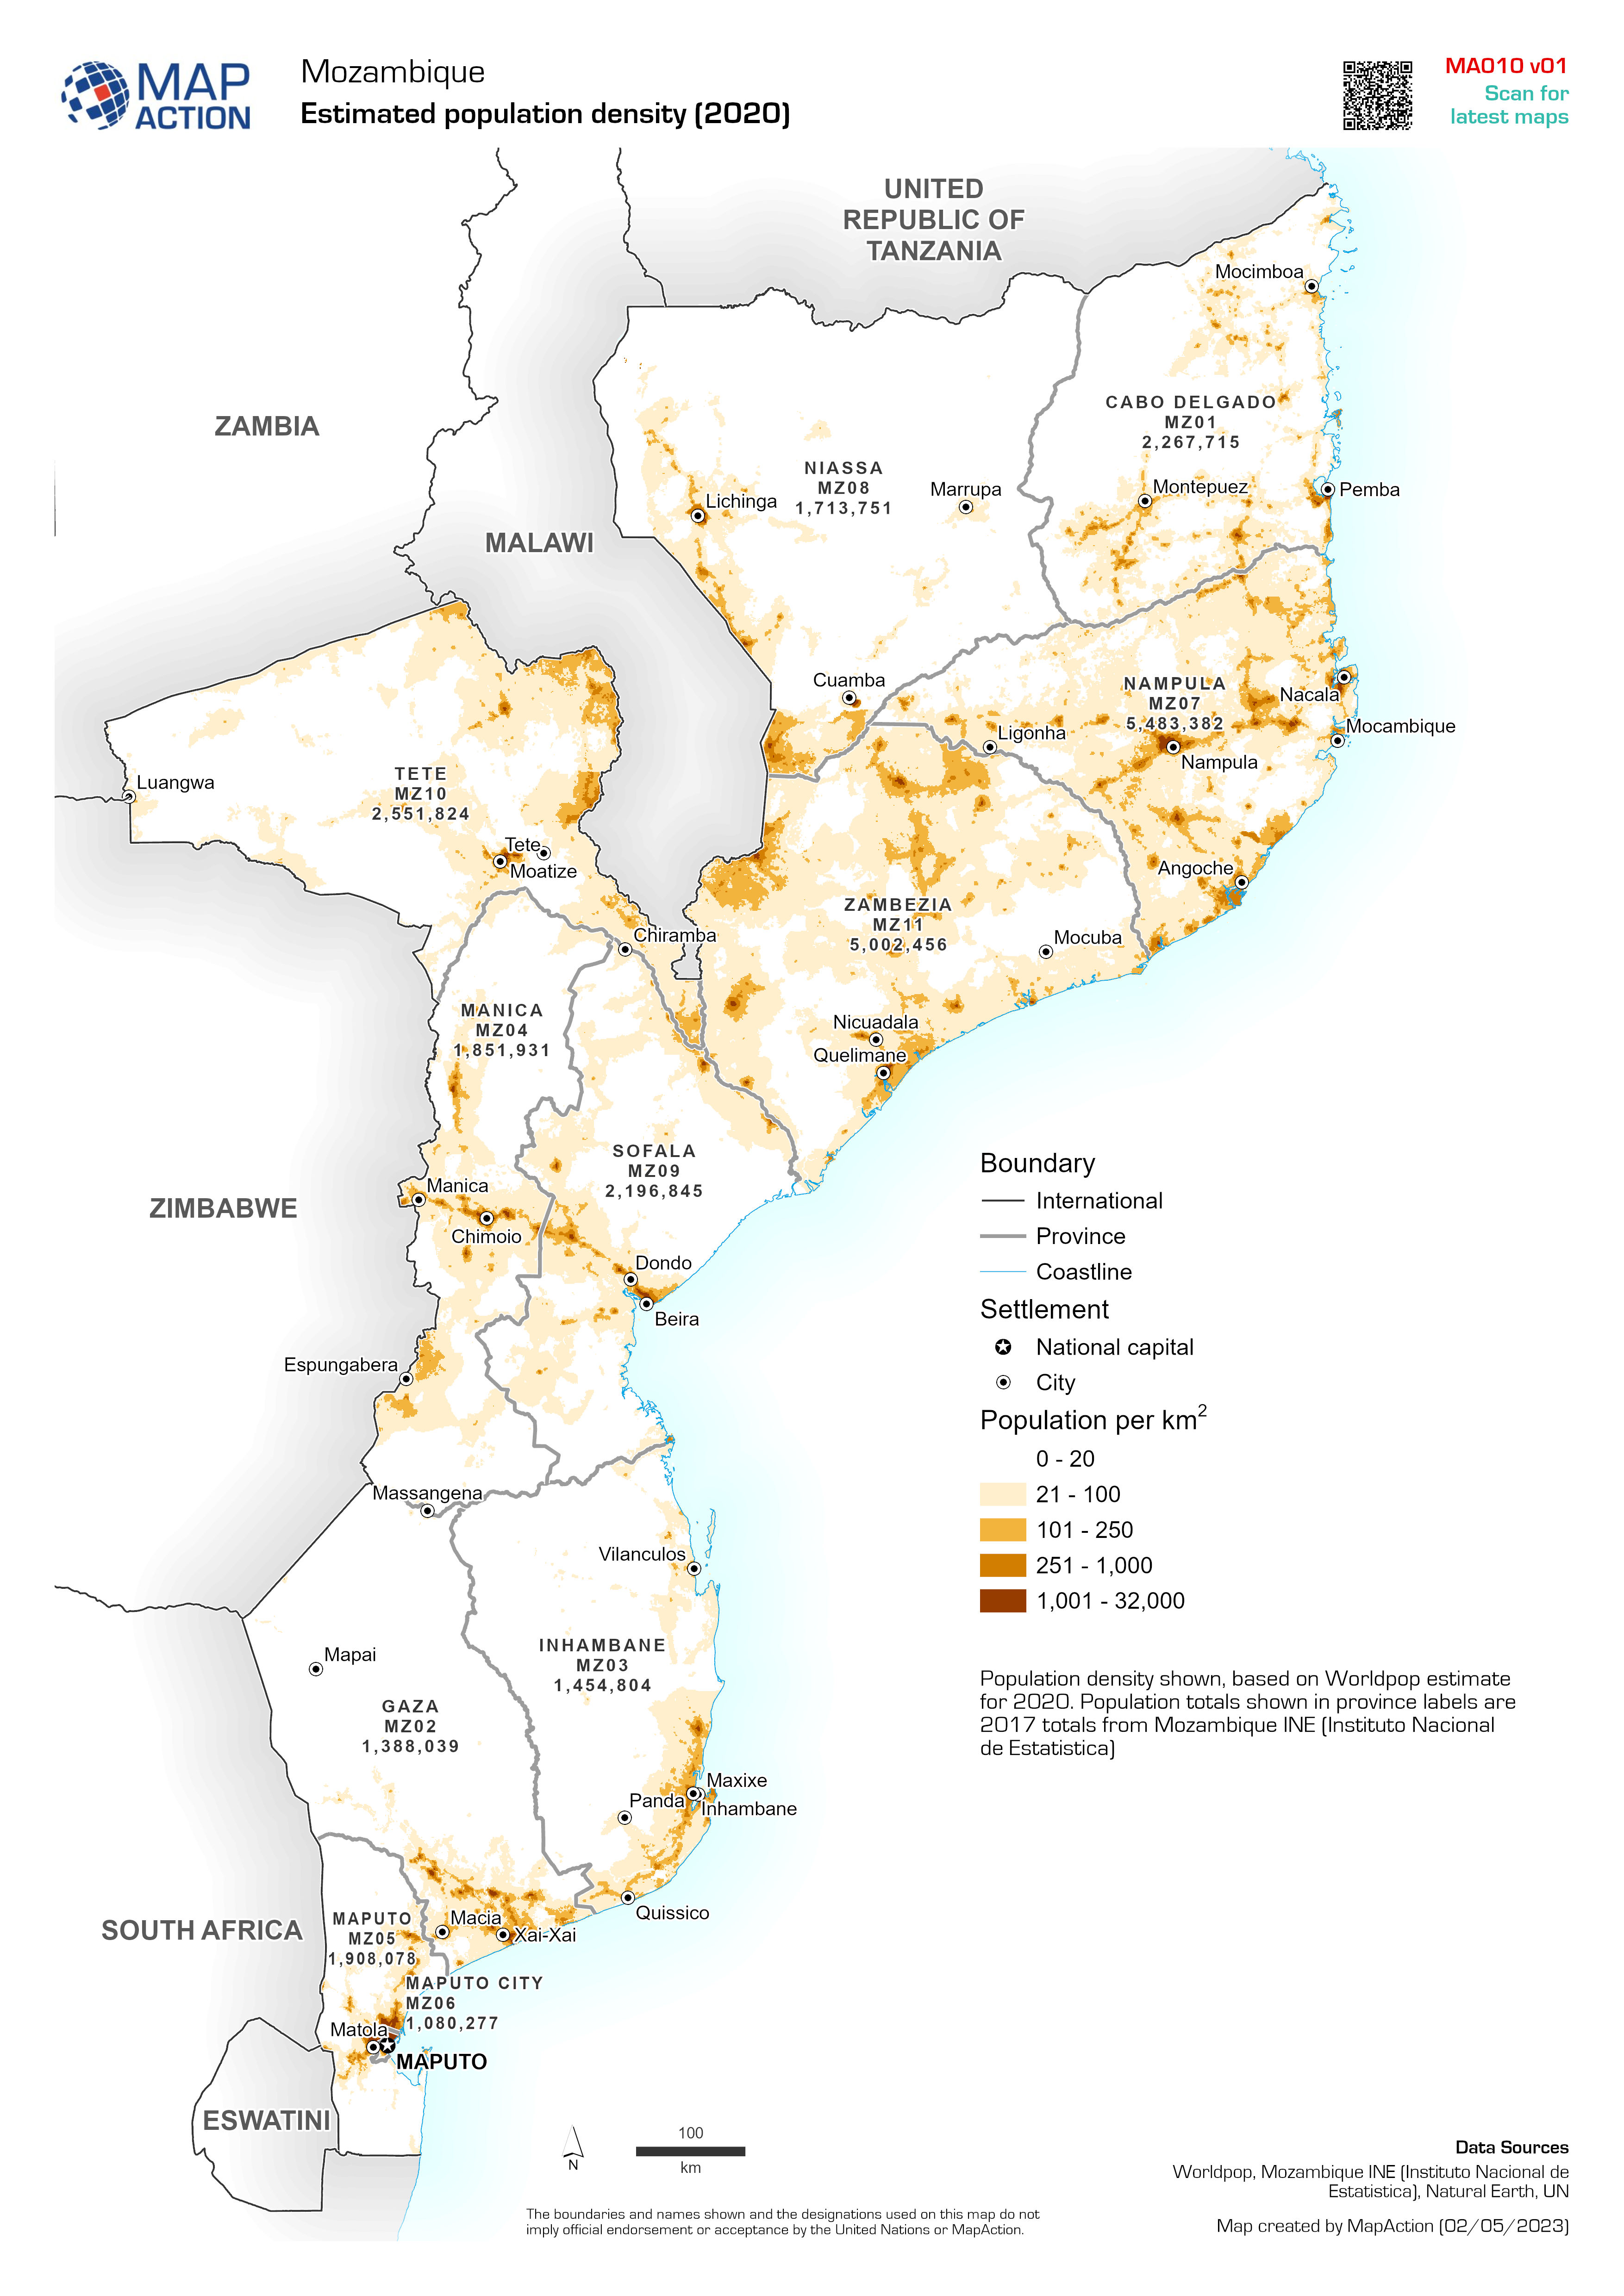
Estimated population density (2020)
Population density shown, based on Worldpop estimate for 2020. Population totals shown in province labels are 2017 totals from Mozambique INE (Instituto Nacional de Estatistica) -

Baseline Population by County
Estimated population count per county for 2019. Statistics from the Kenya National Bureau of Statistics.