-

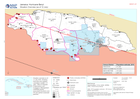
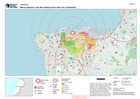
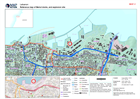
Assessment locations - 10 and 15 July 2024
Map shows the location of the assessments carried out on 10 July 2024. Teams included members from ODPEM, UNDAC, OIM, FAO, UNDSS, UNDP, UNICEF, ATLAS, JEU and TSF. Roads,... -
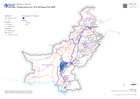
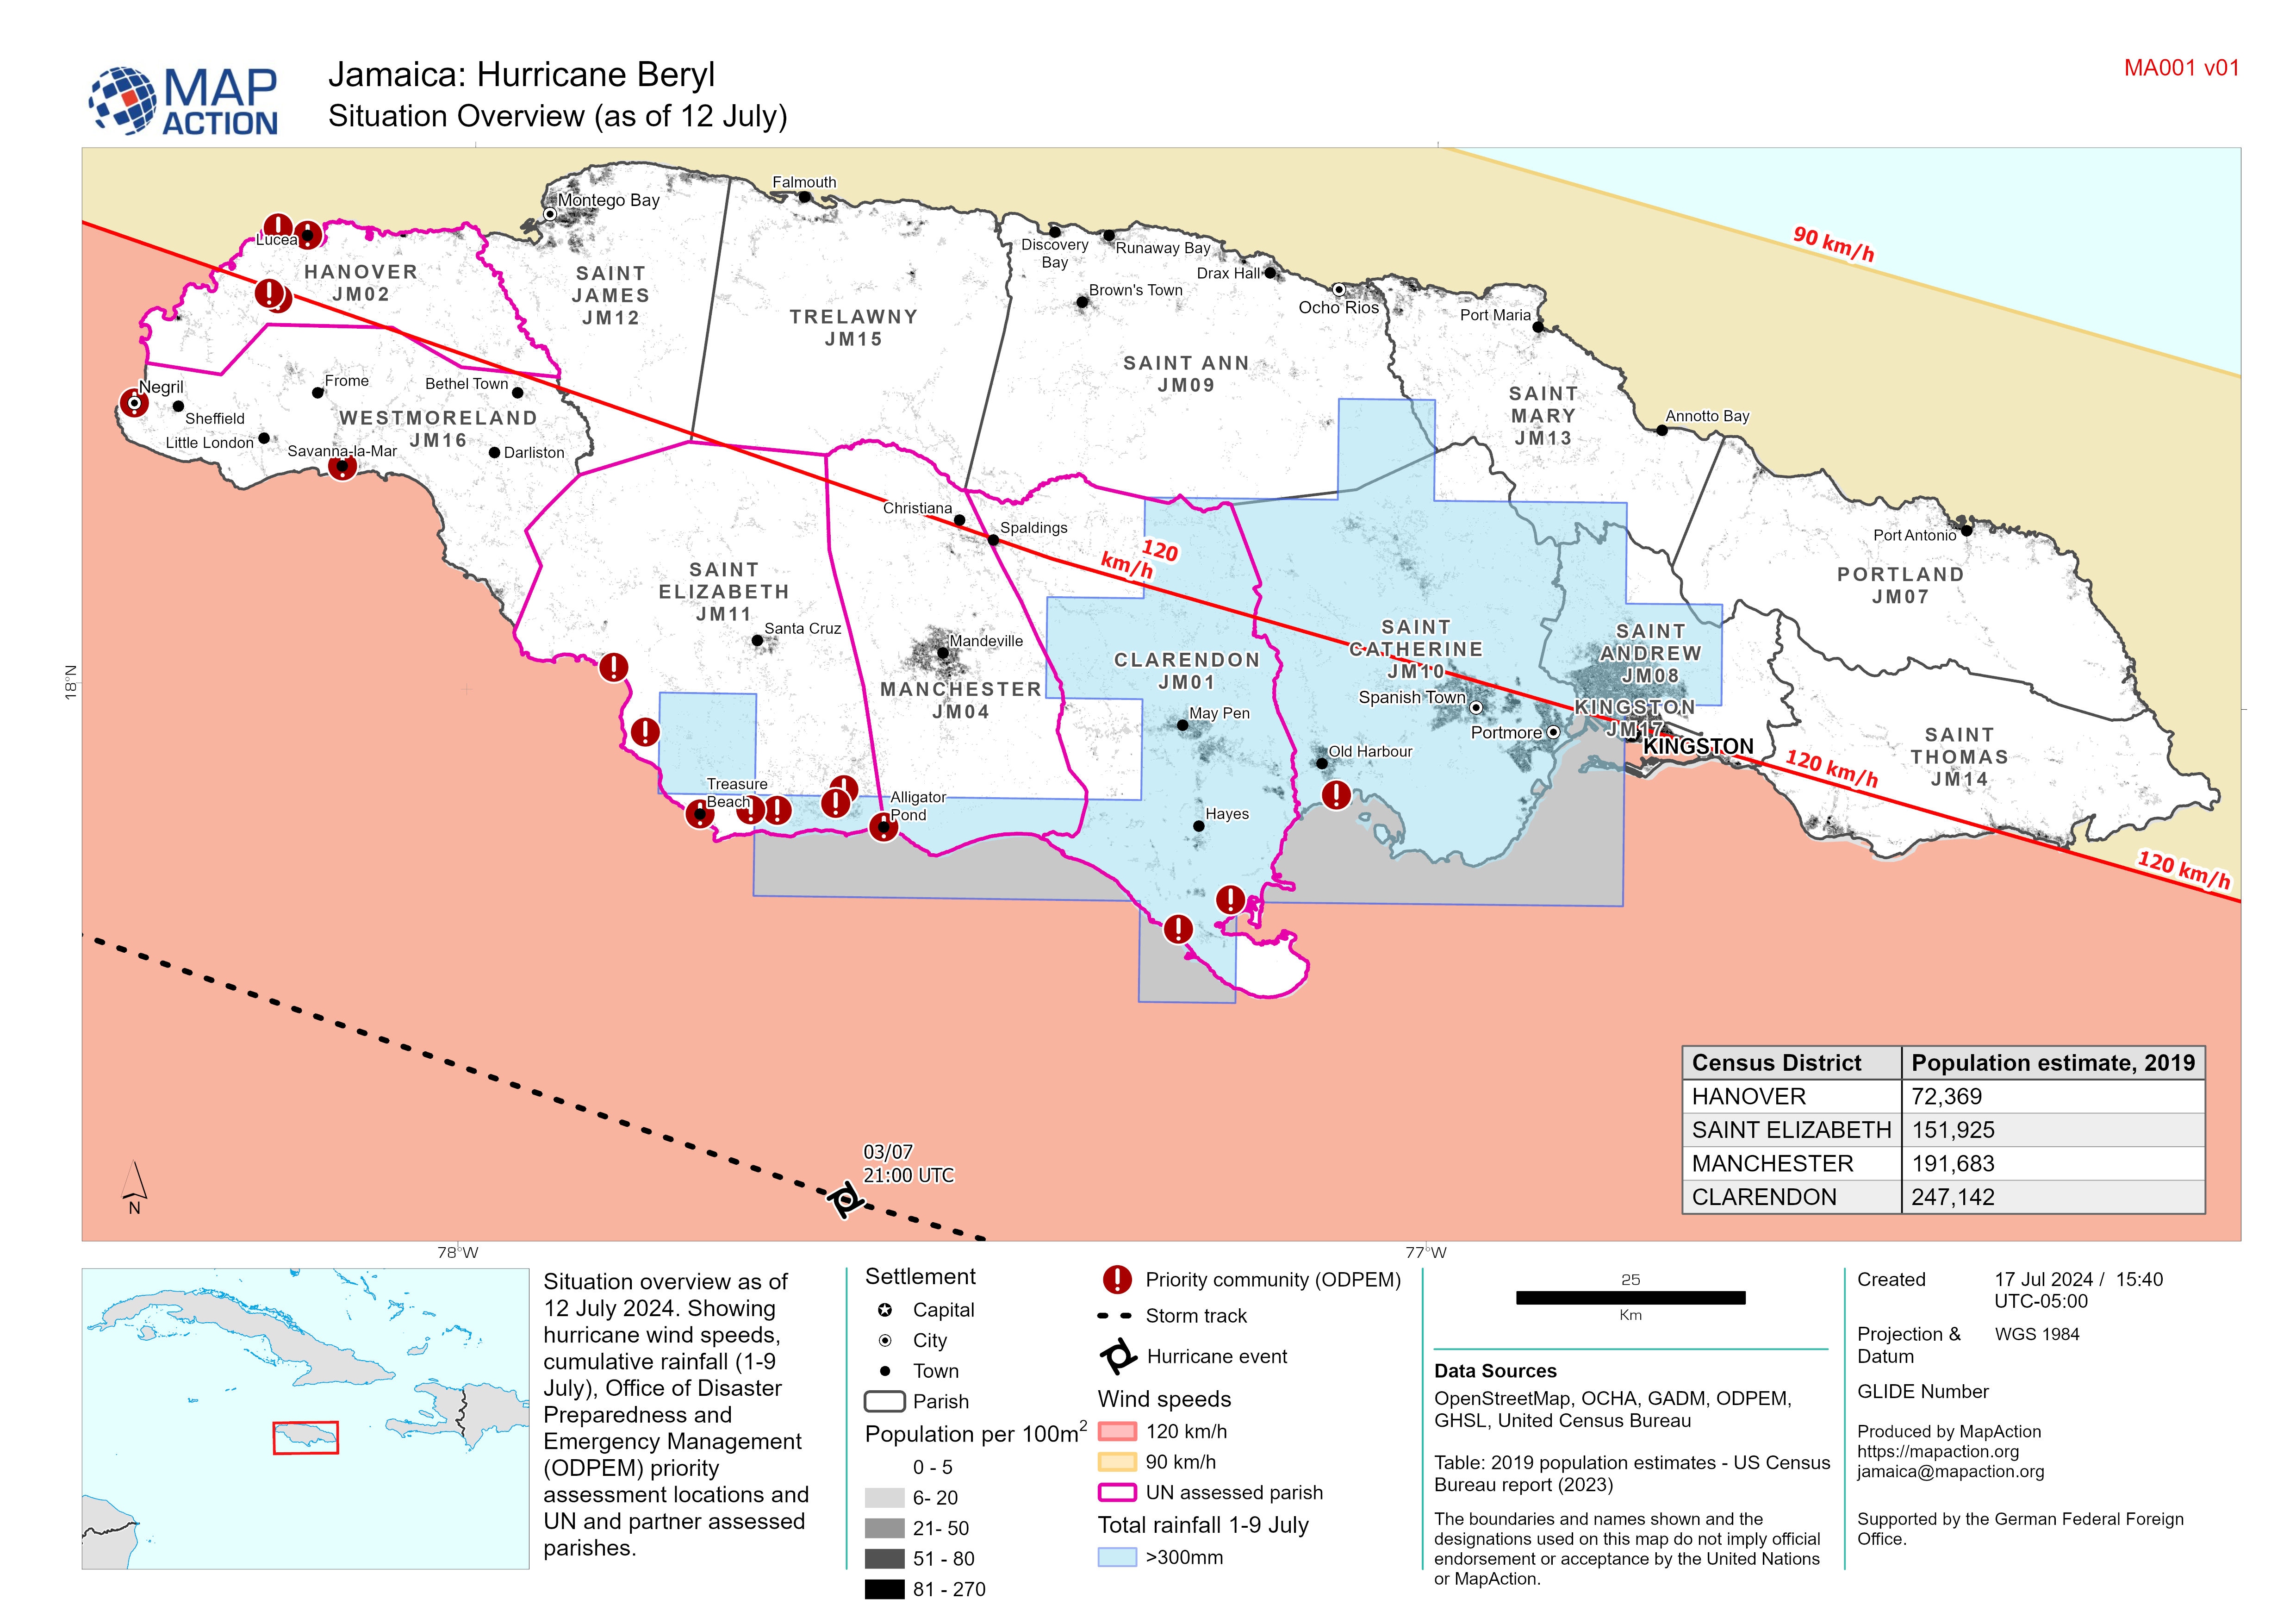
Situation Overview (as of 12 July)
Situation overview as of 12 July 2024. Showing hurricane wind speeds, cumulative rainfall (1-9 July), Office of Disaster Preparedness and Emergency Management (ODPEM) priority... -

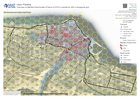
COPERNICUS EMS Building Assessment 5 July - Union Island: Atlas
Overview of Union Island showing damage assessment data sourced from Copernicus EMS, 5 July. -

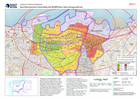
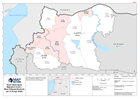
Buildings and Extent of Wildfires within NEMO Area of Focus:
A map showing building footprints and the extent of wildfires derived by the Copernicus Emergency Mapping Service (EMS) and from Sentinel-2 satellite images. Populated areas and... -
Overview of affected Governorate of Derna (LY0101) overlaid by 250 m hexagona...
Overview of affected area overlaid by 250 m diameter hexagonal grid -

Overview of affected governorate of Derna (LY0101)
Overview of affected area showing transport infrastructure and natural features with flood extents -

Precipitación acumulada en los departamentos afectados entre el 28 de marzo y...
Lluvia acumulada en los departamentos afectados entre el 28 de marzo y el 10 de abril de 2023 -

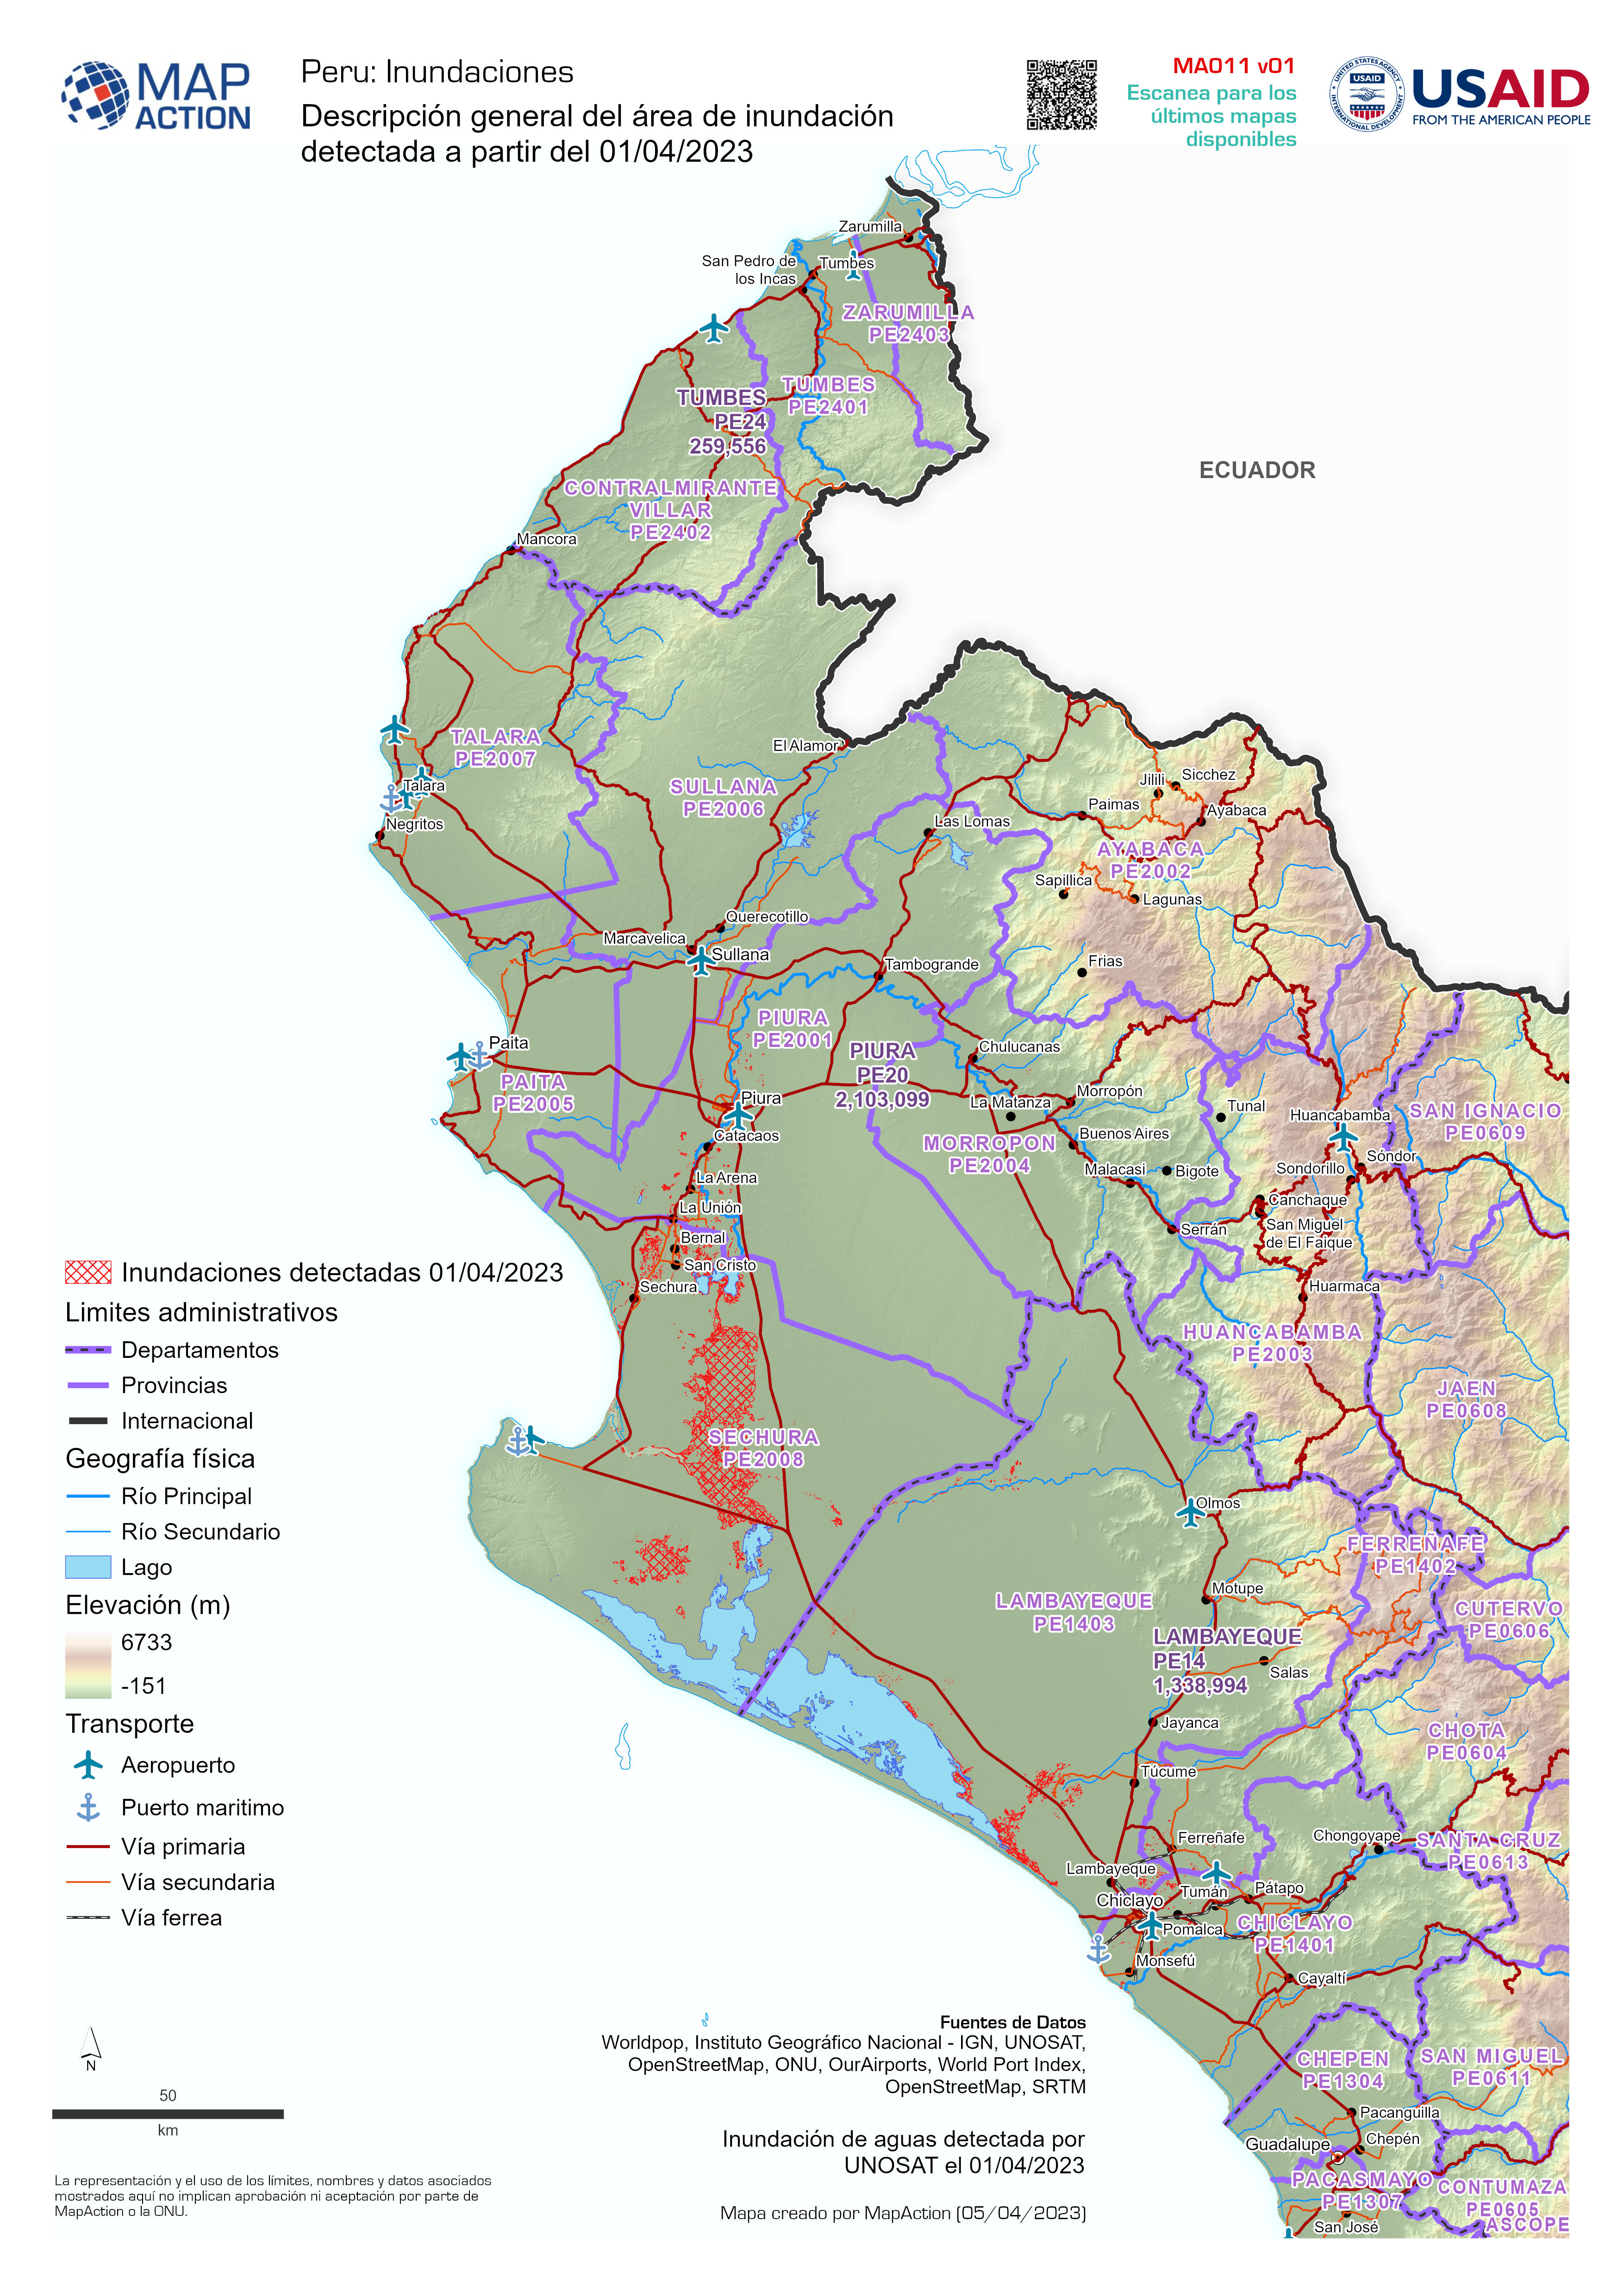
Descripción general del área de inundación detectada a partir del 01/04/2023
Inundación de aguas detectada por UNOSAT el 01/04/2023 -
Flooded areas from 15 to 30 August from GFM
Flooded areas from 15 to 30 from GFM show with main cities, roads and railways -

Cumulative rainfall from 1st to 7th February 2022, elevation and rivers
Map shows the 7 day cumulative rainfall, storm track, rivers and elevation during Cyclone Batsirai. -

Topographic map showing earthquake shake intensity
Topographic map of Grande 'Anse, Nippes and South Départements, with earthquake shake intensity contours -

Nicaragua: Potential storm track, elevation and municipalities: 4 Nov 2020, 0...
This map shows the Hurricane Eta affected administration level 2 municipalities for Nicaragua with predicted wind speed cones, aganst elevation data and settlement locations. -

Nicaragua: Potential storm track, elevation and municipalities: 3 Nov 2020, ...
This map shows the affected administration level 2 municipalities for Nicaragua, with population estimates and predicted wind speed cones. -
Zone Socio-economic Vulnerability with ACAPS blast radius damage estimate
The socio-economic status of households living pre-blast in each zone was estimated by UN-Habitat based on (1) a national ranking of 498 disadvantaged area undertaken to inform... -
Beirut explosion site with infrastructure sites and vulnerability
Beirut explosion site with infrastructure sites and vulnerability. -
Reference map of Beirut docks, and explosion site
Reference map of Beirut docks, and explosion site -

North West Syria Migration Crisis - Most Affected Sub-districts (as of 28 Apr...
This map shows a situational overview the most affected sub-districts in the North West of the Syrian Arab Republic. -
North West Syria Migration Crisis - Most Affected Districts (as of 28 Apr 2020)
This map shows a situational overview the most affected districts in the North West of the Syrian Arab Republic.

