-

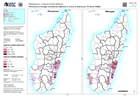
Affected population by district as a proportion of the total population (as o...
Affected population calculated as a percentage of total population. Affected population based on data for 18 August 2022. Total population is estimated from WorldPop data for 2020 -

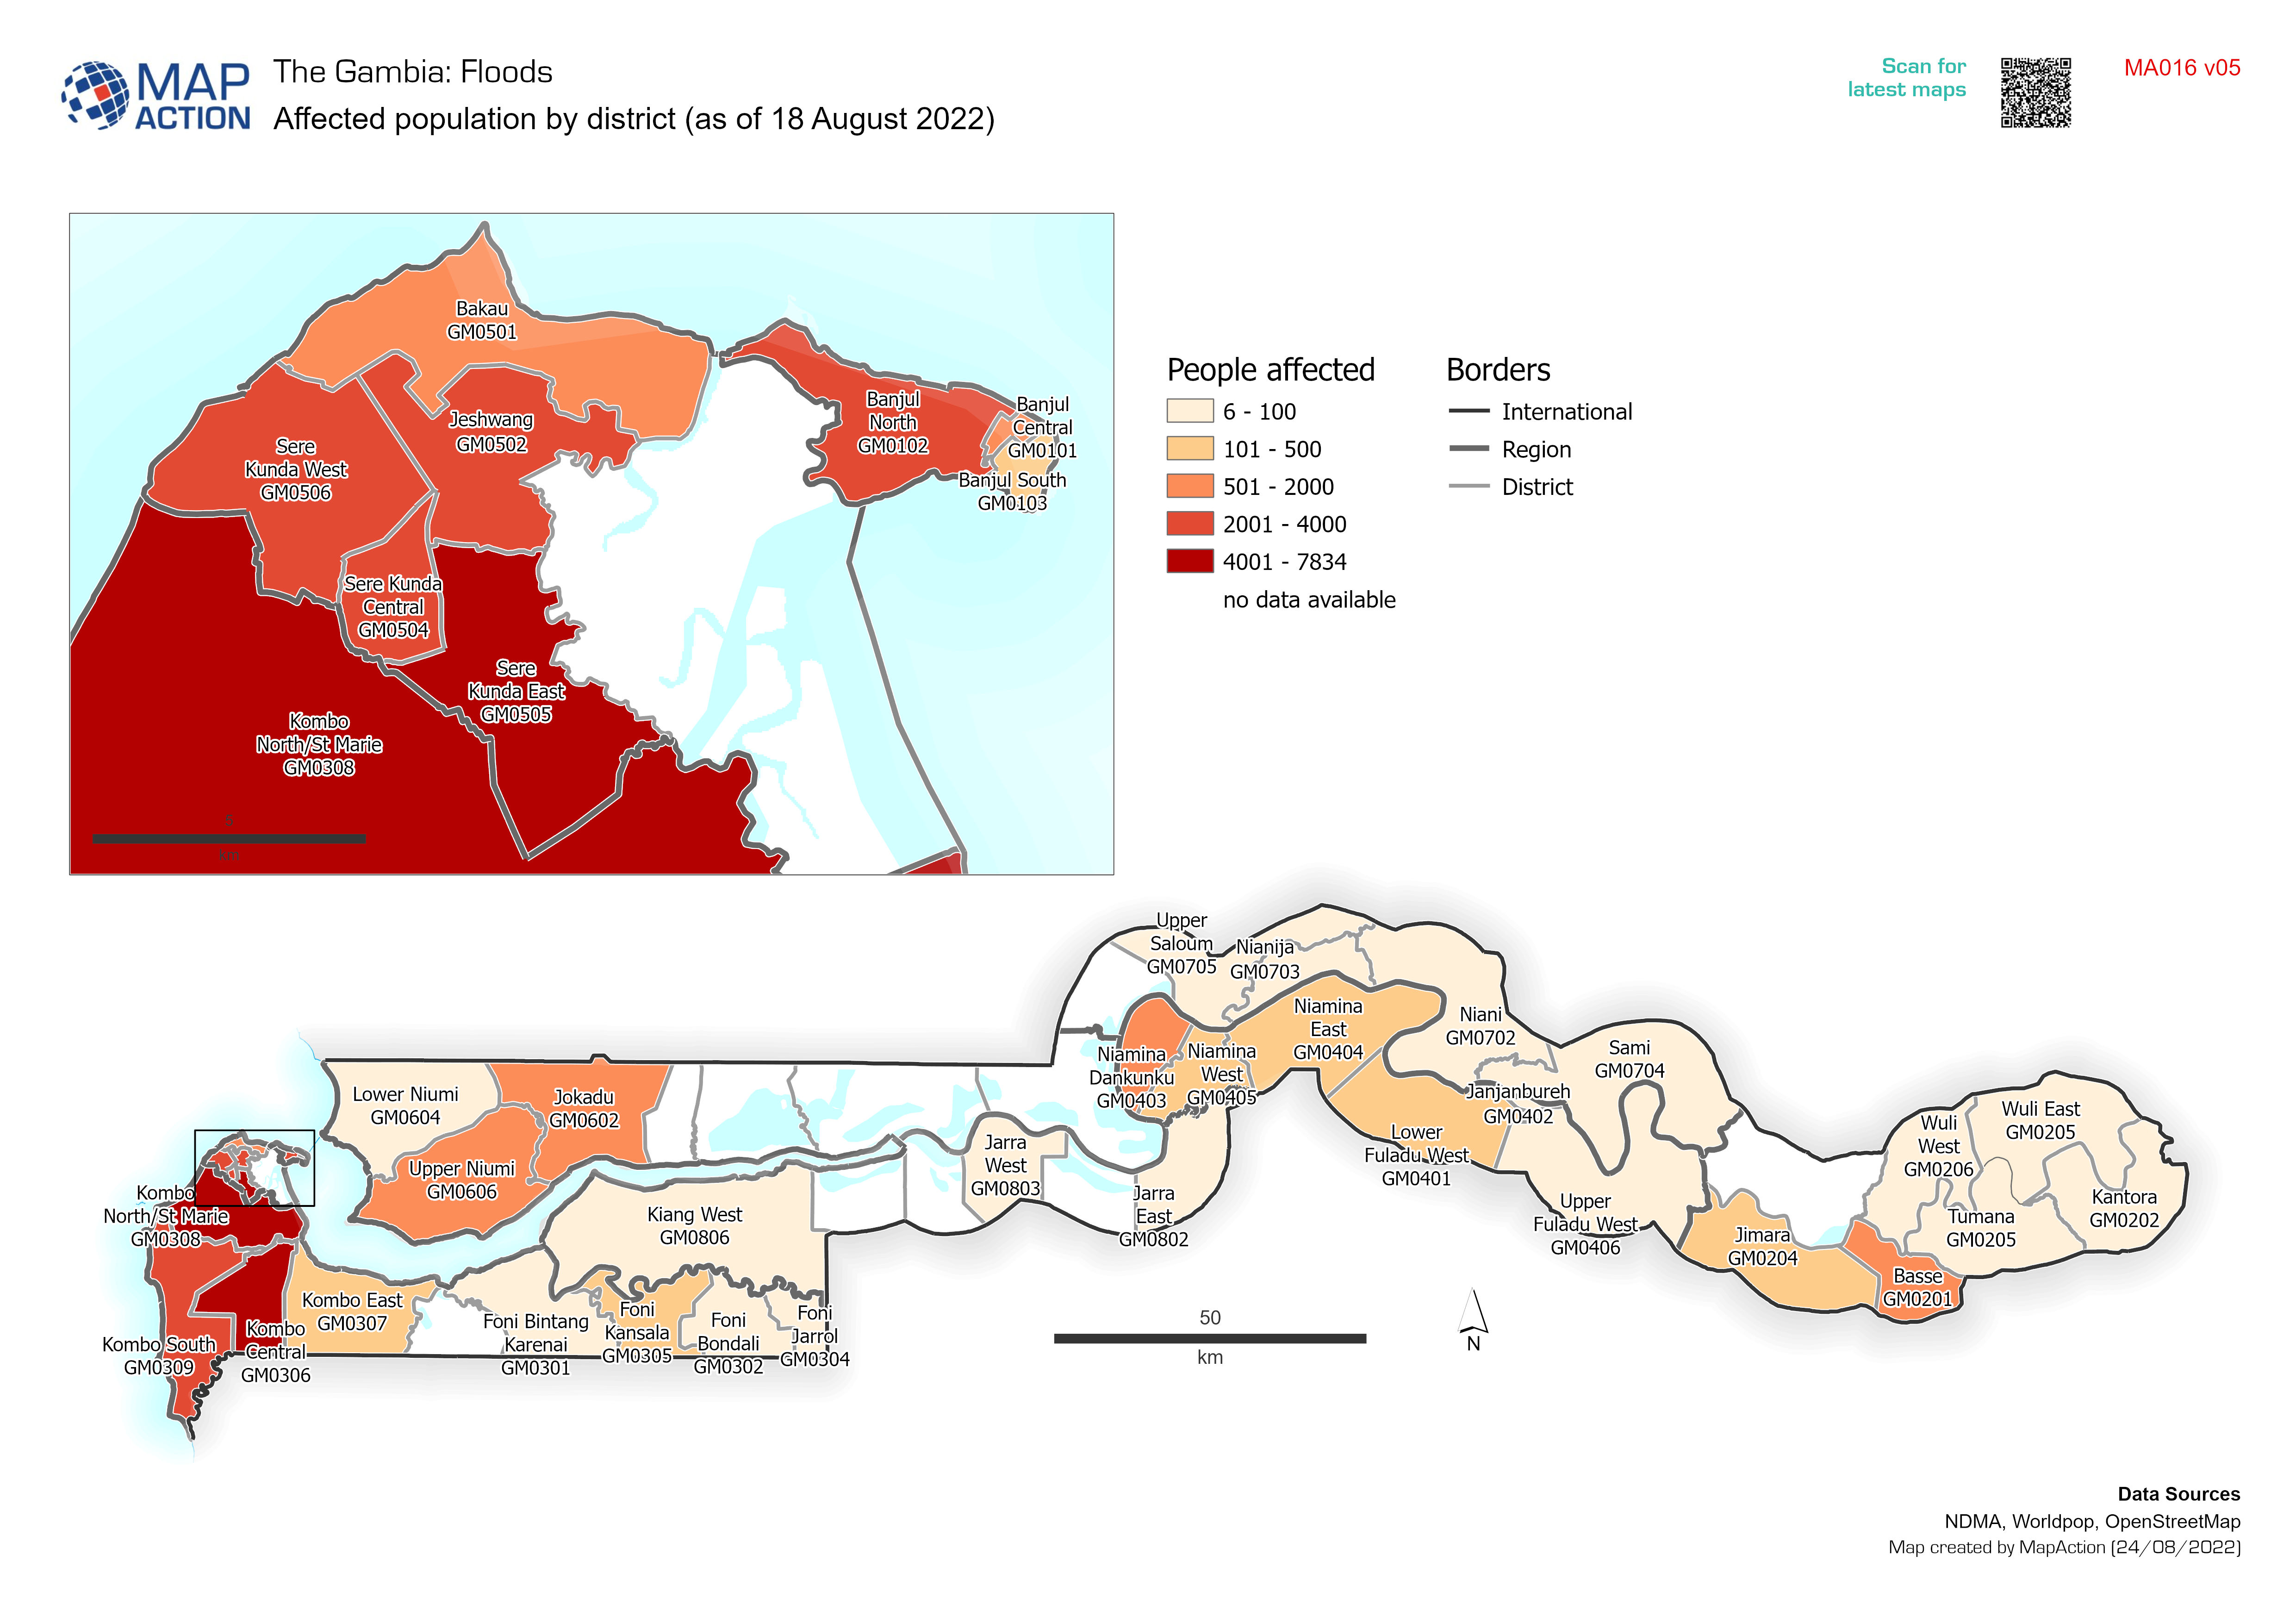
Affected population by district (as of 18 August 2022)
Affected population per district based on data for 18 August 2022. -

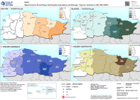
Affected Population by District (as of 18 August 2022)
District population baseline and graph shows the split between females and males -

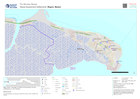
Baseline population and reported flood extent
Baseline population and reported flood extent as of 10 august 2022 -
Personnes et ménages actuellement déplacés au niveau du district (au 14 févri...
This map shows the number of displaced people and households in Districts of Madagascar as of 14th Feb 2022. Cette carte montre le nombre de personnes déplacées et de ménages... -

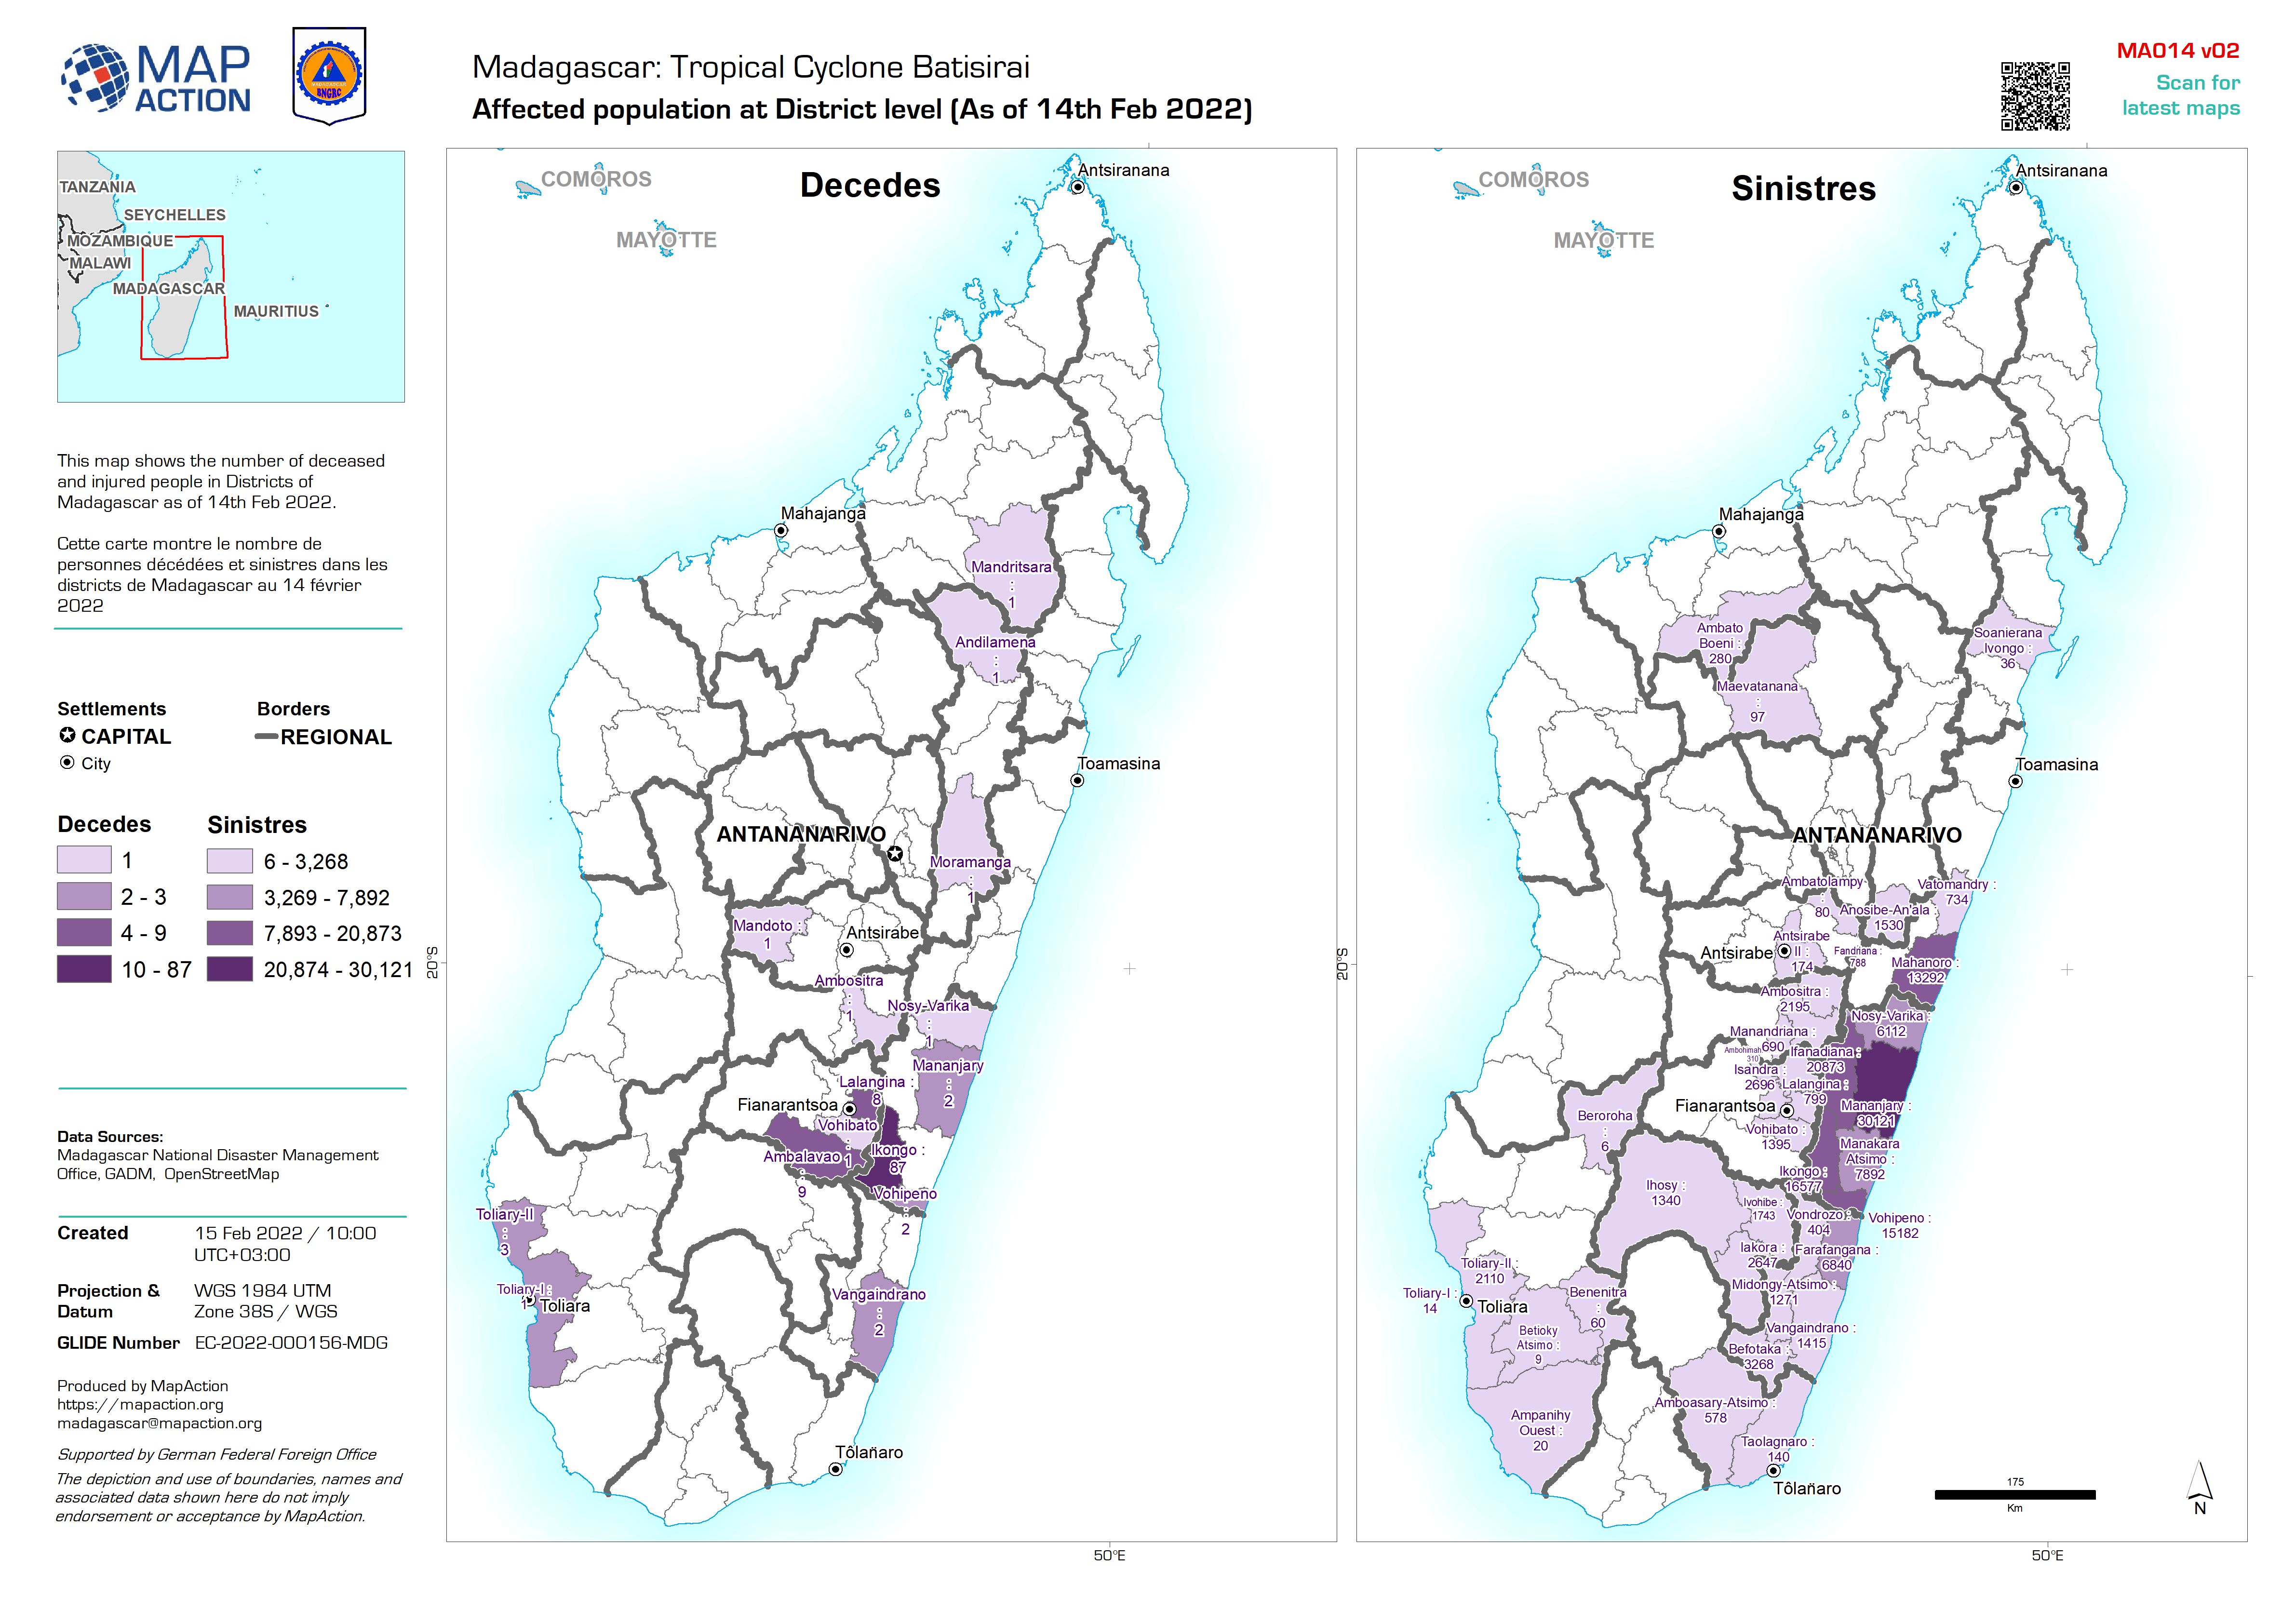
Affected population at District level (As of 14th Feb 2022)
This map shows the number of deceased and injured people in Districts of Madagascar as of 14th Feb 2022. Cette carte montre le nombre de personnes décédées et sinistres dans... -

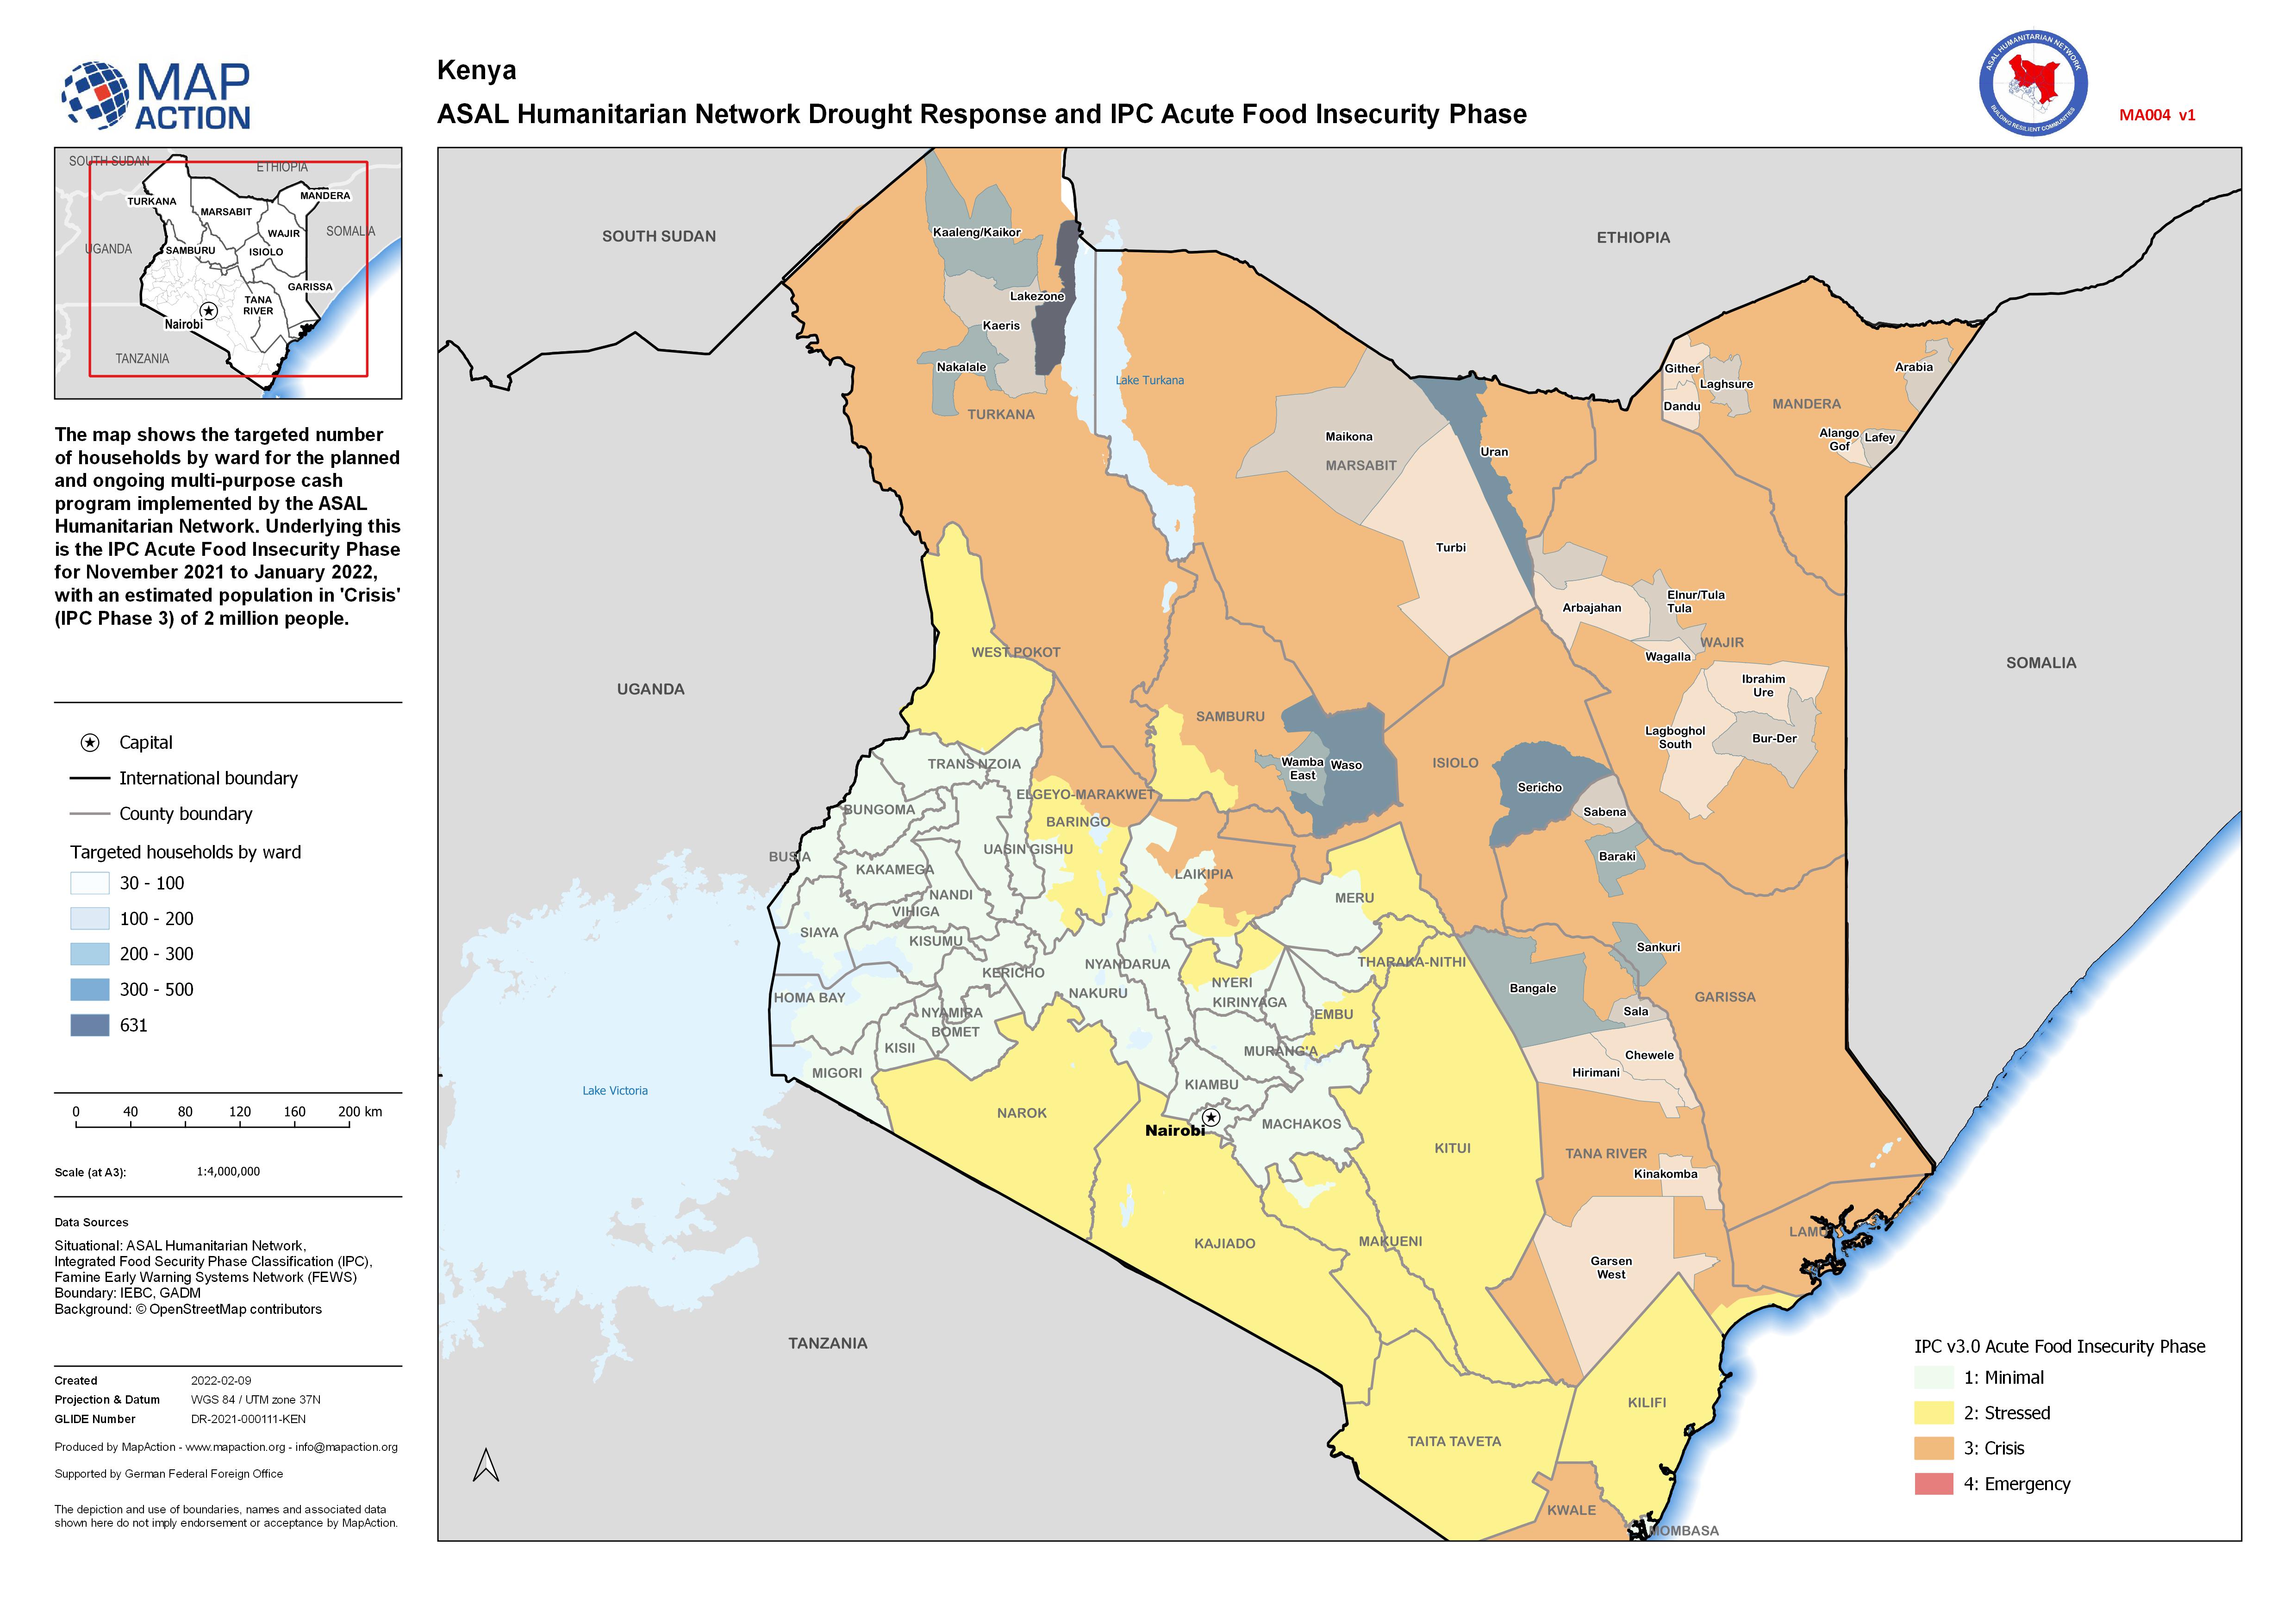
ASAL Humanitarian Network Drought Response and IPC Acute Food Insecurity Phase
The map shows the targeted number of households by ward for the planned and ongoing multi-purpose cash program implemented by the ASAL Humanitarian Network. Underlying this is... -

Current Displaced People and Households at District level (As of 8th Feb 2022)
This map shows the number of displaced people and households in Districts of Madagascar as of 8th Feb 2022 -

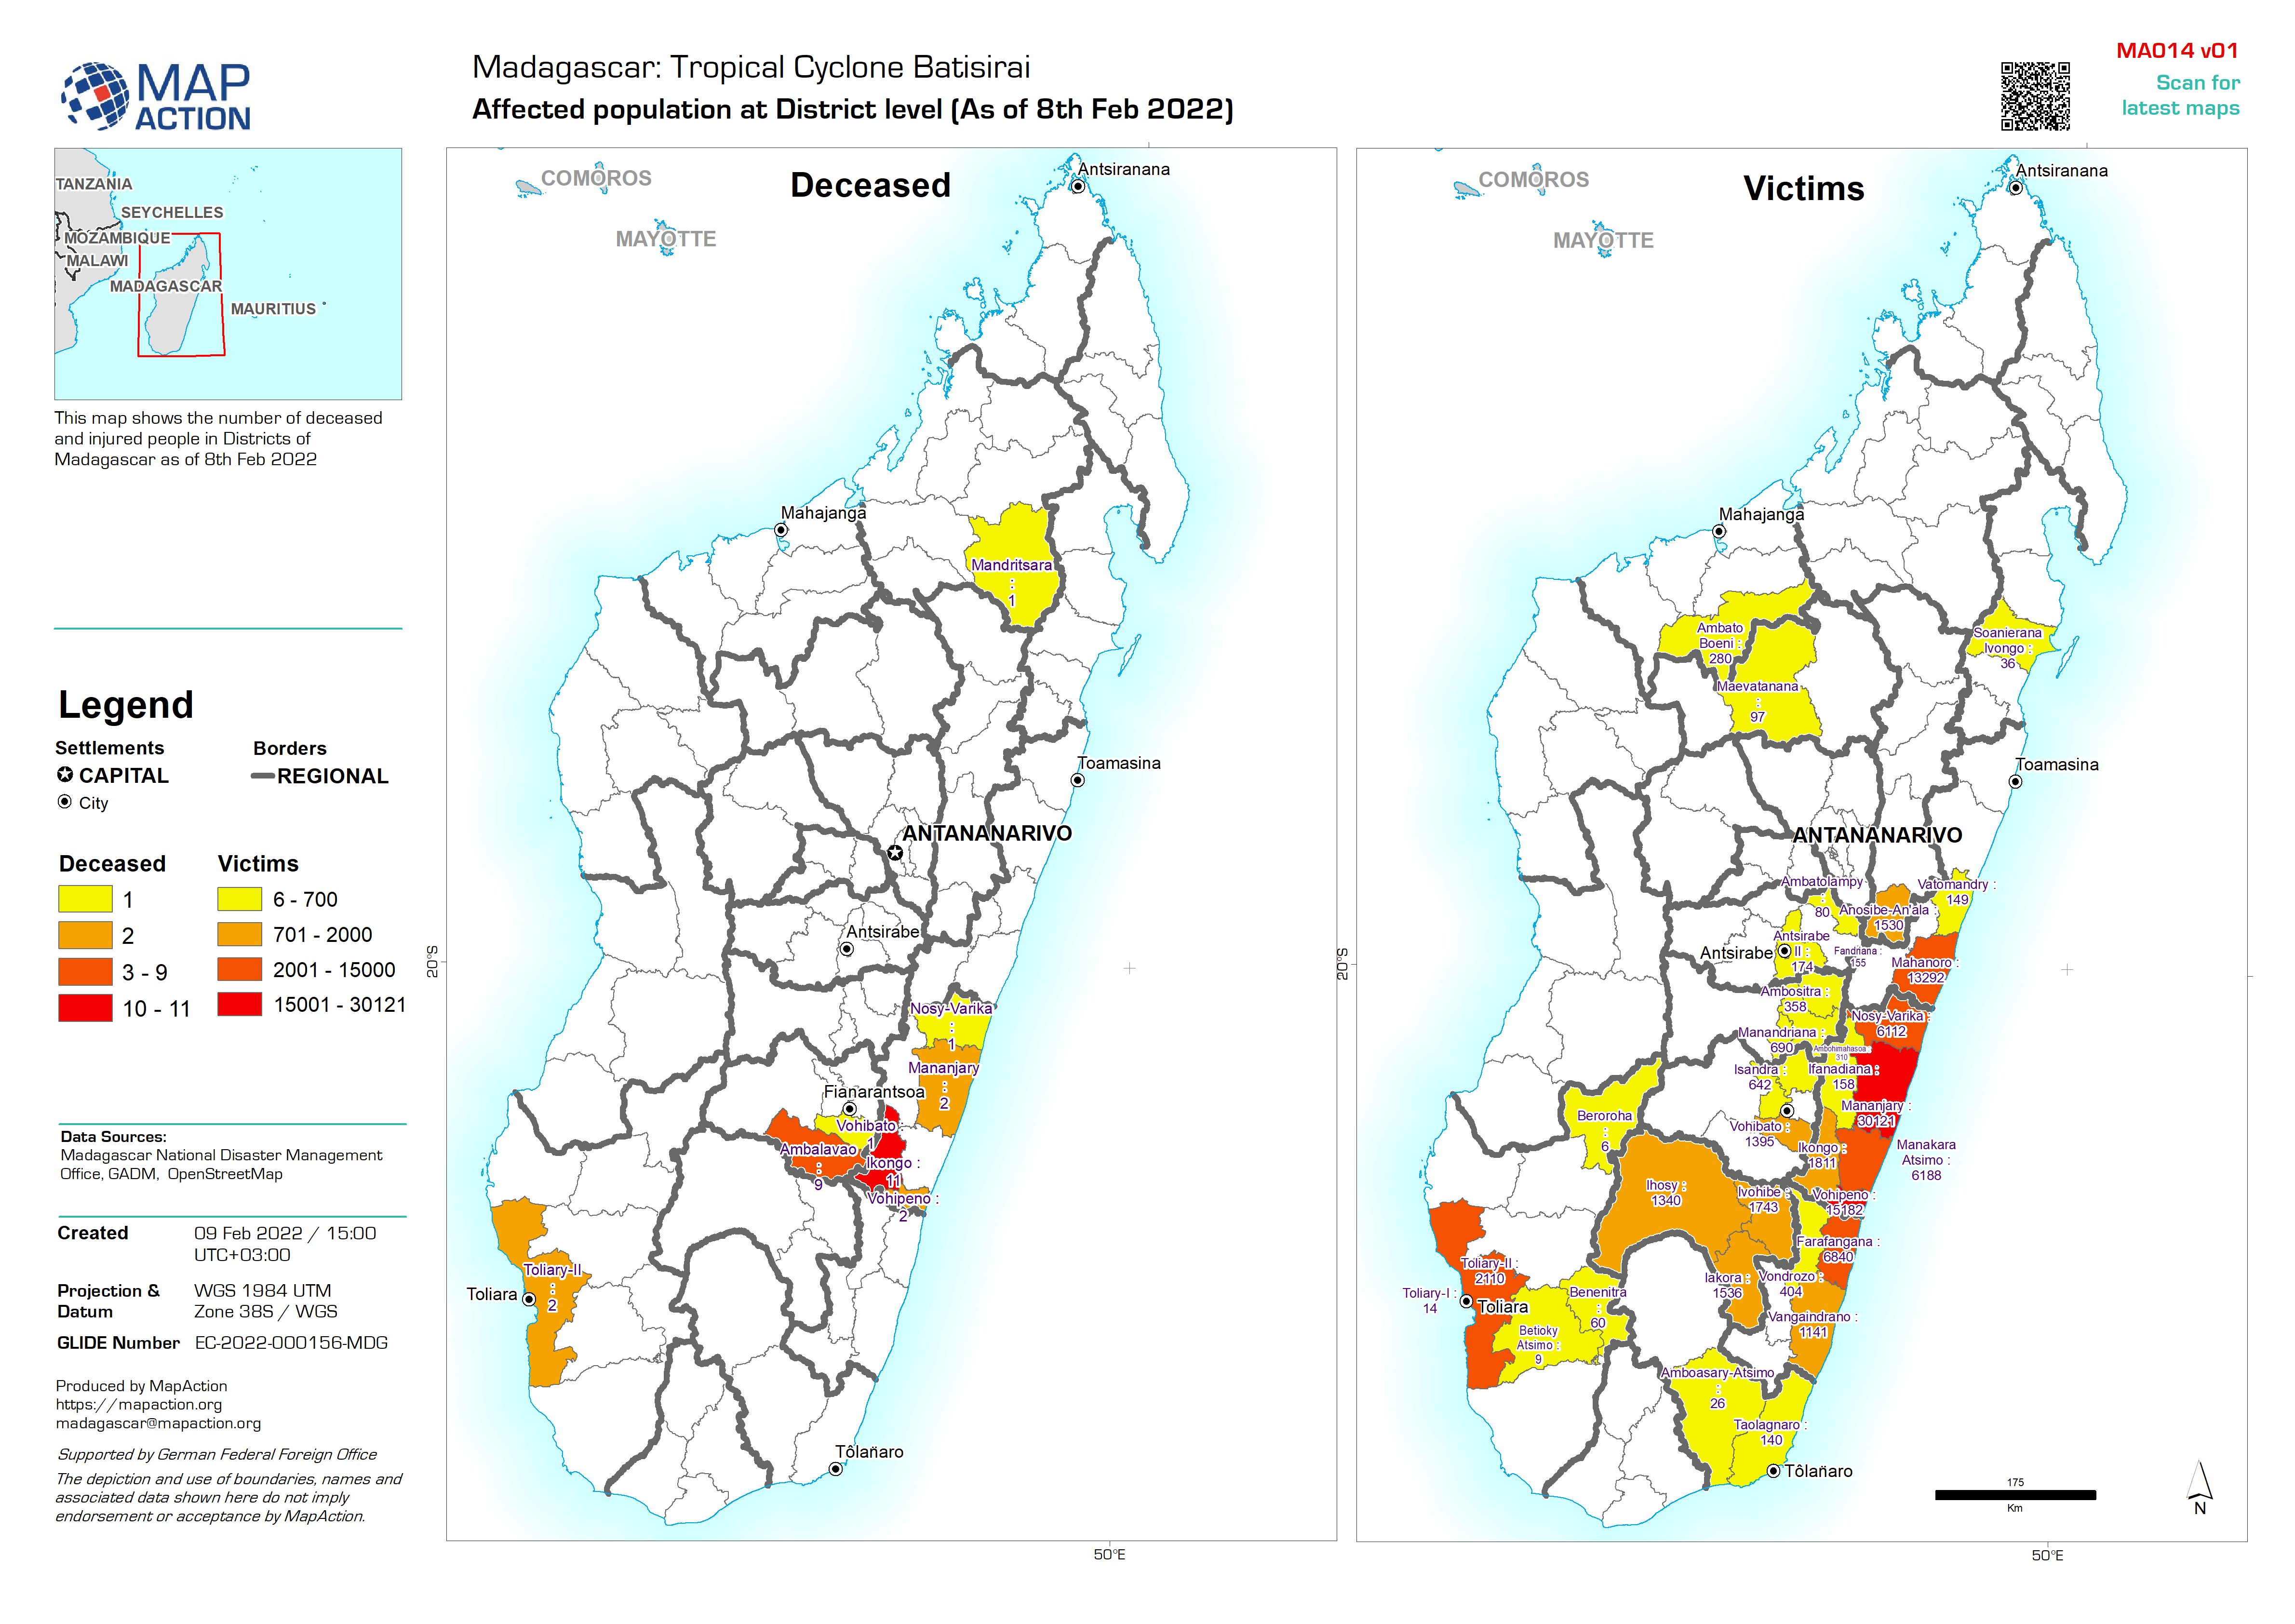
Affected population at District level (As of 8th Feb 2022)
This map shows the number of deceased and injured people in Districts of Madagascar as of 8th Feb 2022 -

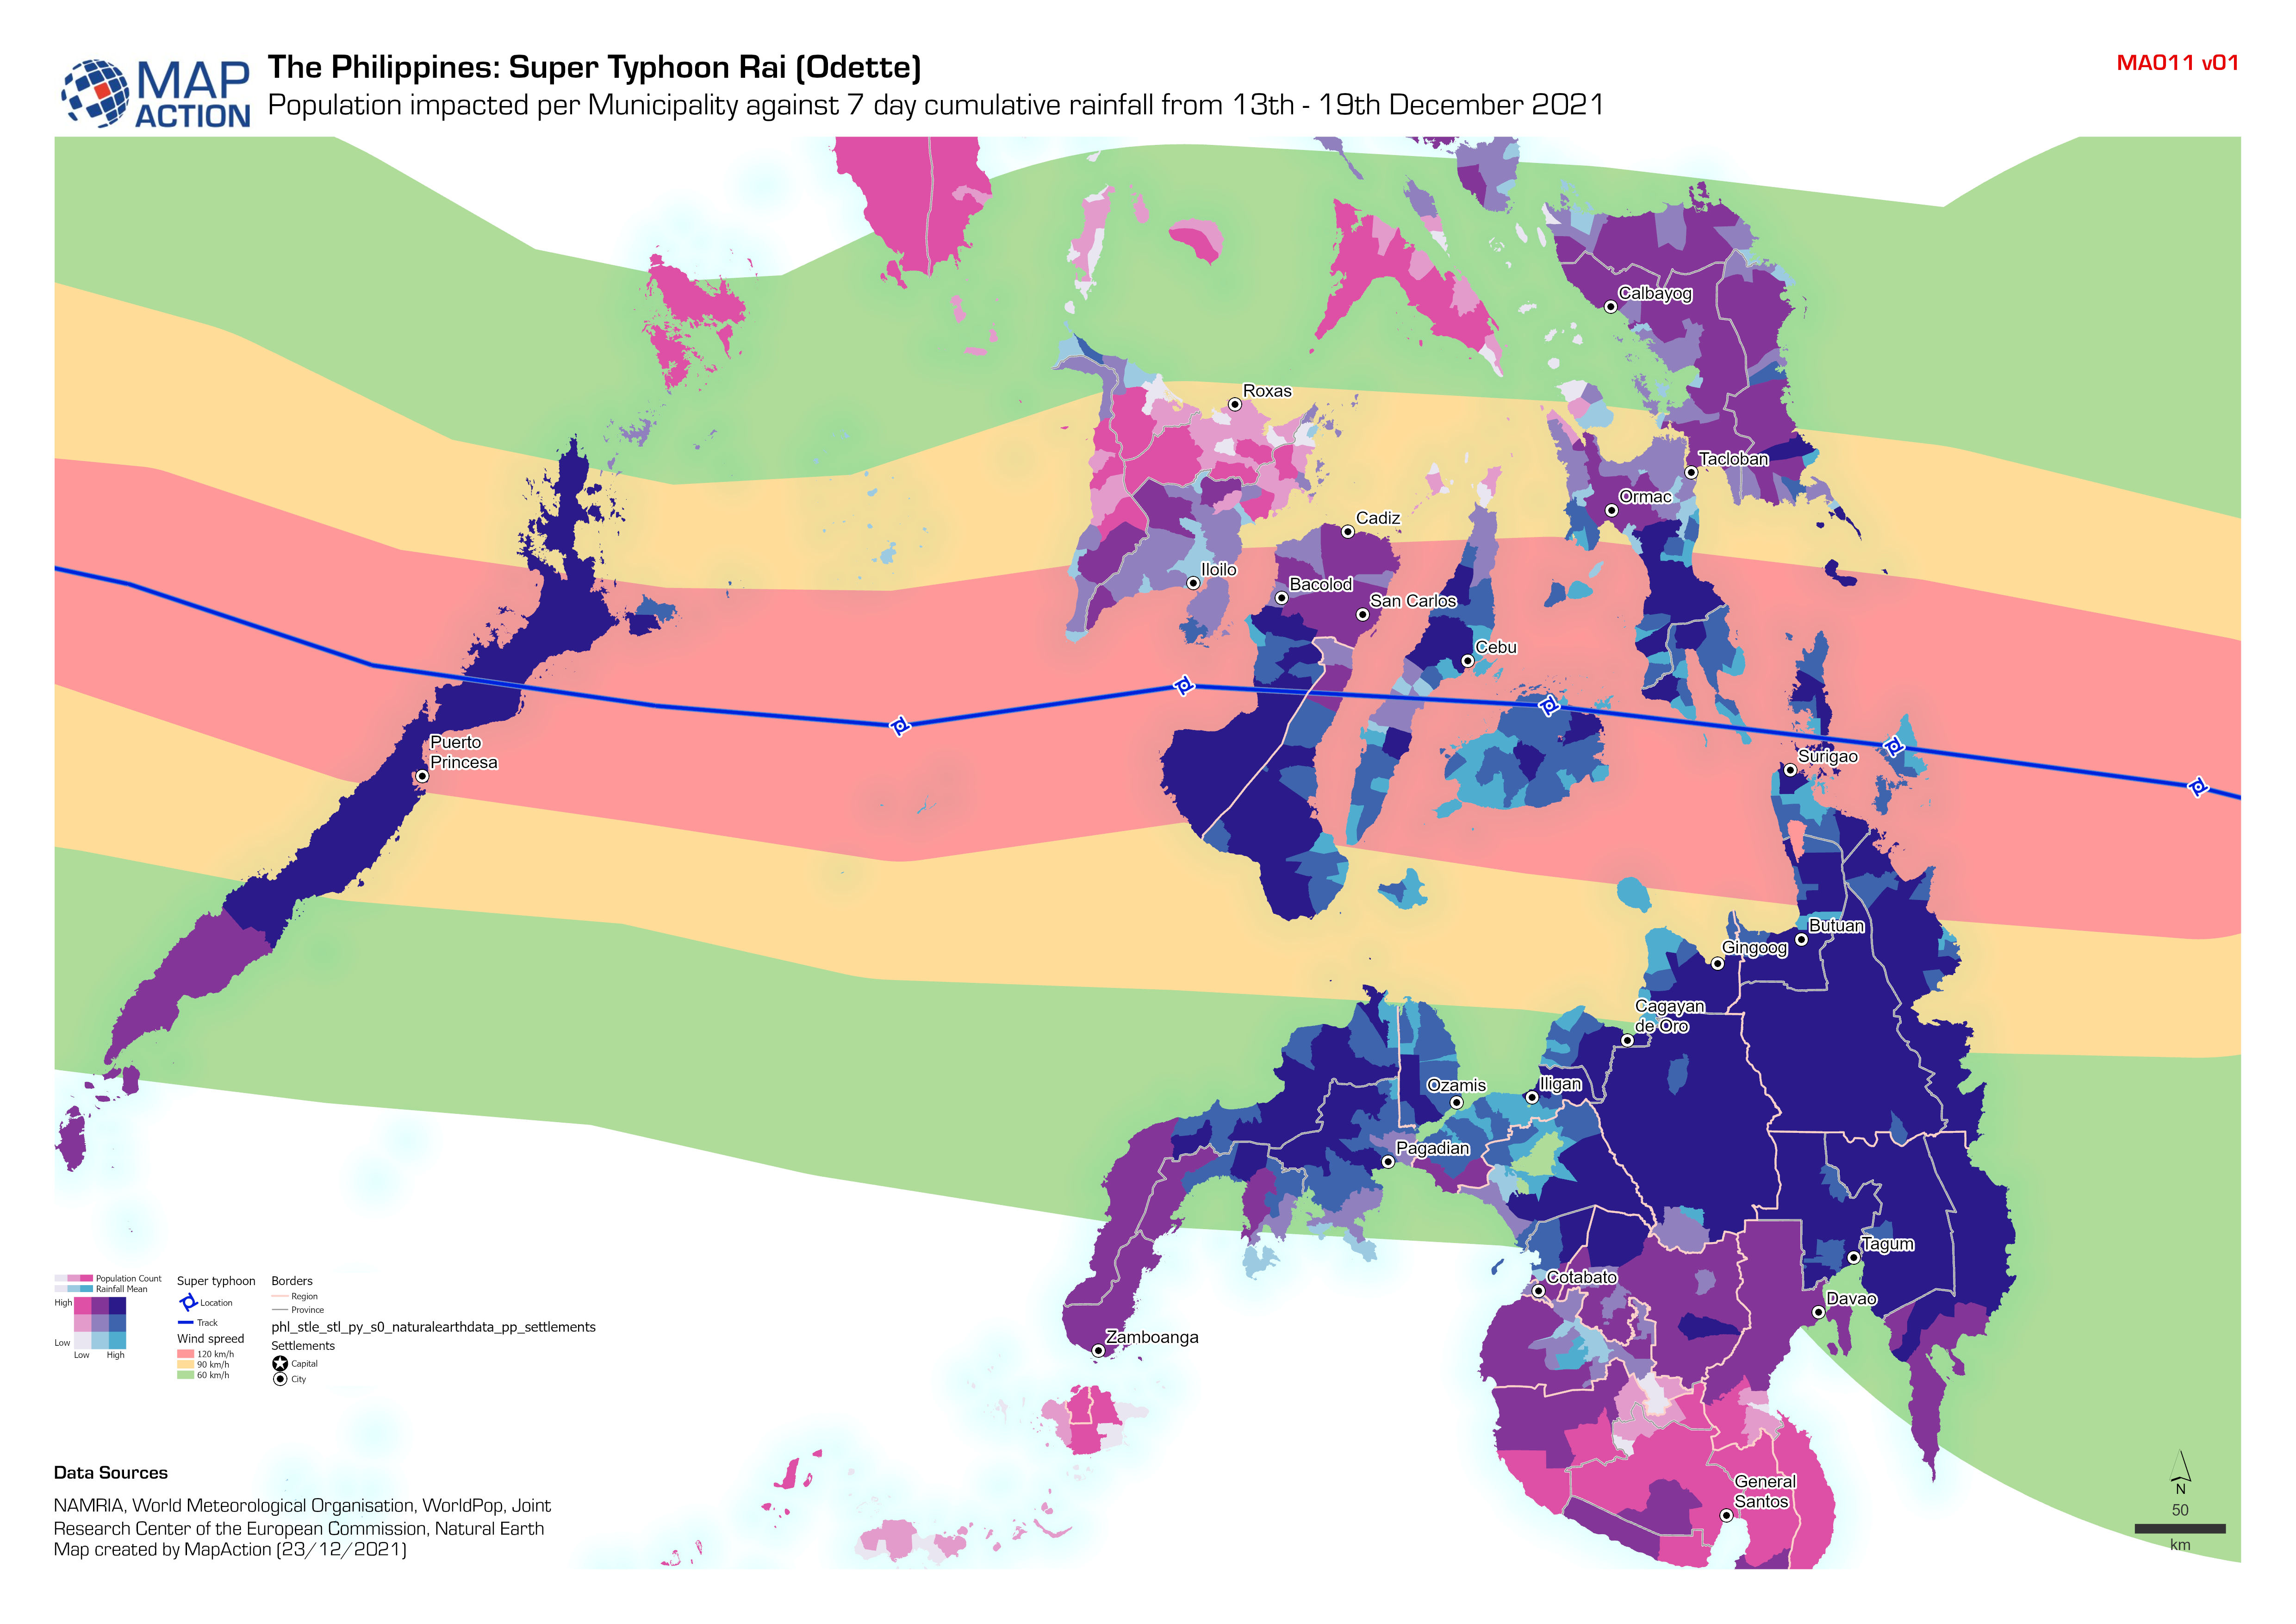
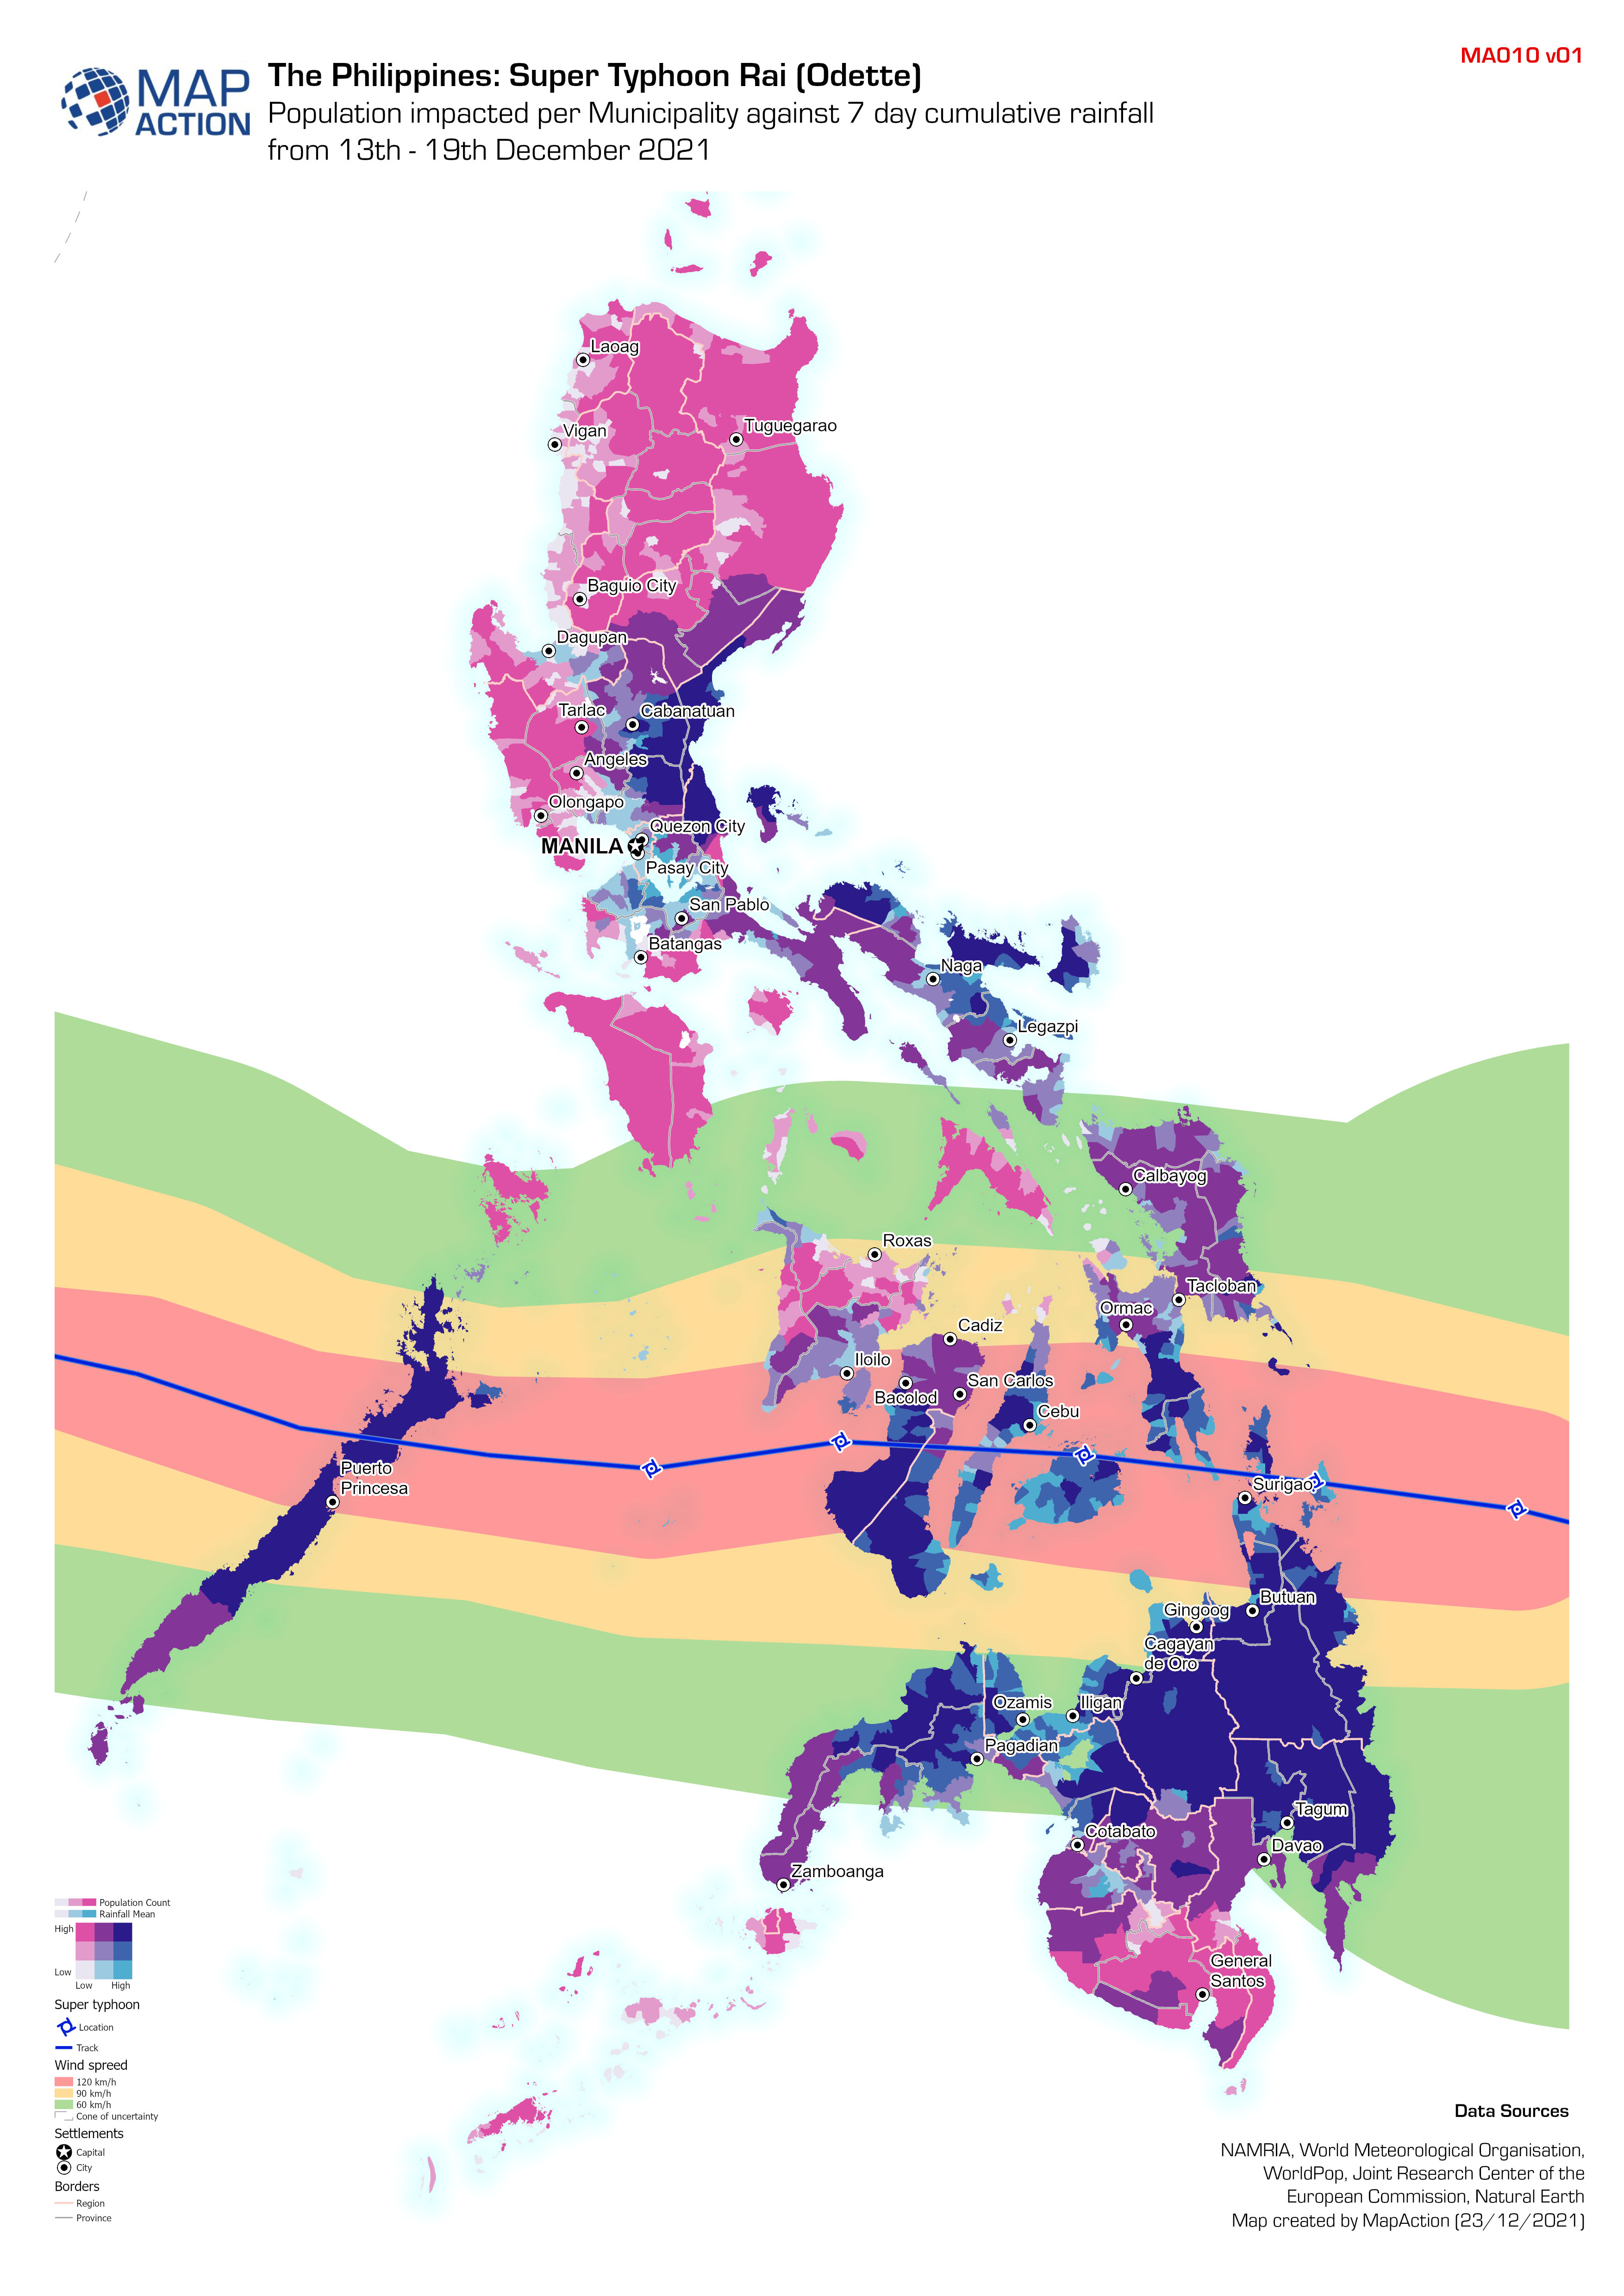
Population impacted per Municipality against 7 day cumulative rainfall from 1...
Bivariate analysis using the 7 day cumulative rainfall (from 13th - 19th December 2021) provided by the World Meteorological Organisation and the Municipality population using... -

Population impacted per Municipality against 7 day cumulative rainfall from 1...
Bivariate analysis using the 7 day cumulative rainfall (from 13th - 19th December 2021) provided by the World Meteorological Organisation and the Municipality population using... -

Affected population by Municipality (as of 08:00, 22 Dec 21)
Map shows the affected population per Municipality (admin 3). -
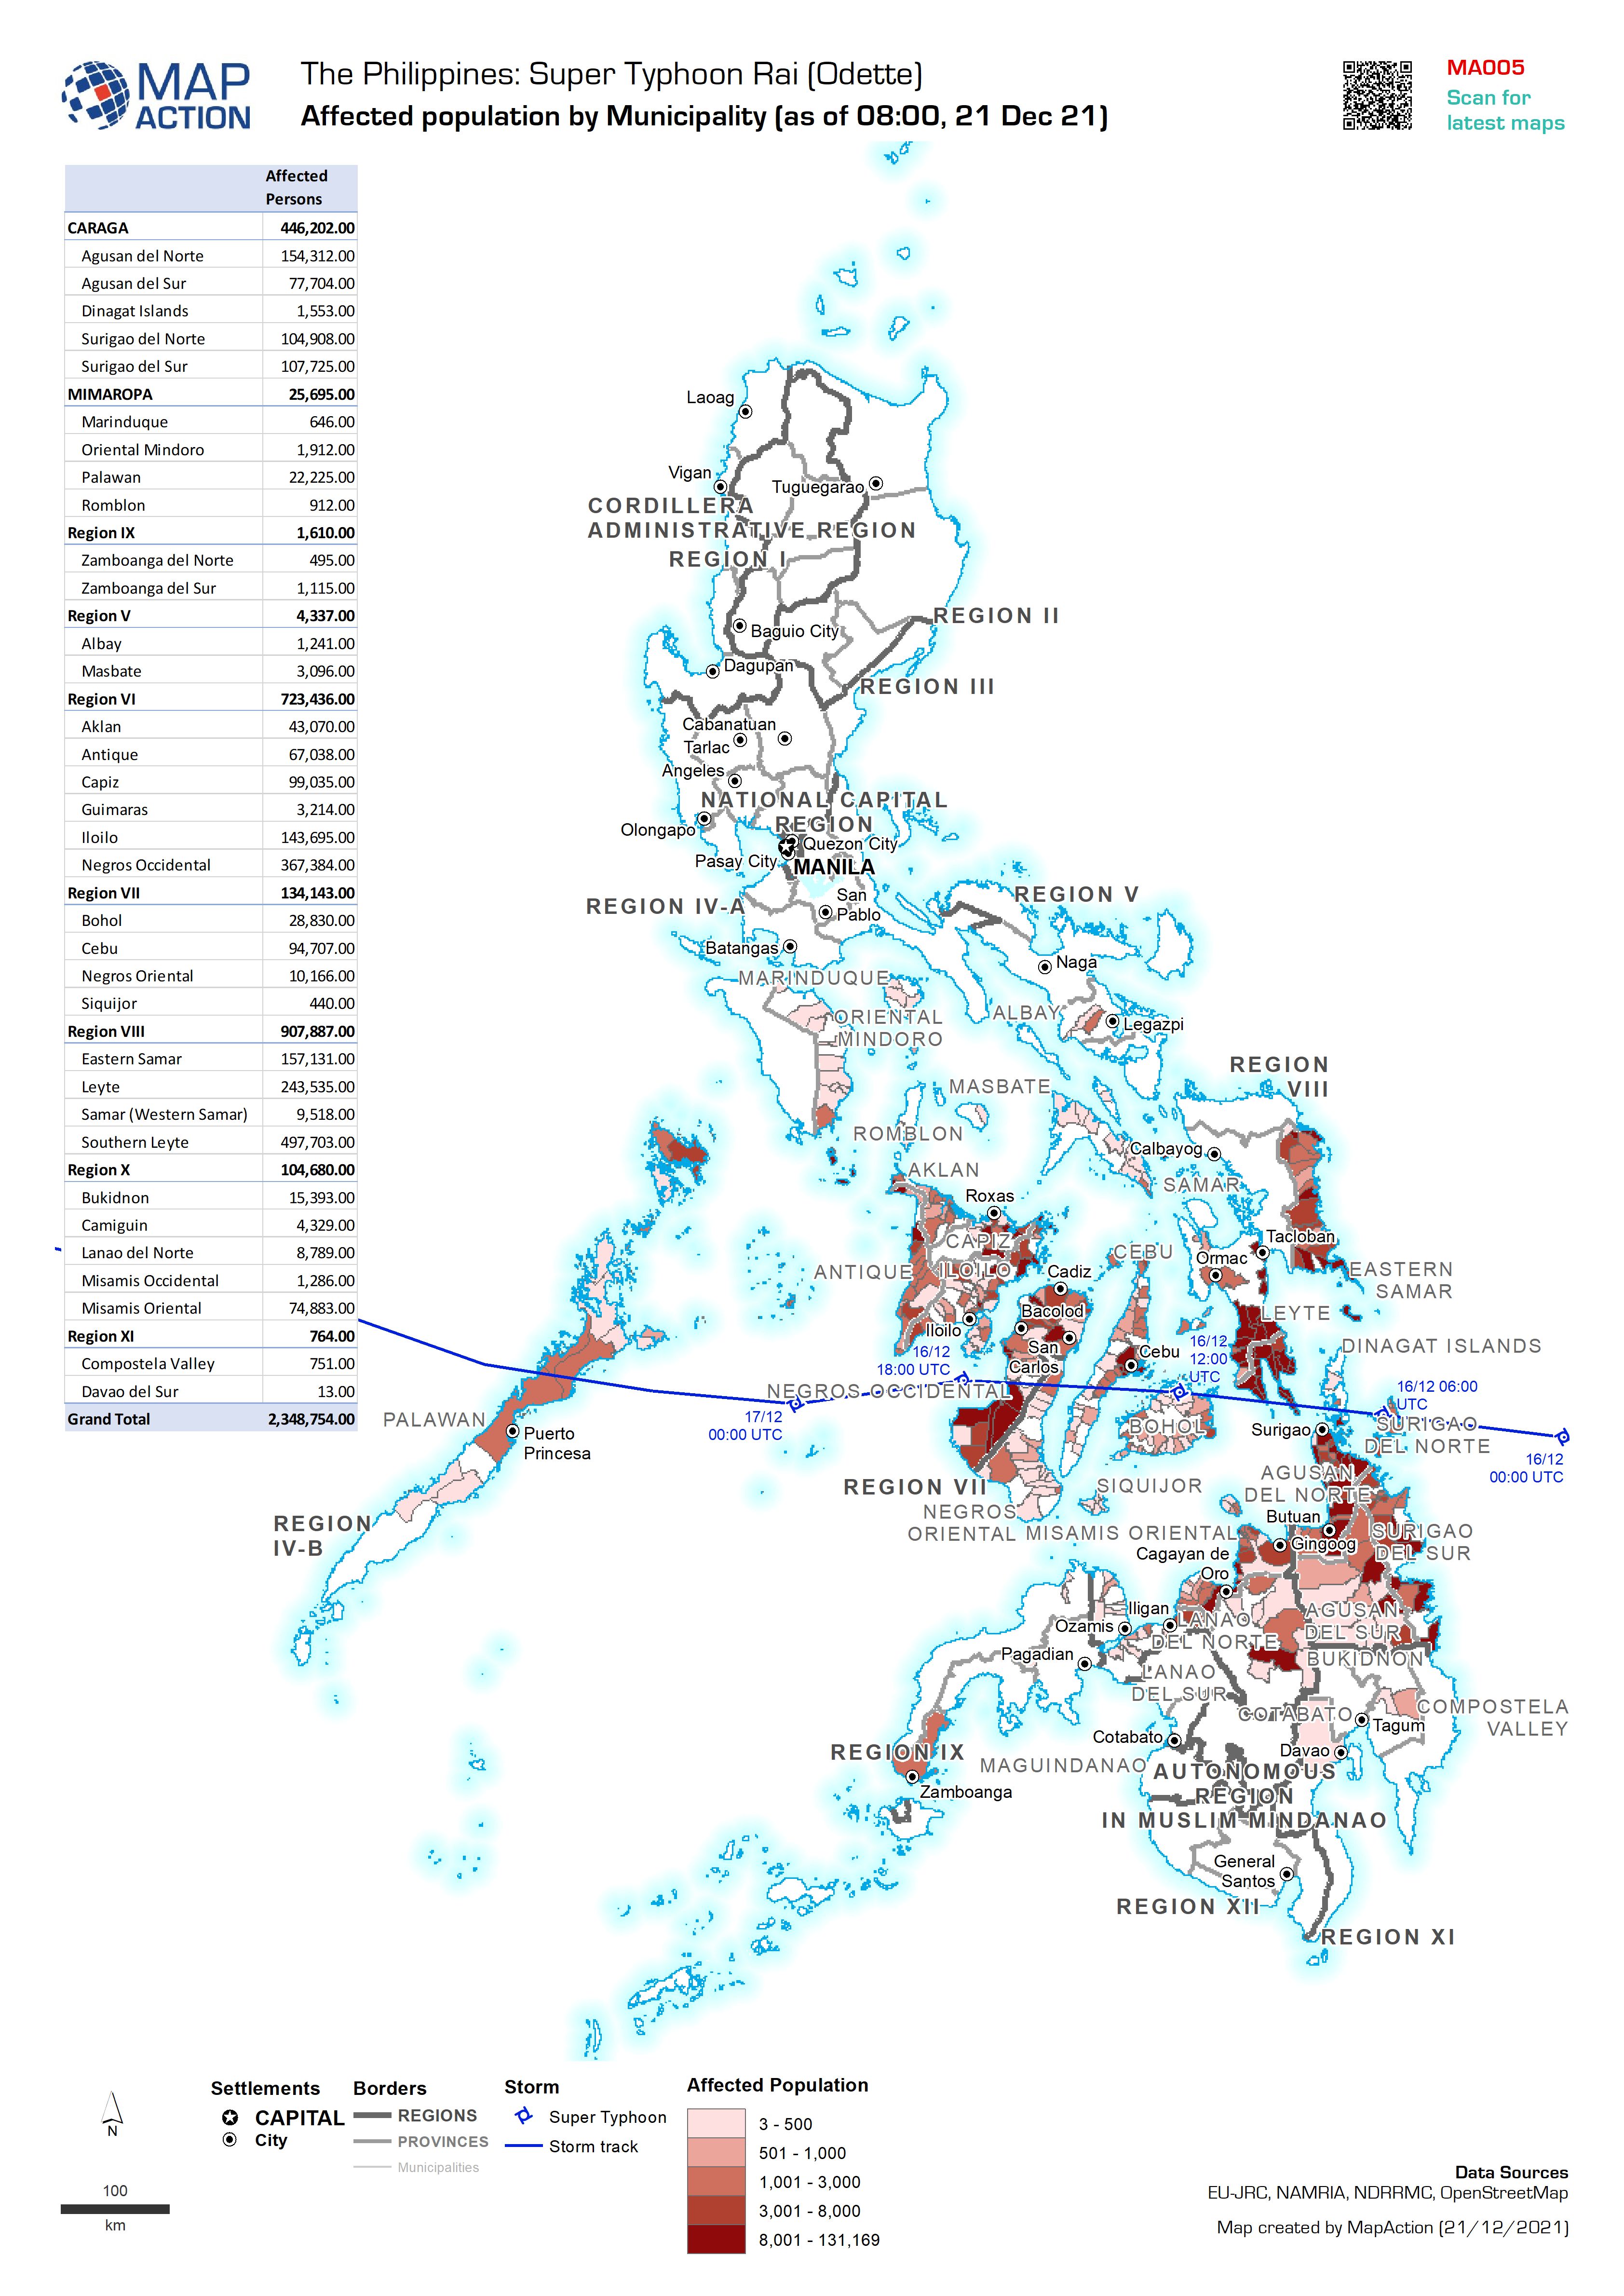
Affected population by Municipality (as of 08:00, 21 Dec 21)
Map shows the affected population per Municipality (admin 3). -

Areas of Control and Conflict Induced Displacement
Areas of influence and arrivals of conflict-displaced Afghans by province in 2021 -
Earthquake Casualties and Damage - Figures received on 24/08/2021
Département: Map showing earthquake damage and casualties with numbers from the Haitian Civil Protection General Directorate (DGPC). Figures were received on 24 Aug 2021. -

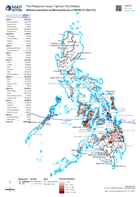
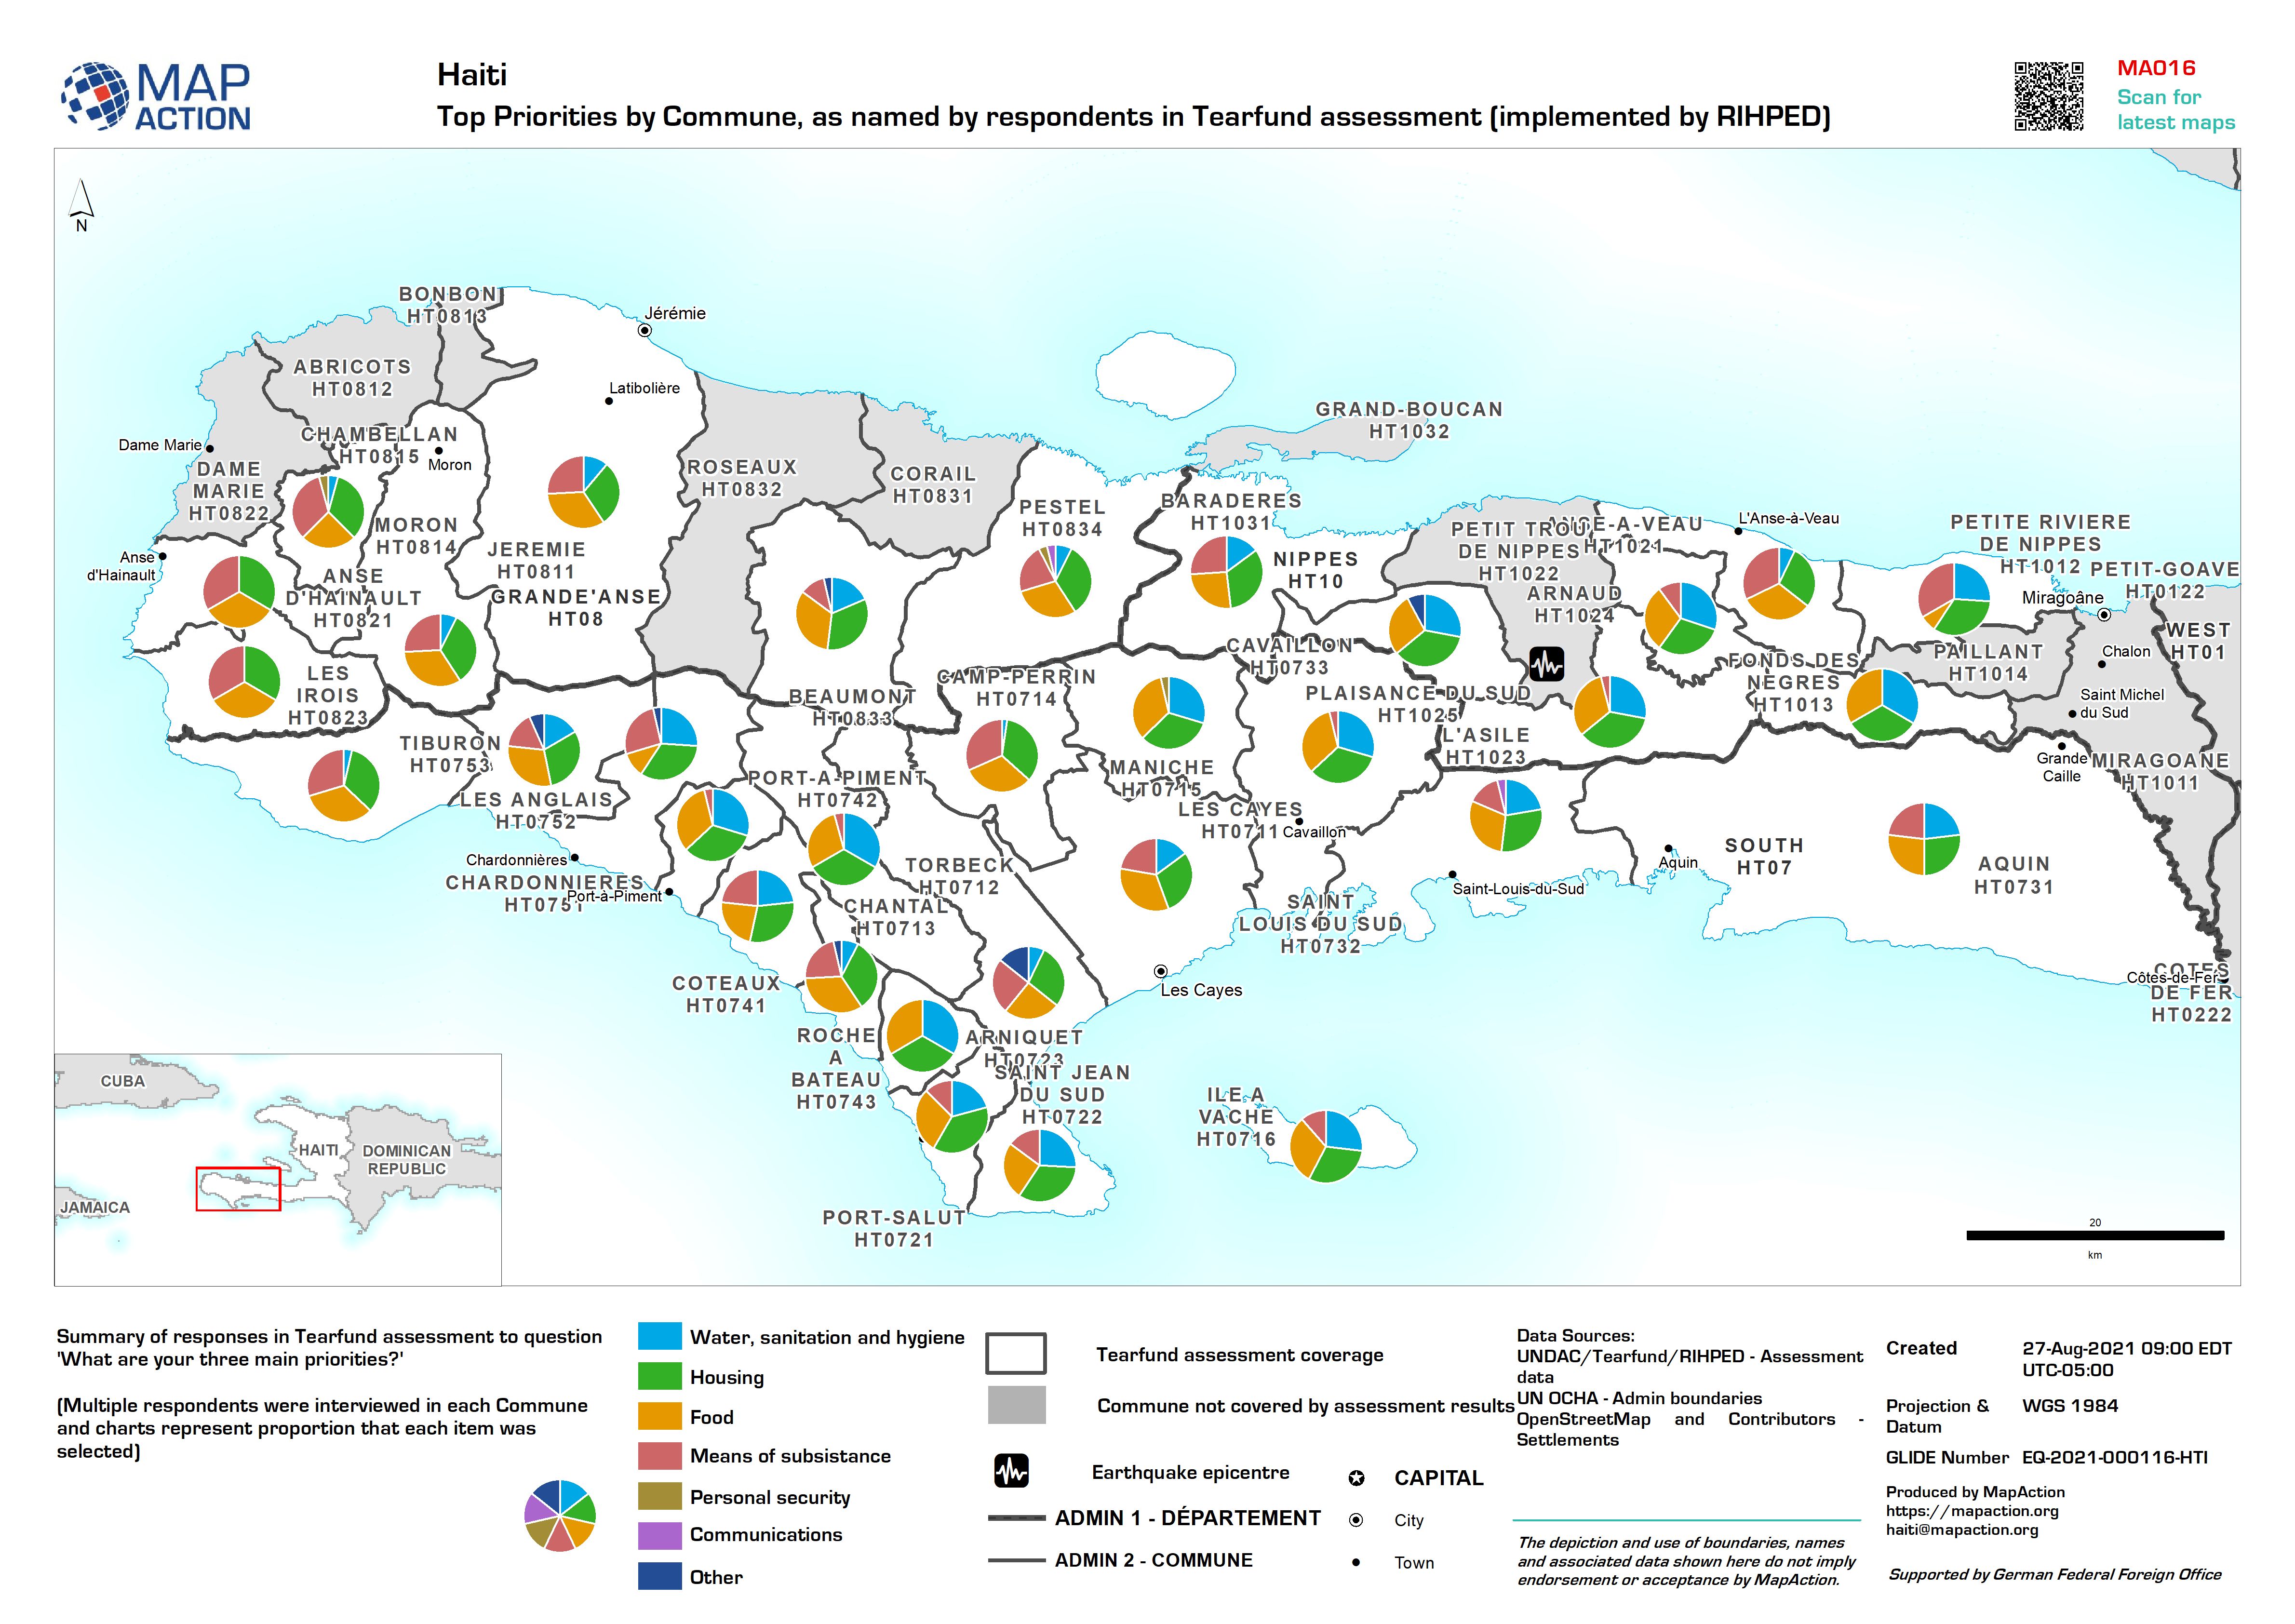
Top Priorities by Commune, as named by respondents in Tearfund assessment (im...
Summary of responses in Tearfund assessment to question 'What are your three main priorities?' (Multiple respondents were interviewed in each Commune and charts represent... -

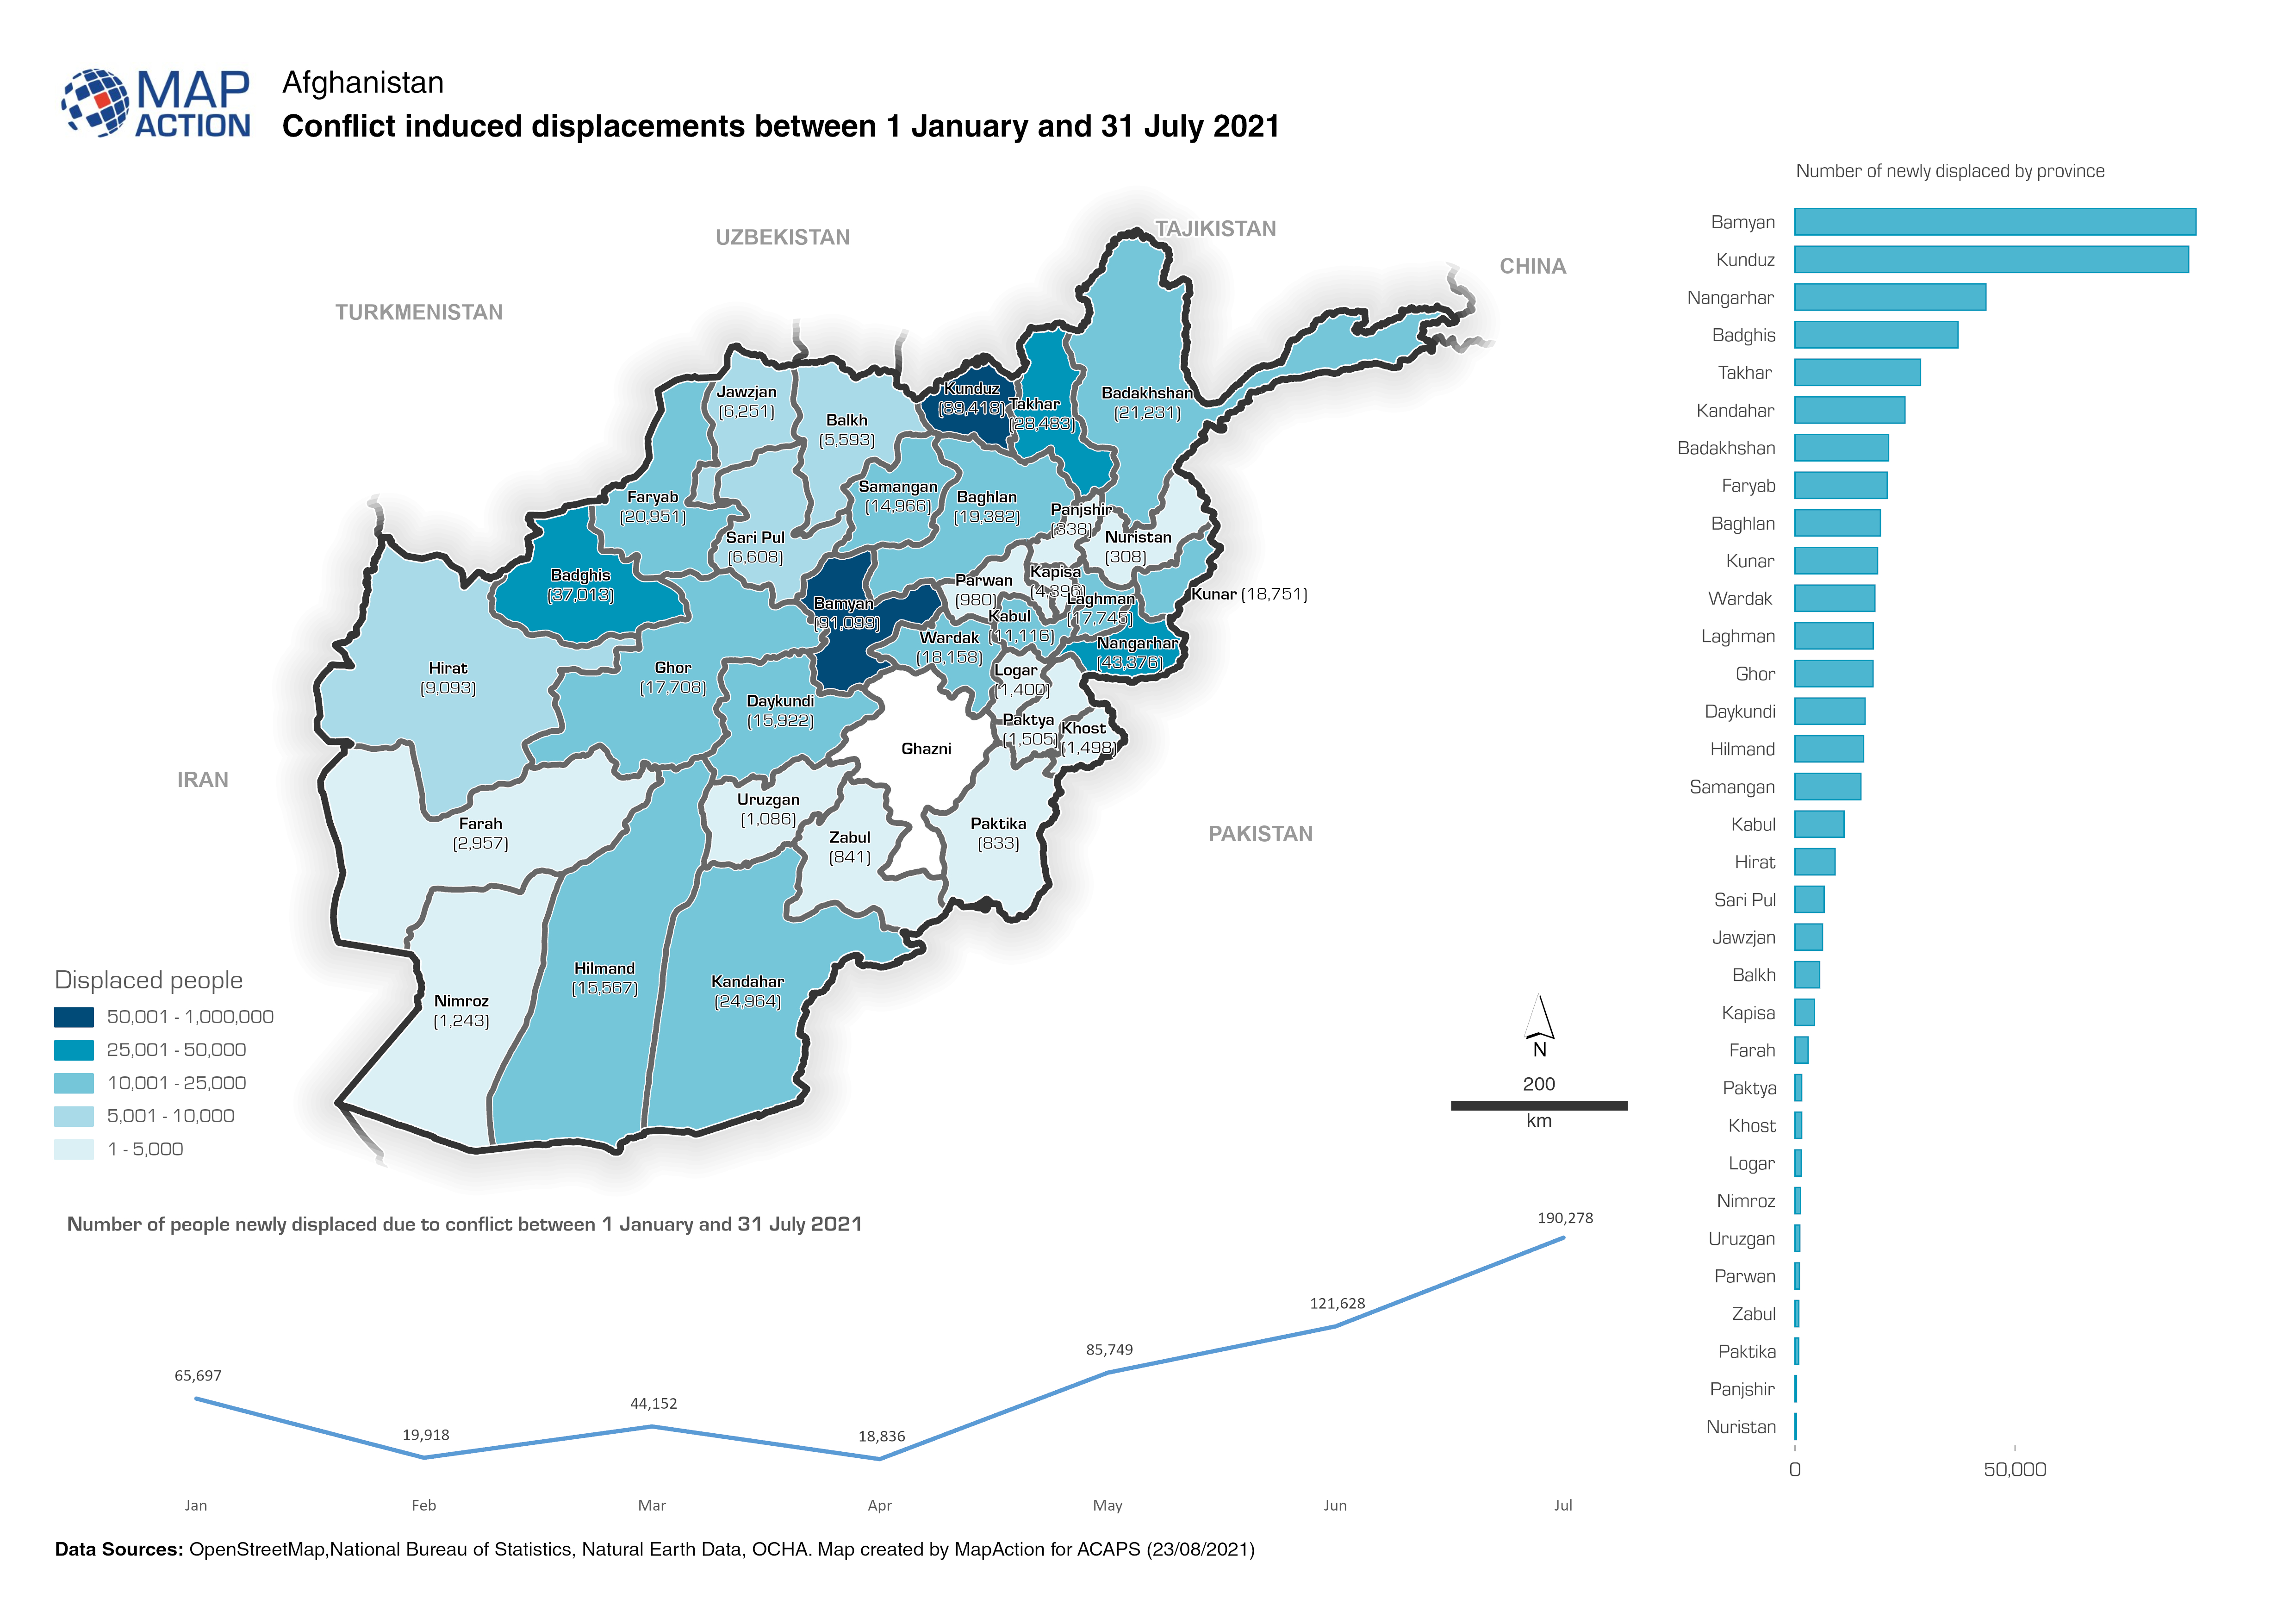
Afghanistan: Conflict induced displacements between 1 January and 31 July 2021
Map shows the number of people newly displaced due to conflict between 1 January and 31 July 2021 -

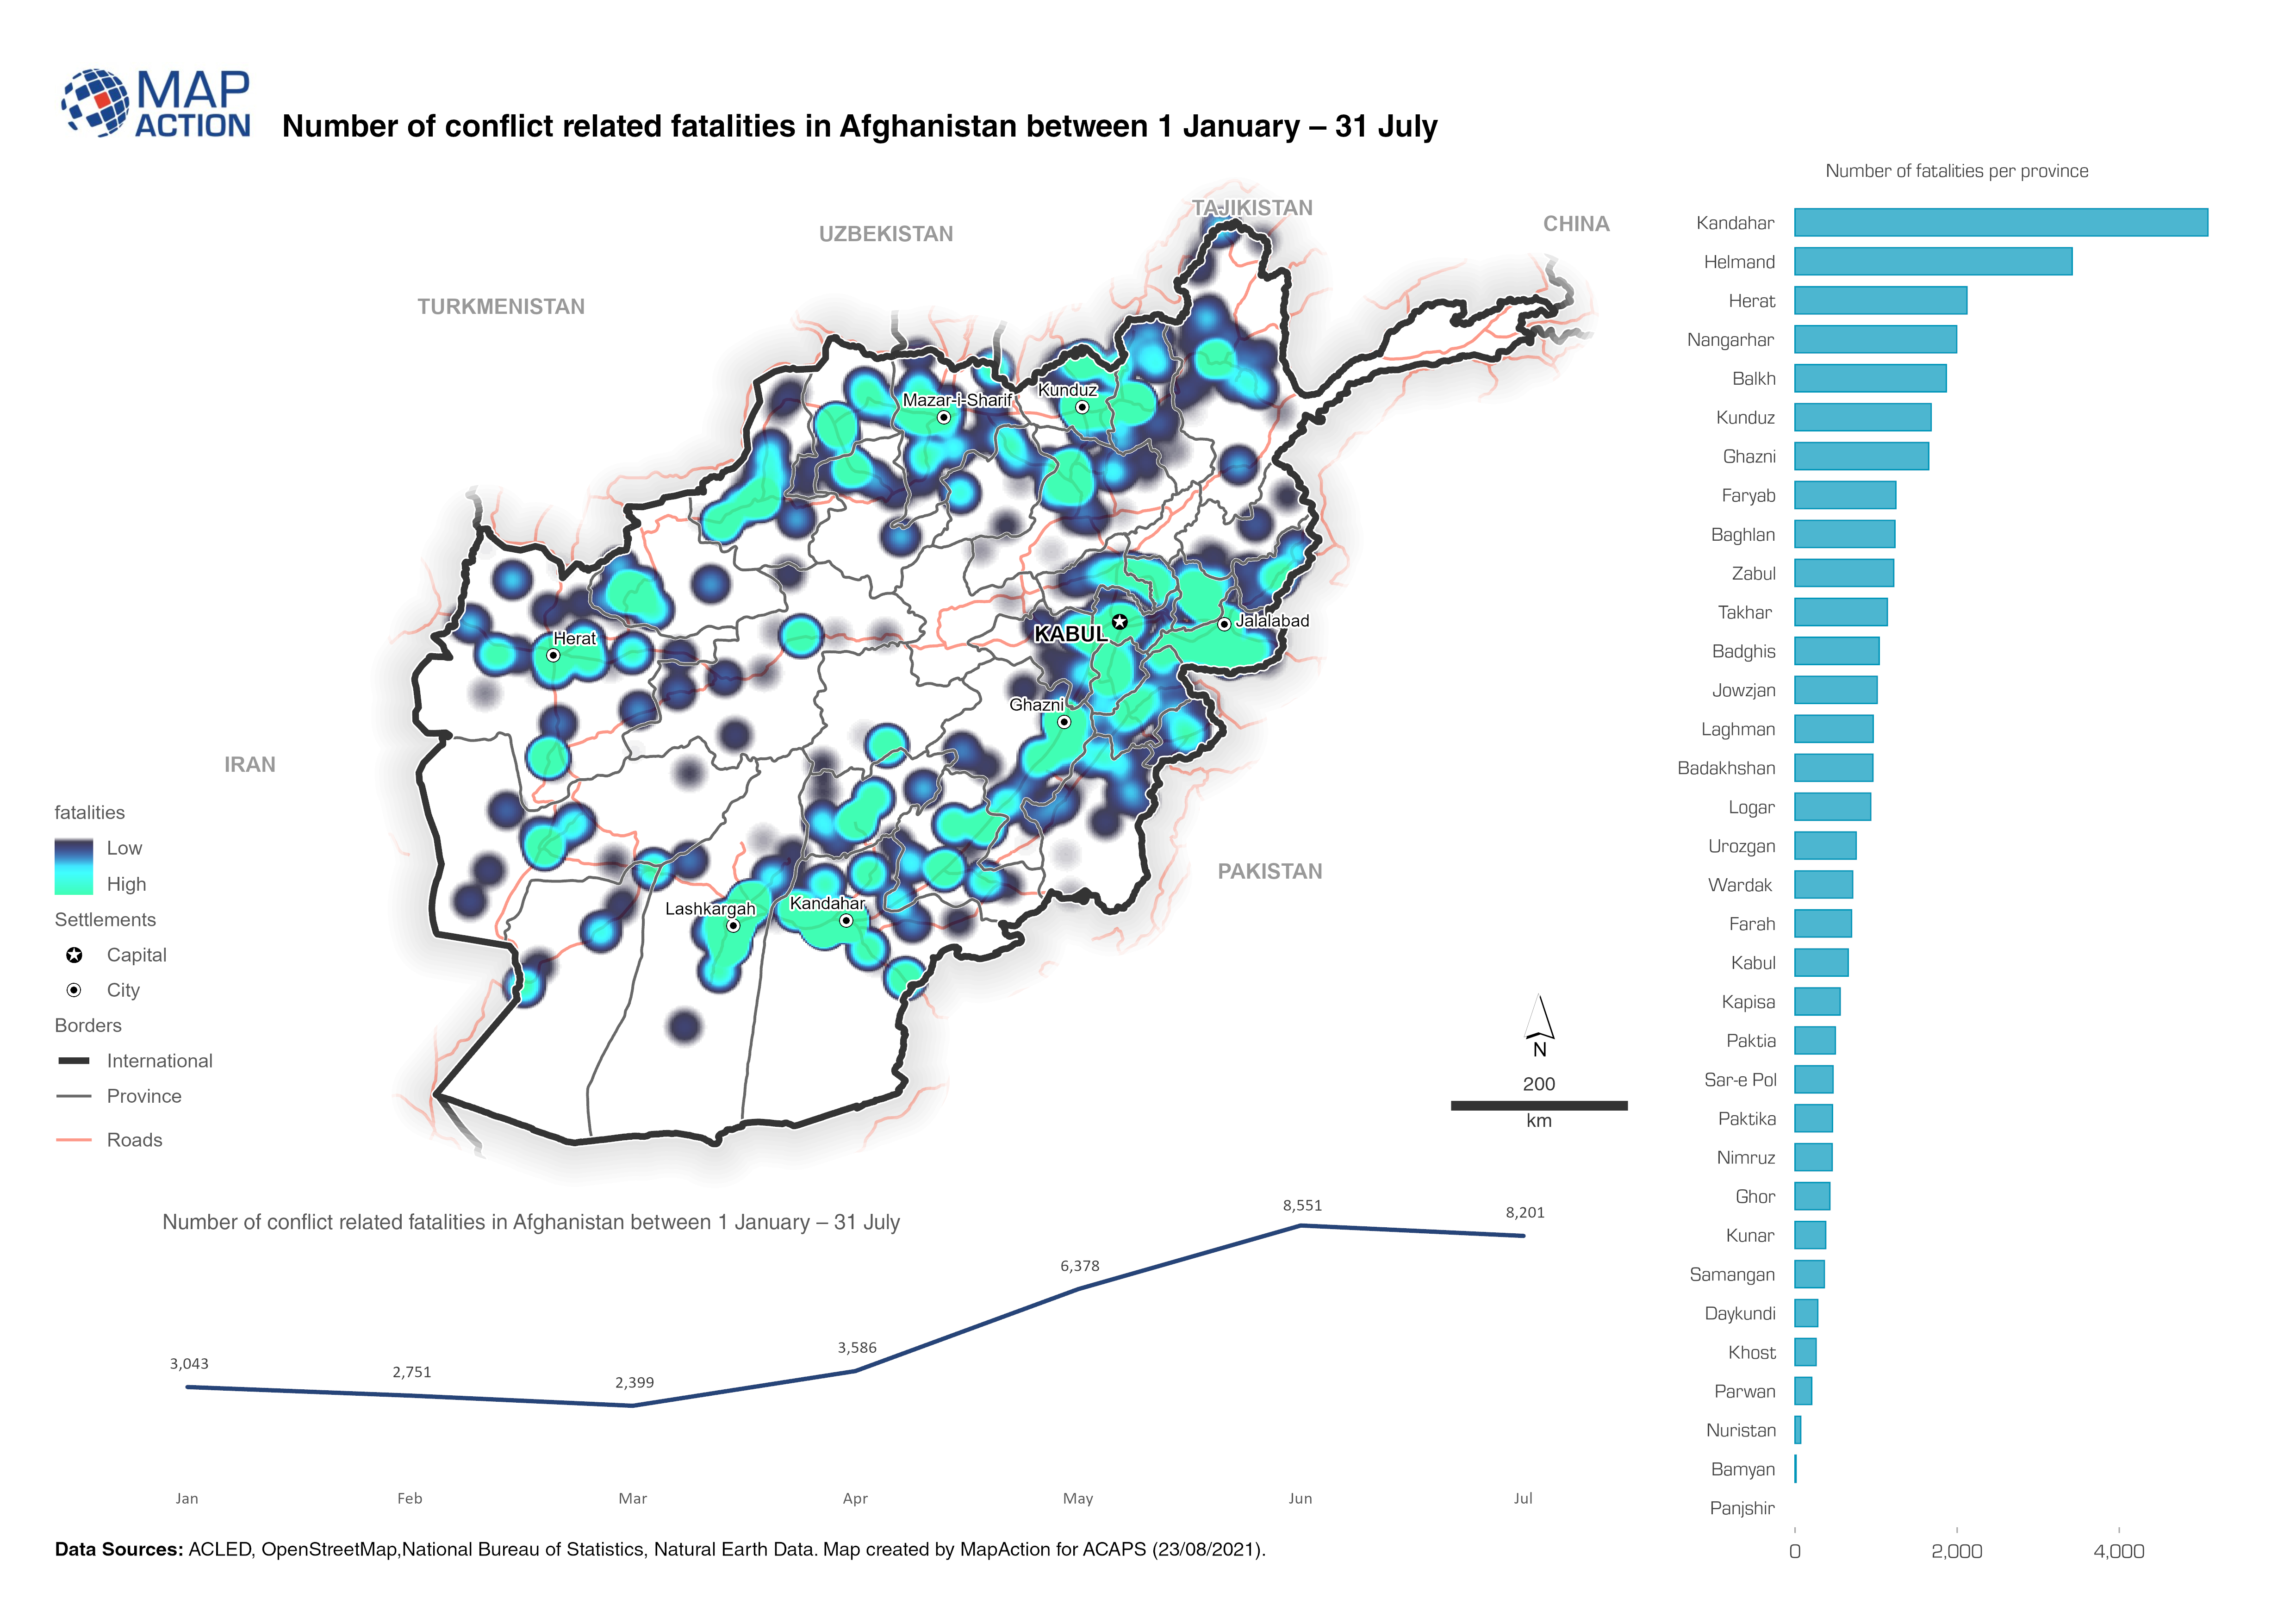
Afghanistan: Number of fatalities per event type (1 January to 31 July 2021)
The map provides an overview of different security related incidents and fatalities.
