-

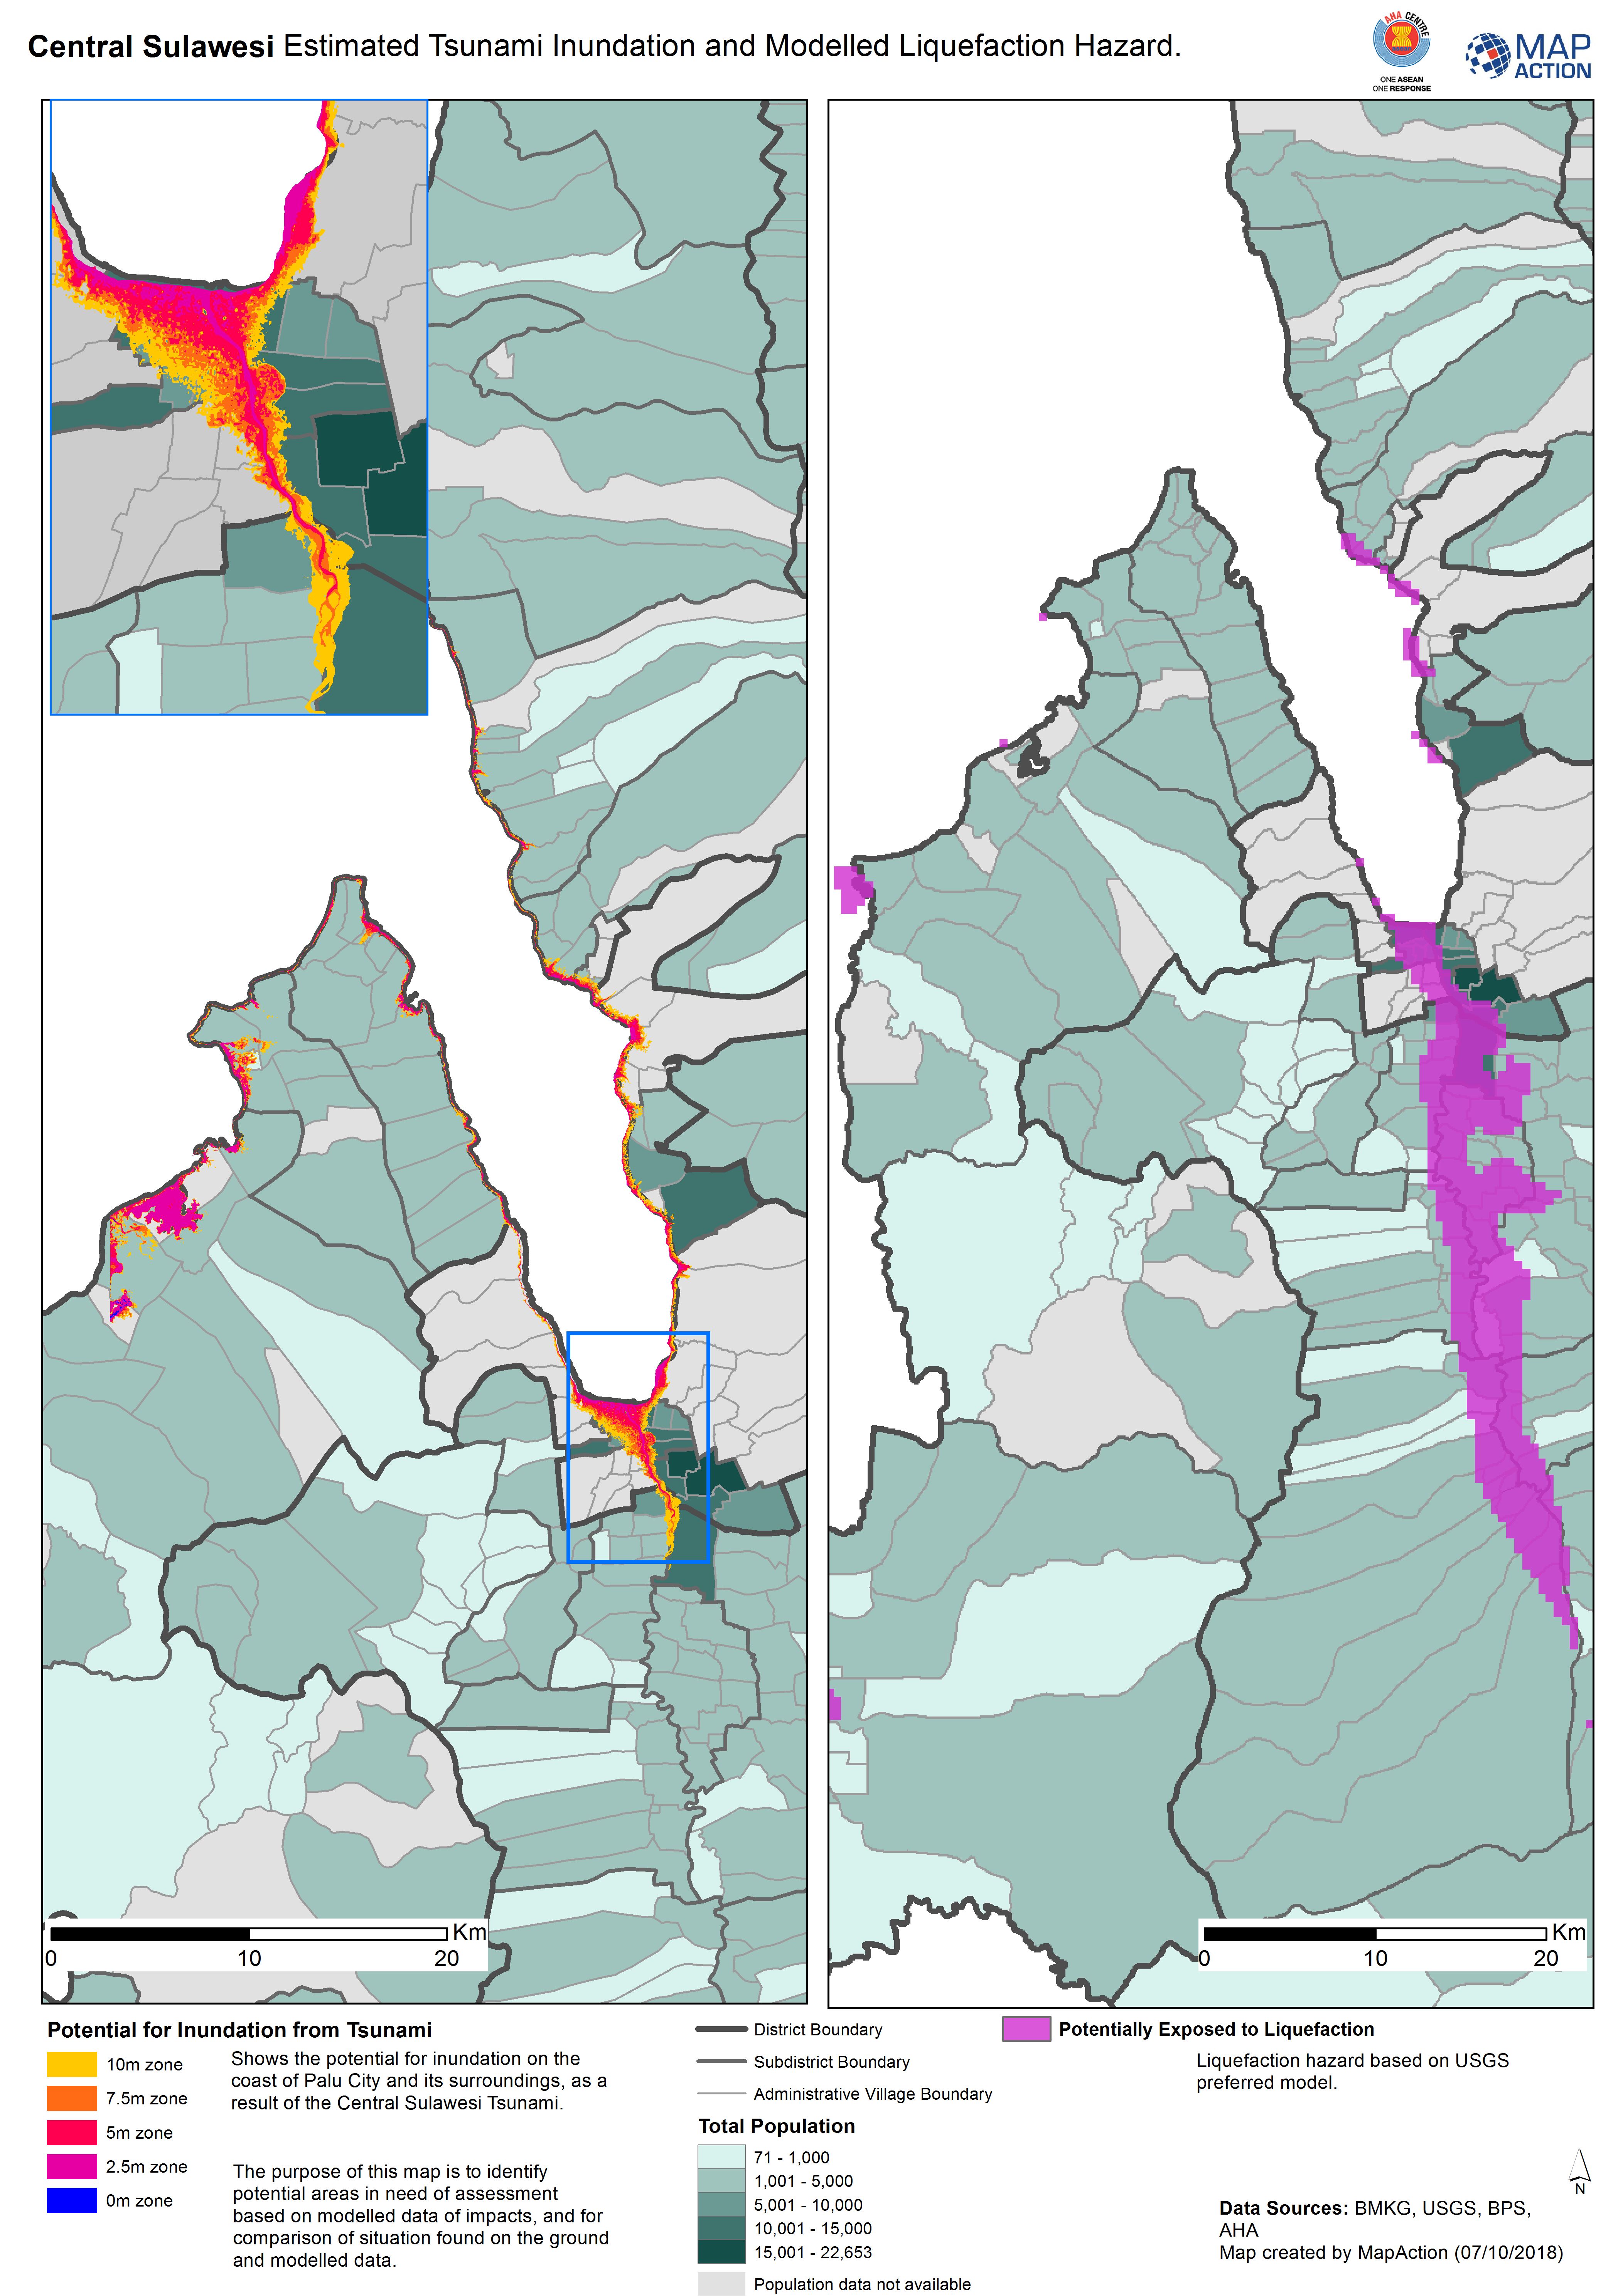
Central Sulawesi Estimated Tsunami Inundation and Modelled Liquefaction Hazard.
Shows the potential for inundation on the coast of Palu City and its surroundings, as a result of the Central Sulawesi Tsunami. The purpose of this map is to identify potential... -
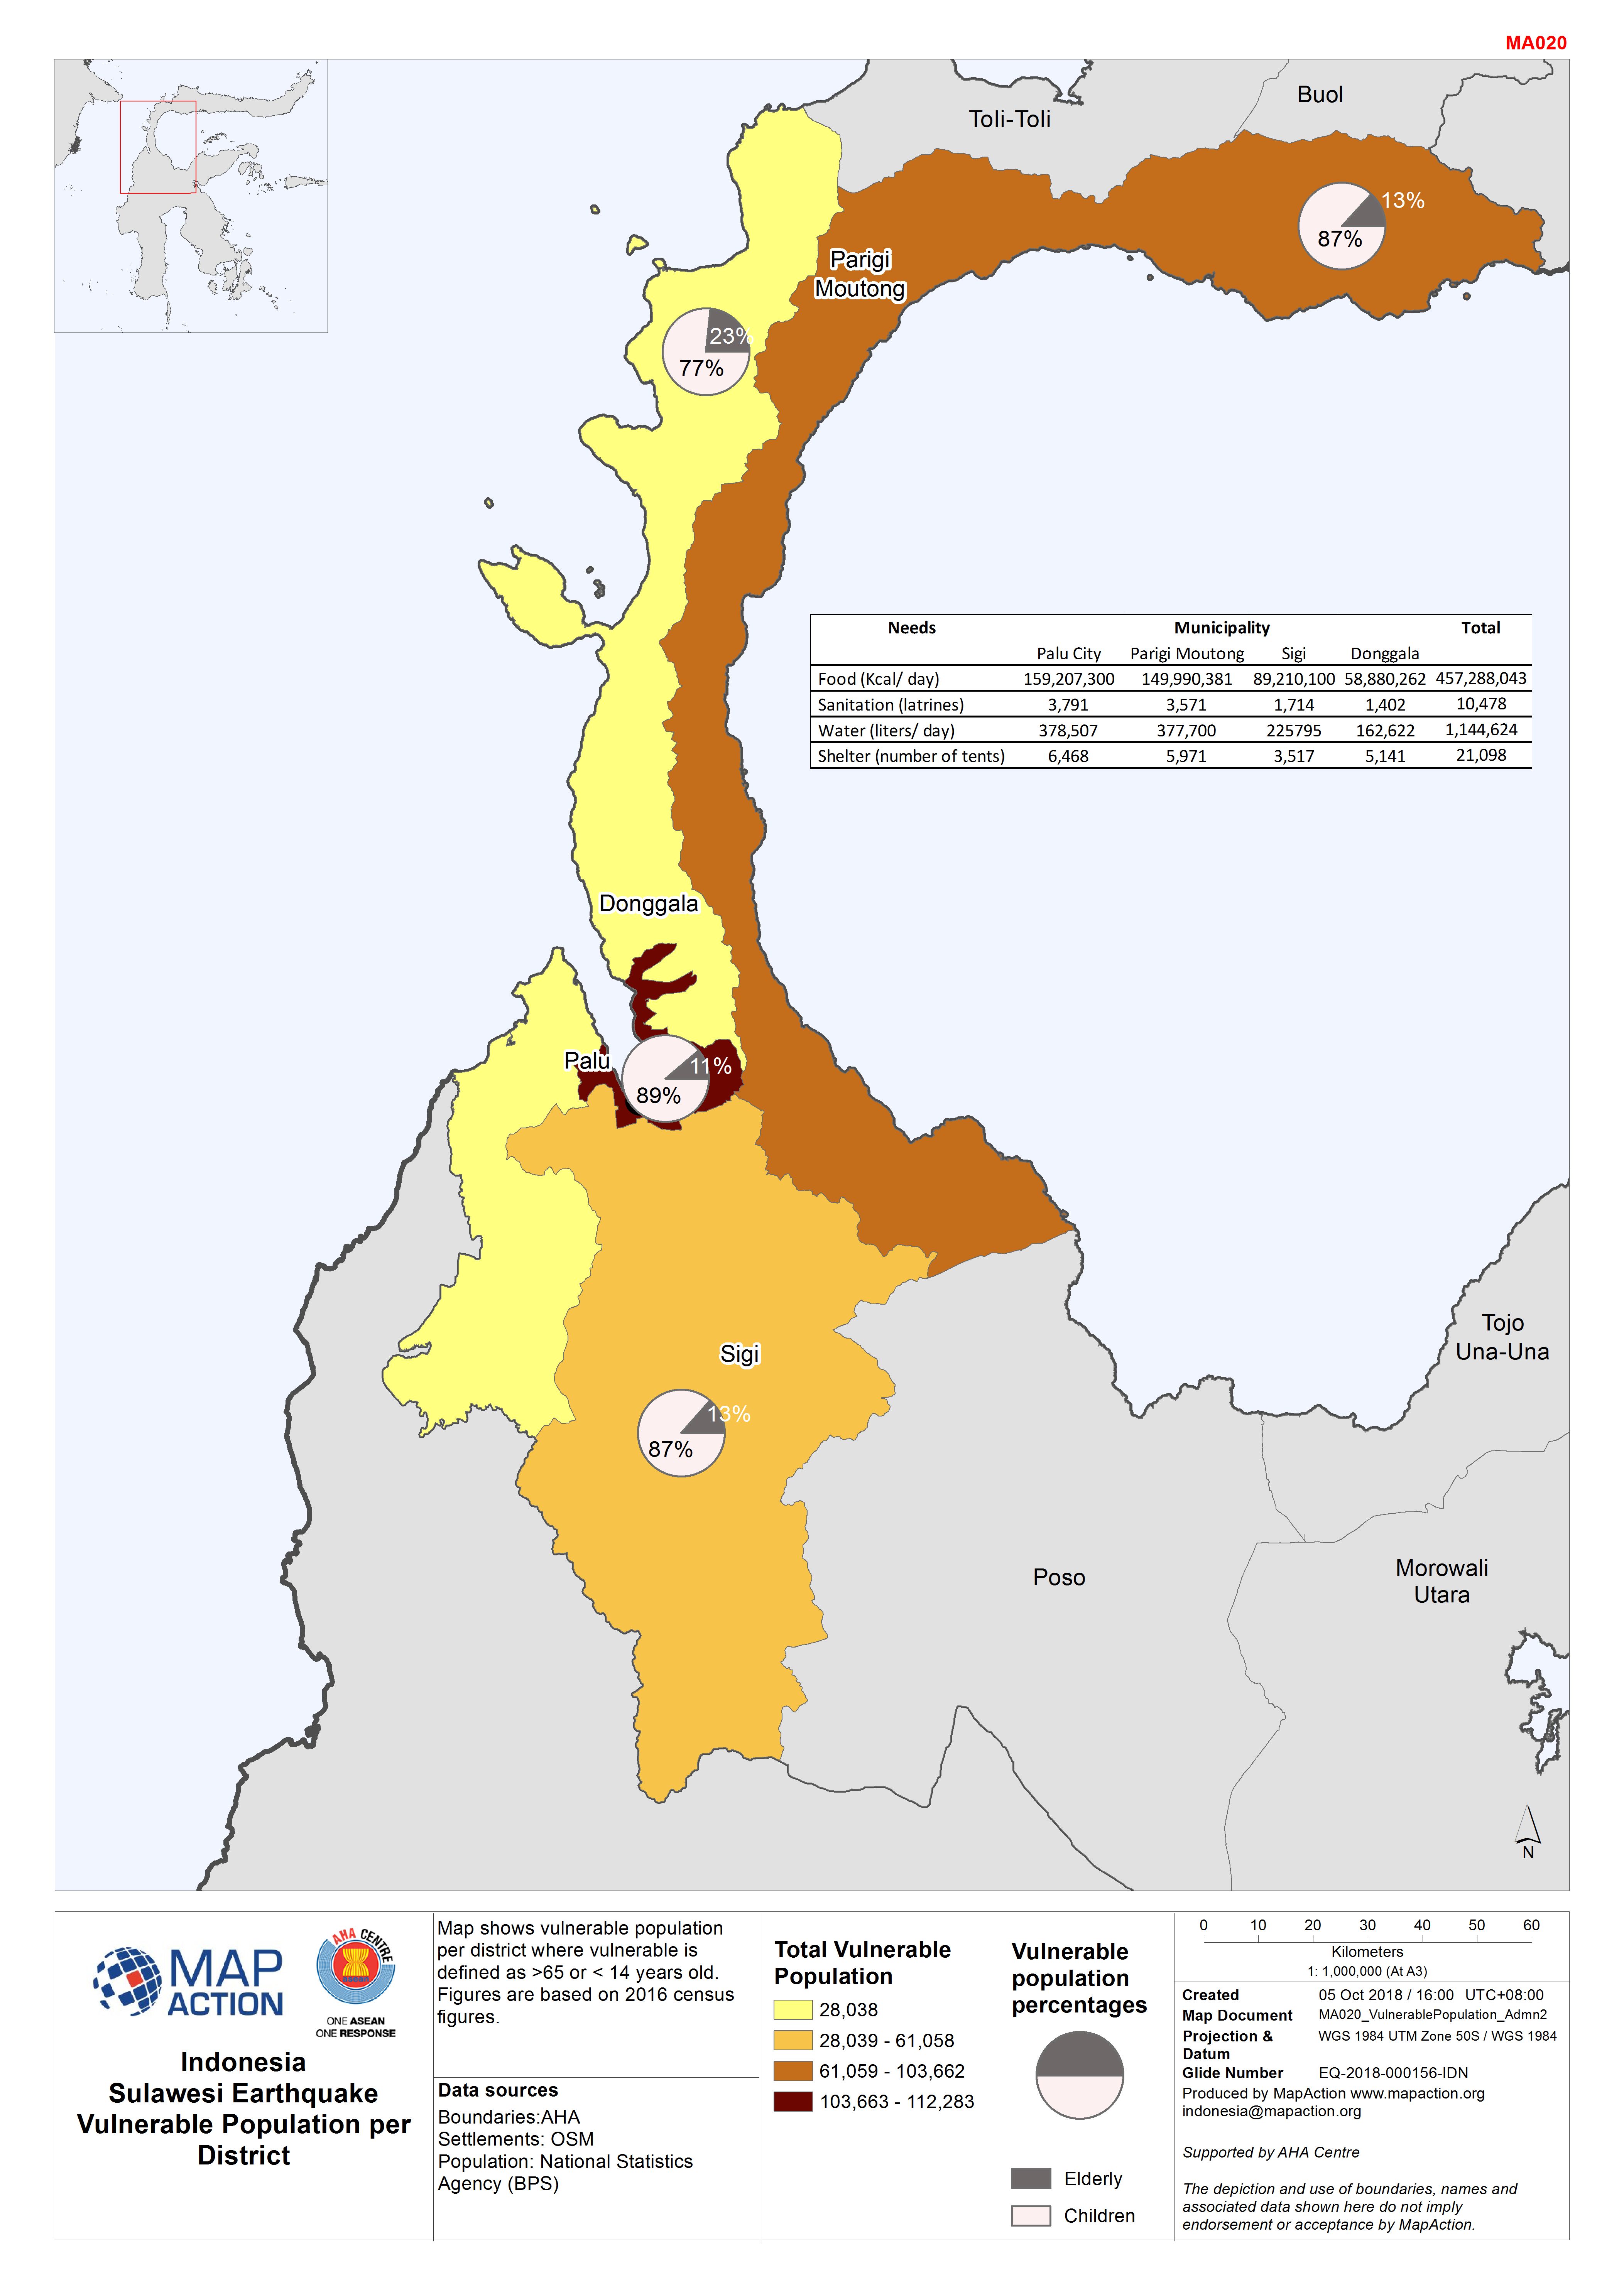
Indonesia Sulawesi Earthquake Vulnerable Population per District
Map shows vulnerable population per district where vulnerable is defined as >65 or < 14 years old. Figures are based on 2016 census figures. -
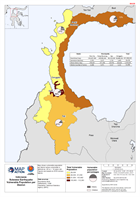
Indonesia Sulawesi Earthquake Estimated caseload per subdistrict in the Sigi ...
Map shows the 2016 Total Population and number of households per subdistrict (admin level 3) for the Sigi Region of Central Sulawesi. The estimated vulnerable population per... -

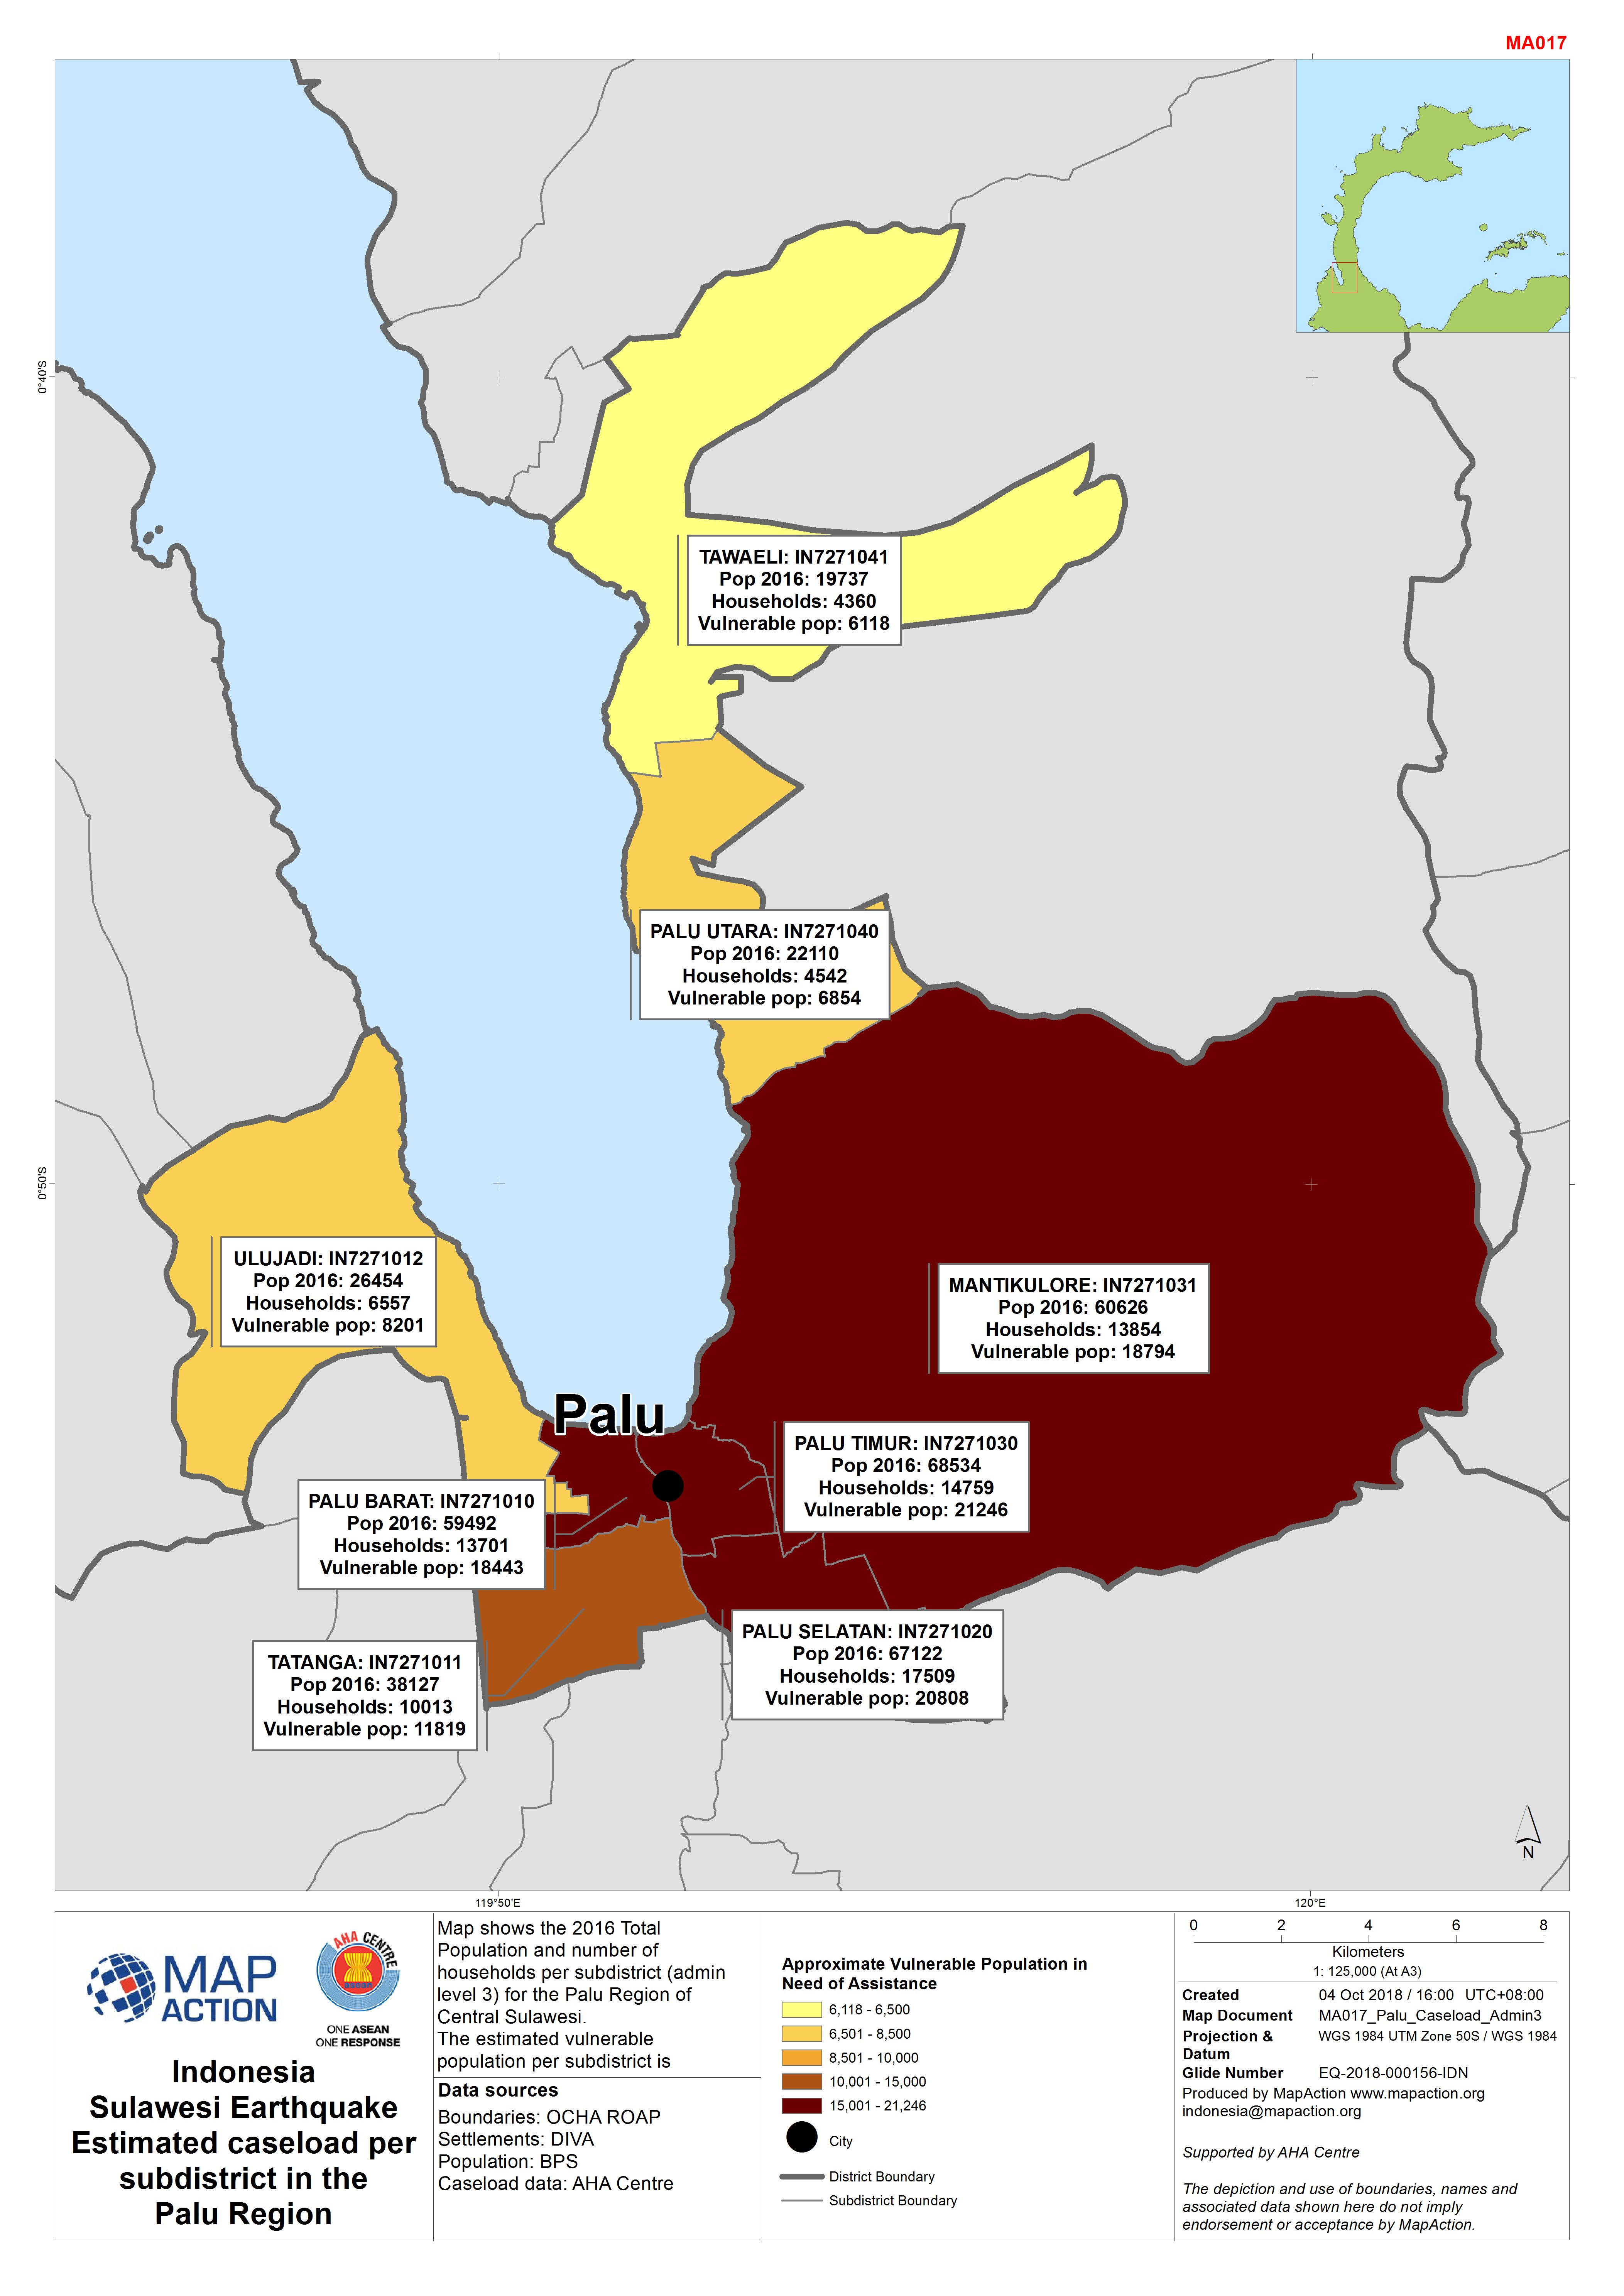
Indonesia Sulawesi Earthquake Estimated caseload per subdistrict in the Palu ...
Map shows the 2016 Total Population and number of households per subdistrict (admin level 3) for the Palu Region of Central Sulawesi. The estimated vulnerable population per... -

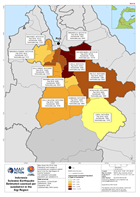
Indonesia Sulawesi Earthquake Estimated caseload per subdistrict in the Dongg...
Map shows the 2016 Total Population and number of households per subdistrict (admin level 3) for the Donggala Region of Central Sulawesi. The estimated vulnerable population... -
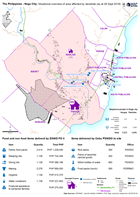
The Philippines - Naga City: Situational overview of area affected by landsli...
Map shows the affected areas, number of displaced and location of the evacuation centres being used as a result of the landslide to hit Naga city. The table below shows the... -
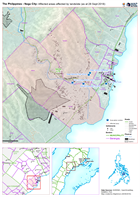
The Philippines - Naga City: Affected areas affected by landslide (as at 28 S...
Map shows the affected by the landslide in Naga City, Cebu. -

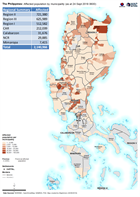
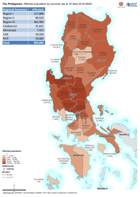
The Philippines: Affected population by municipality (as at 28 Sept 2018 0600)
Map shows the reported number of affected people per province. -

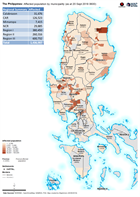
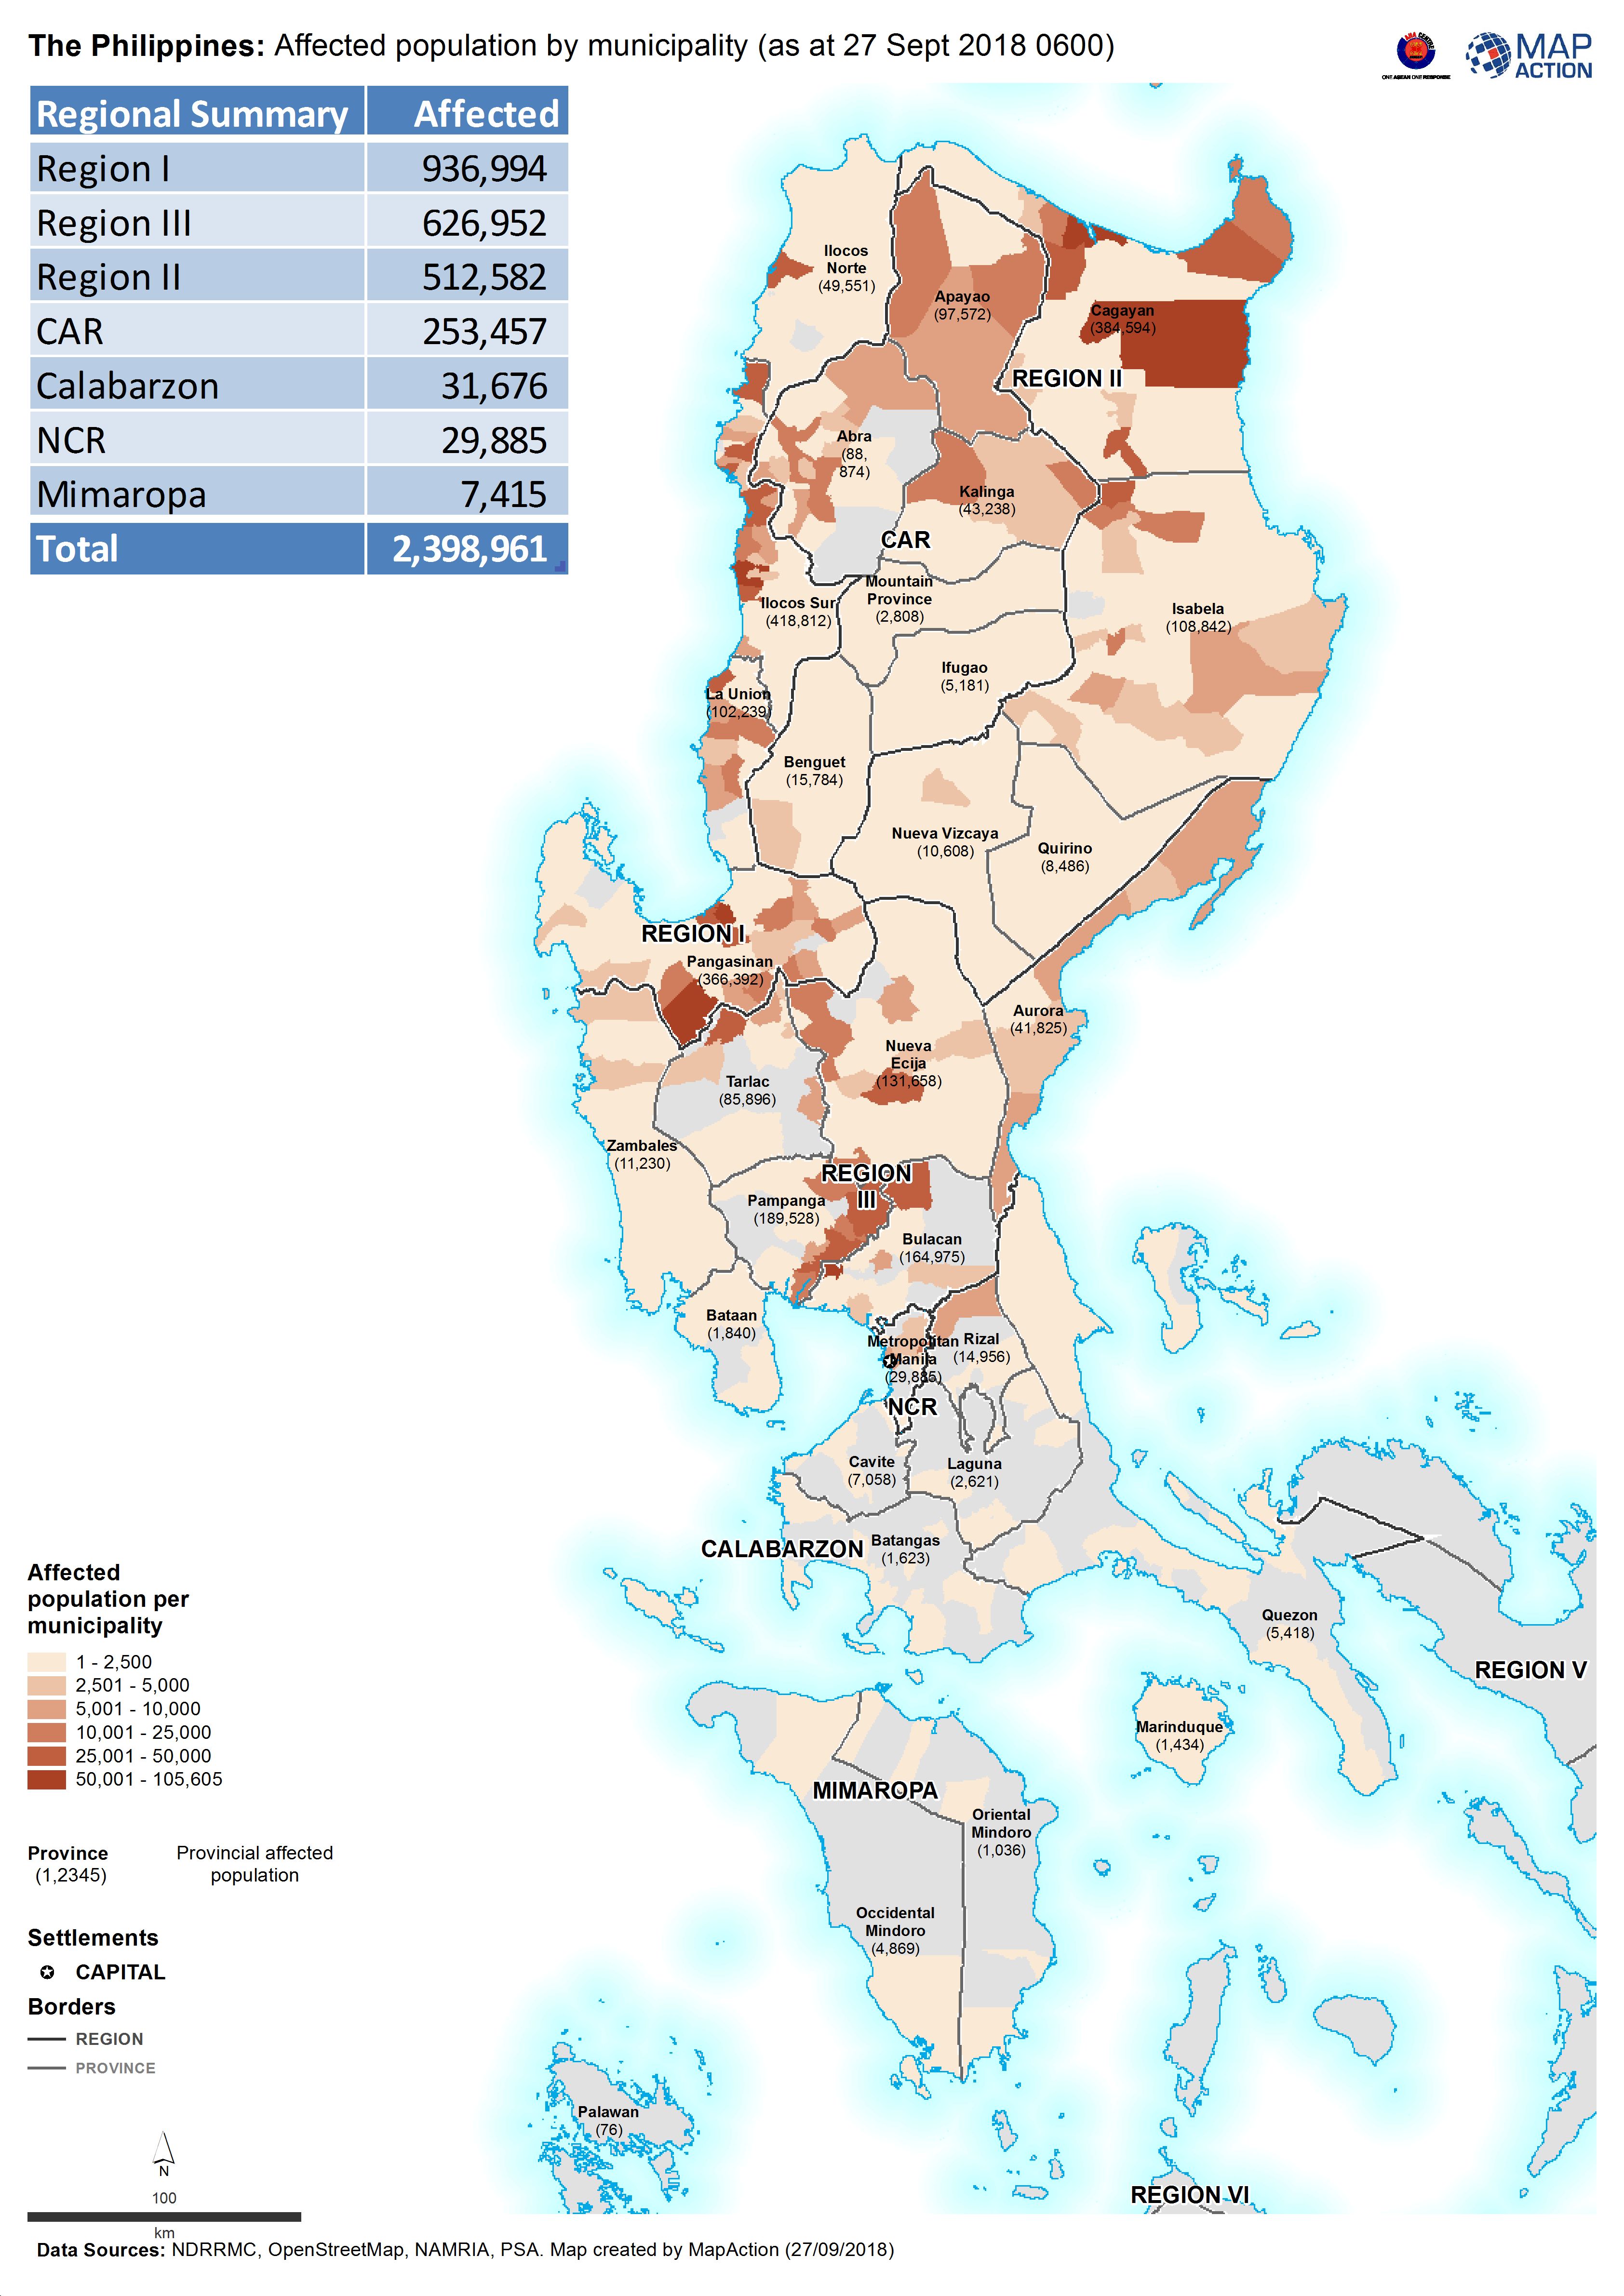
The Philippines: Affected population by municipality (as at 27 Sept 2018 0600)
Map shows the reported number of affected people per province. -

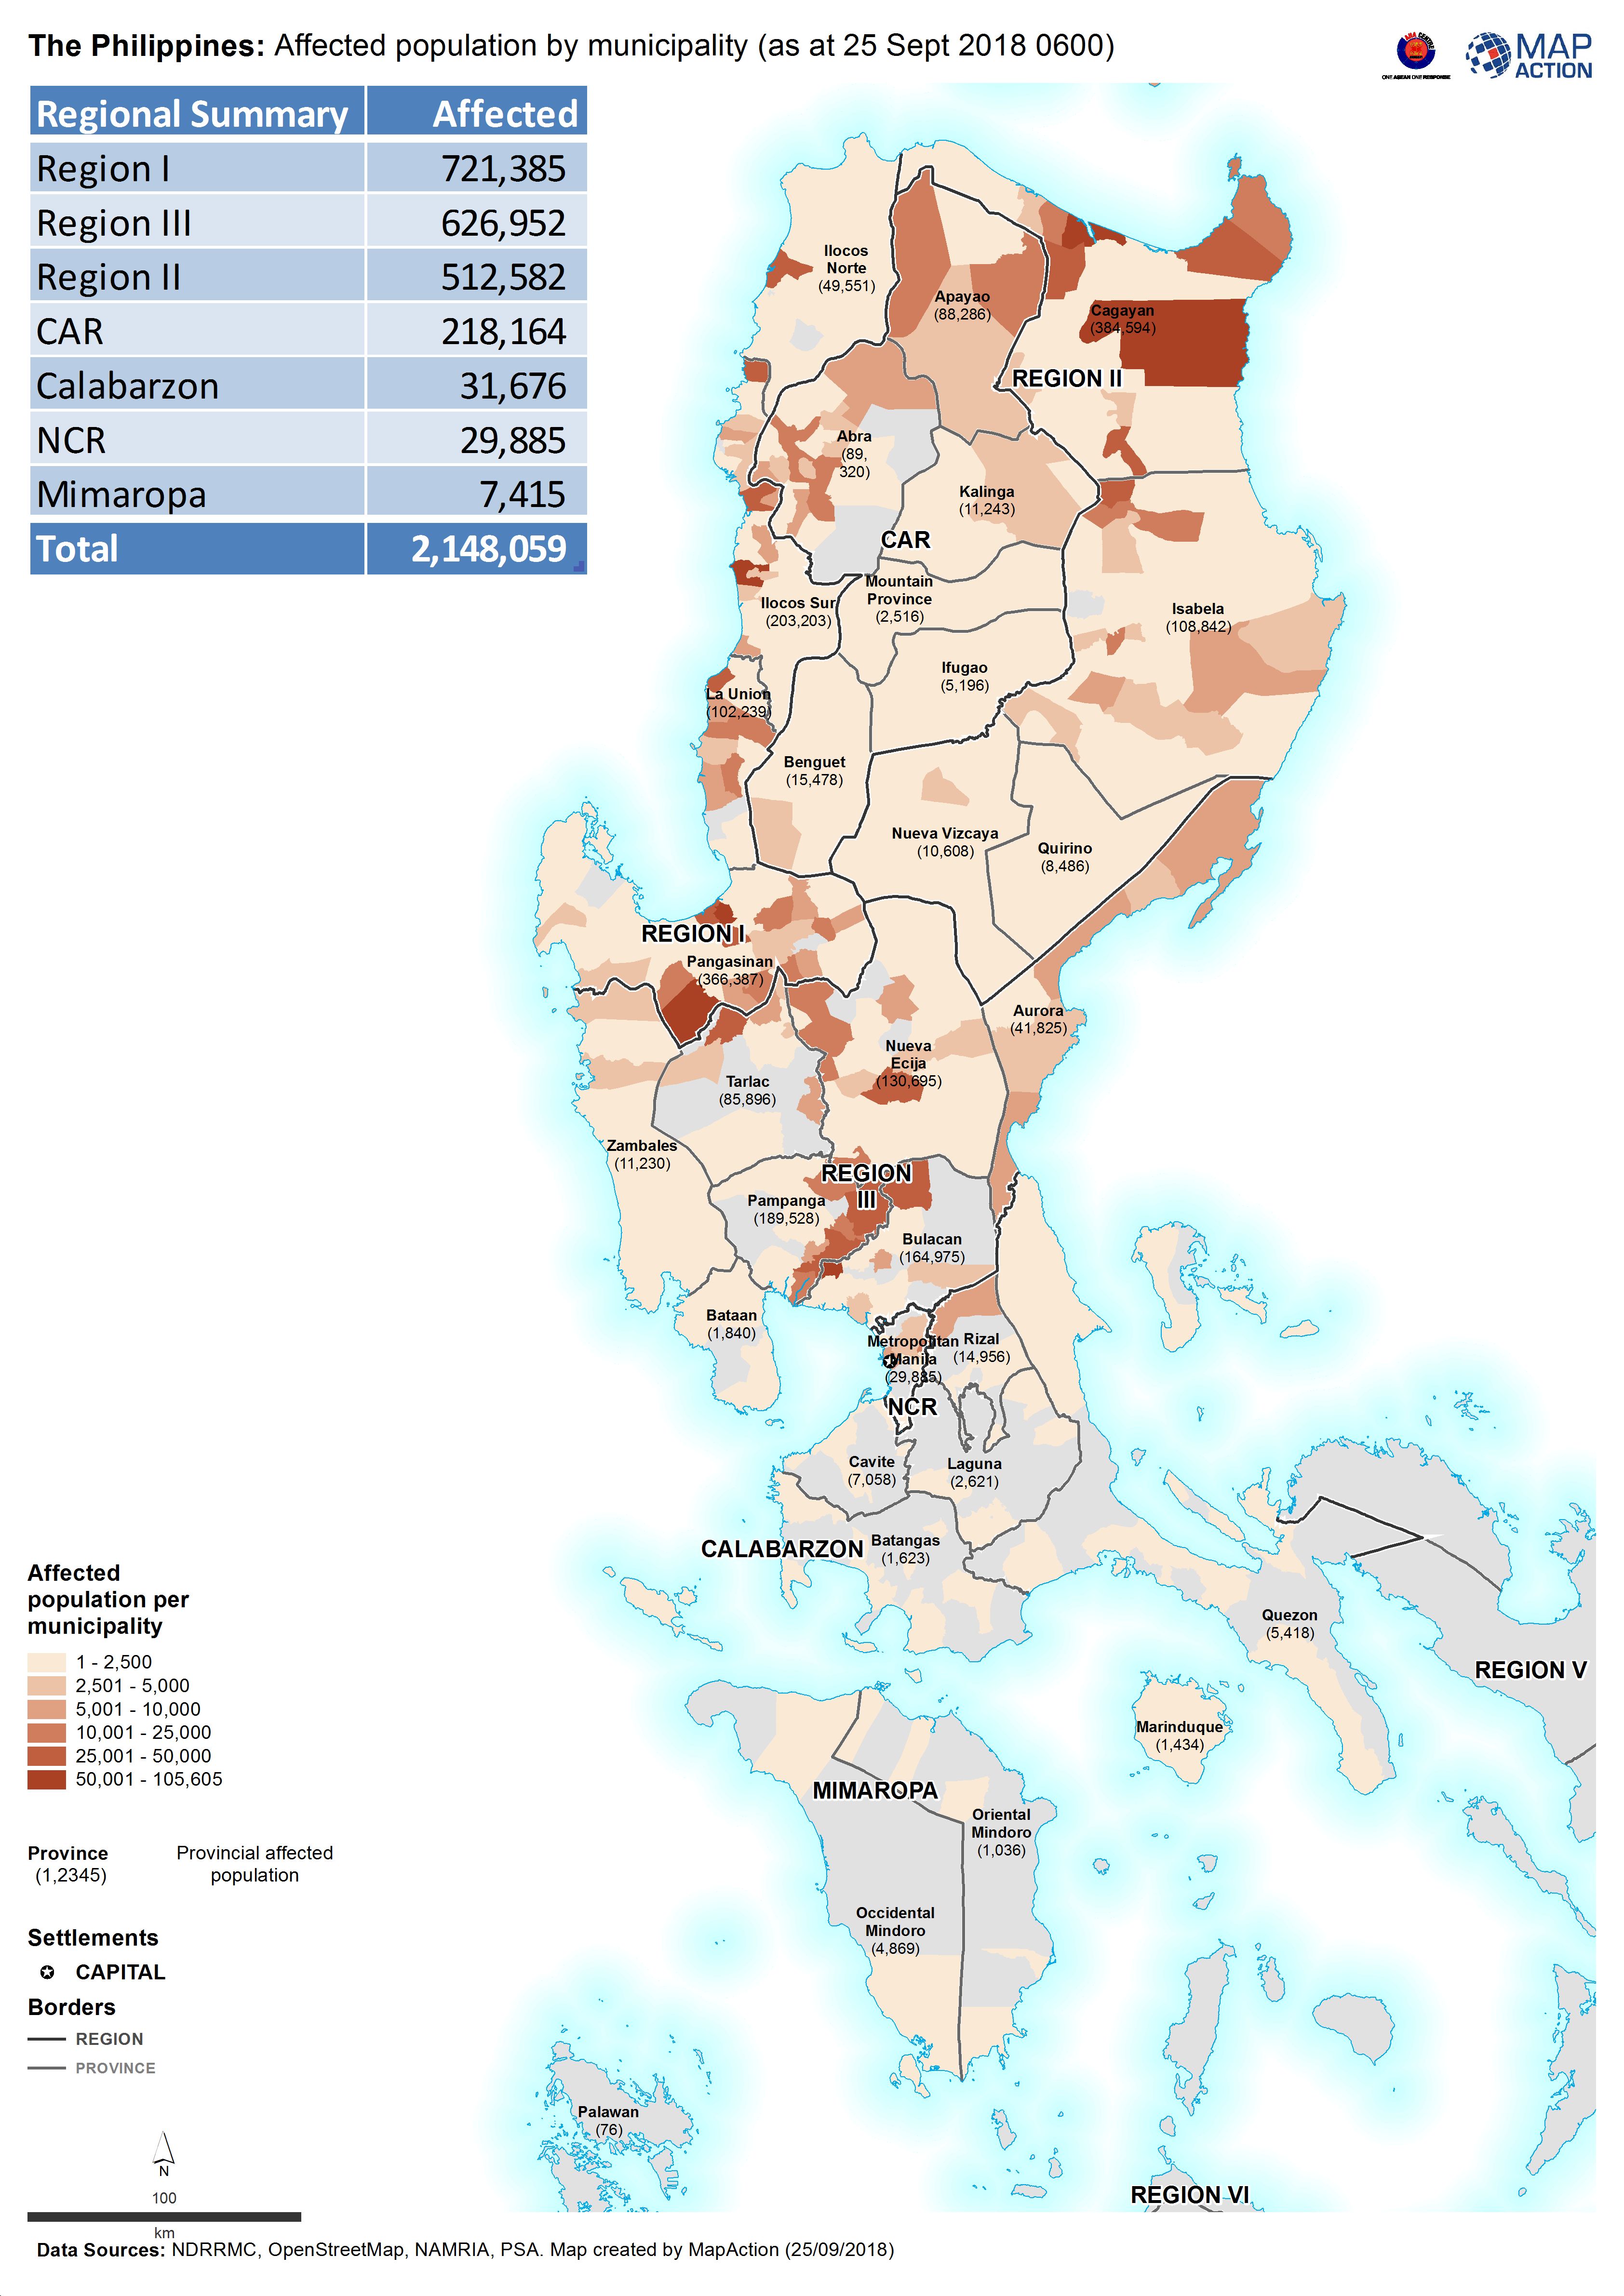
The Philippines: Affected population by municipality (as at 25 Sept 2018 0600)
Map shows the reported number of affected people per province. -
The Philippines: Affected population by municipality (as at 24 Sept 2018 0600)
Map shows the reported number of affected people per province. -

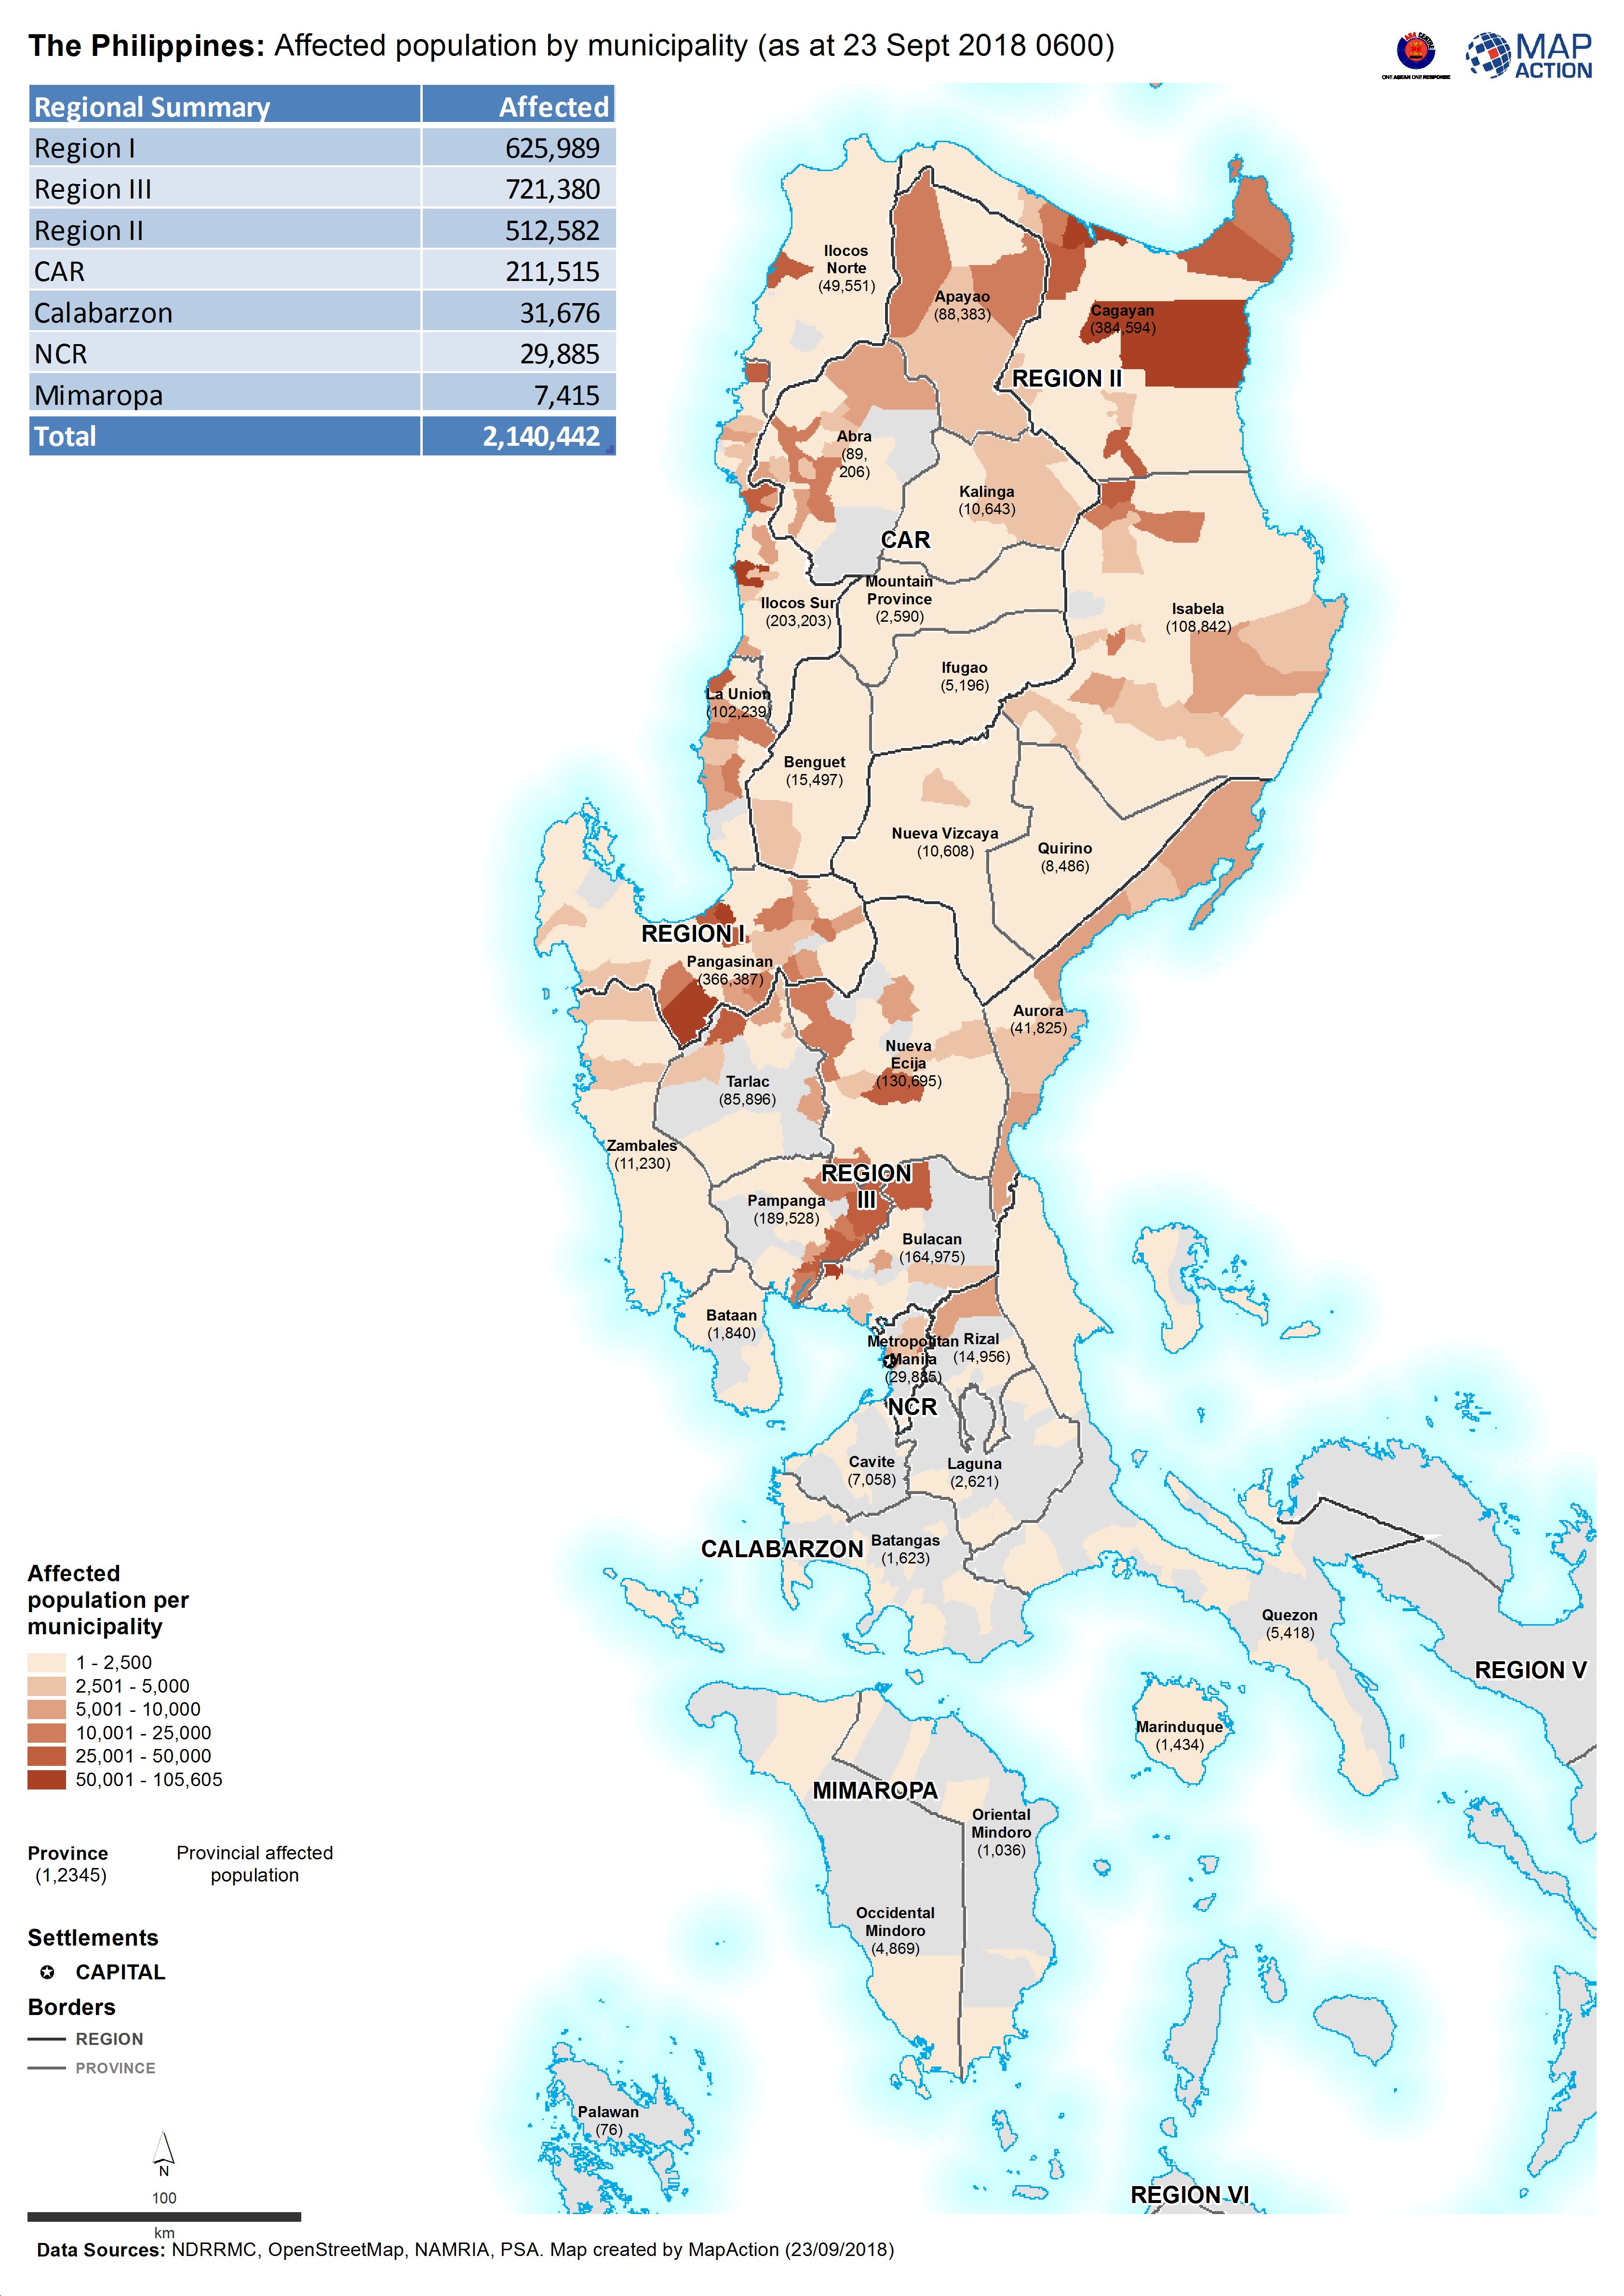
The Philippines: Affected population by municipality (as at 23 Sept 2018 0600)
Map shows the reported number of affected people per province. -

The Philippines: Affected population by municipality (as at 22 Sept 2018 0600)
Map shows the reported number of affected people per province. -
The Philippines: Affected population by municipality (as at 20 Sept 2018 0600)
Map shows the reported number of affected people per province. -
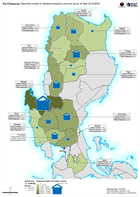
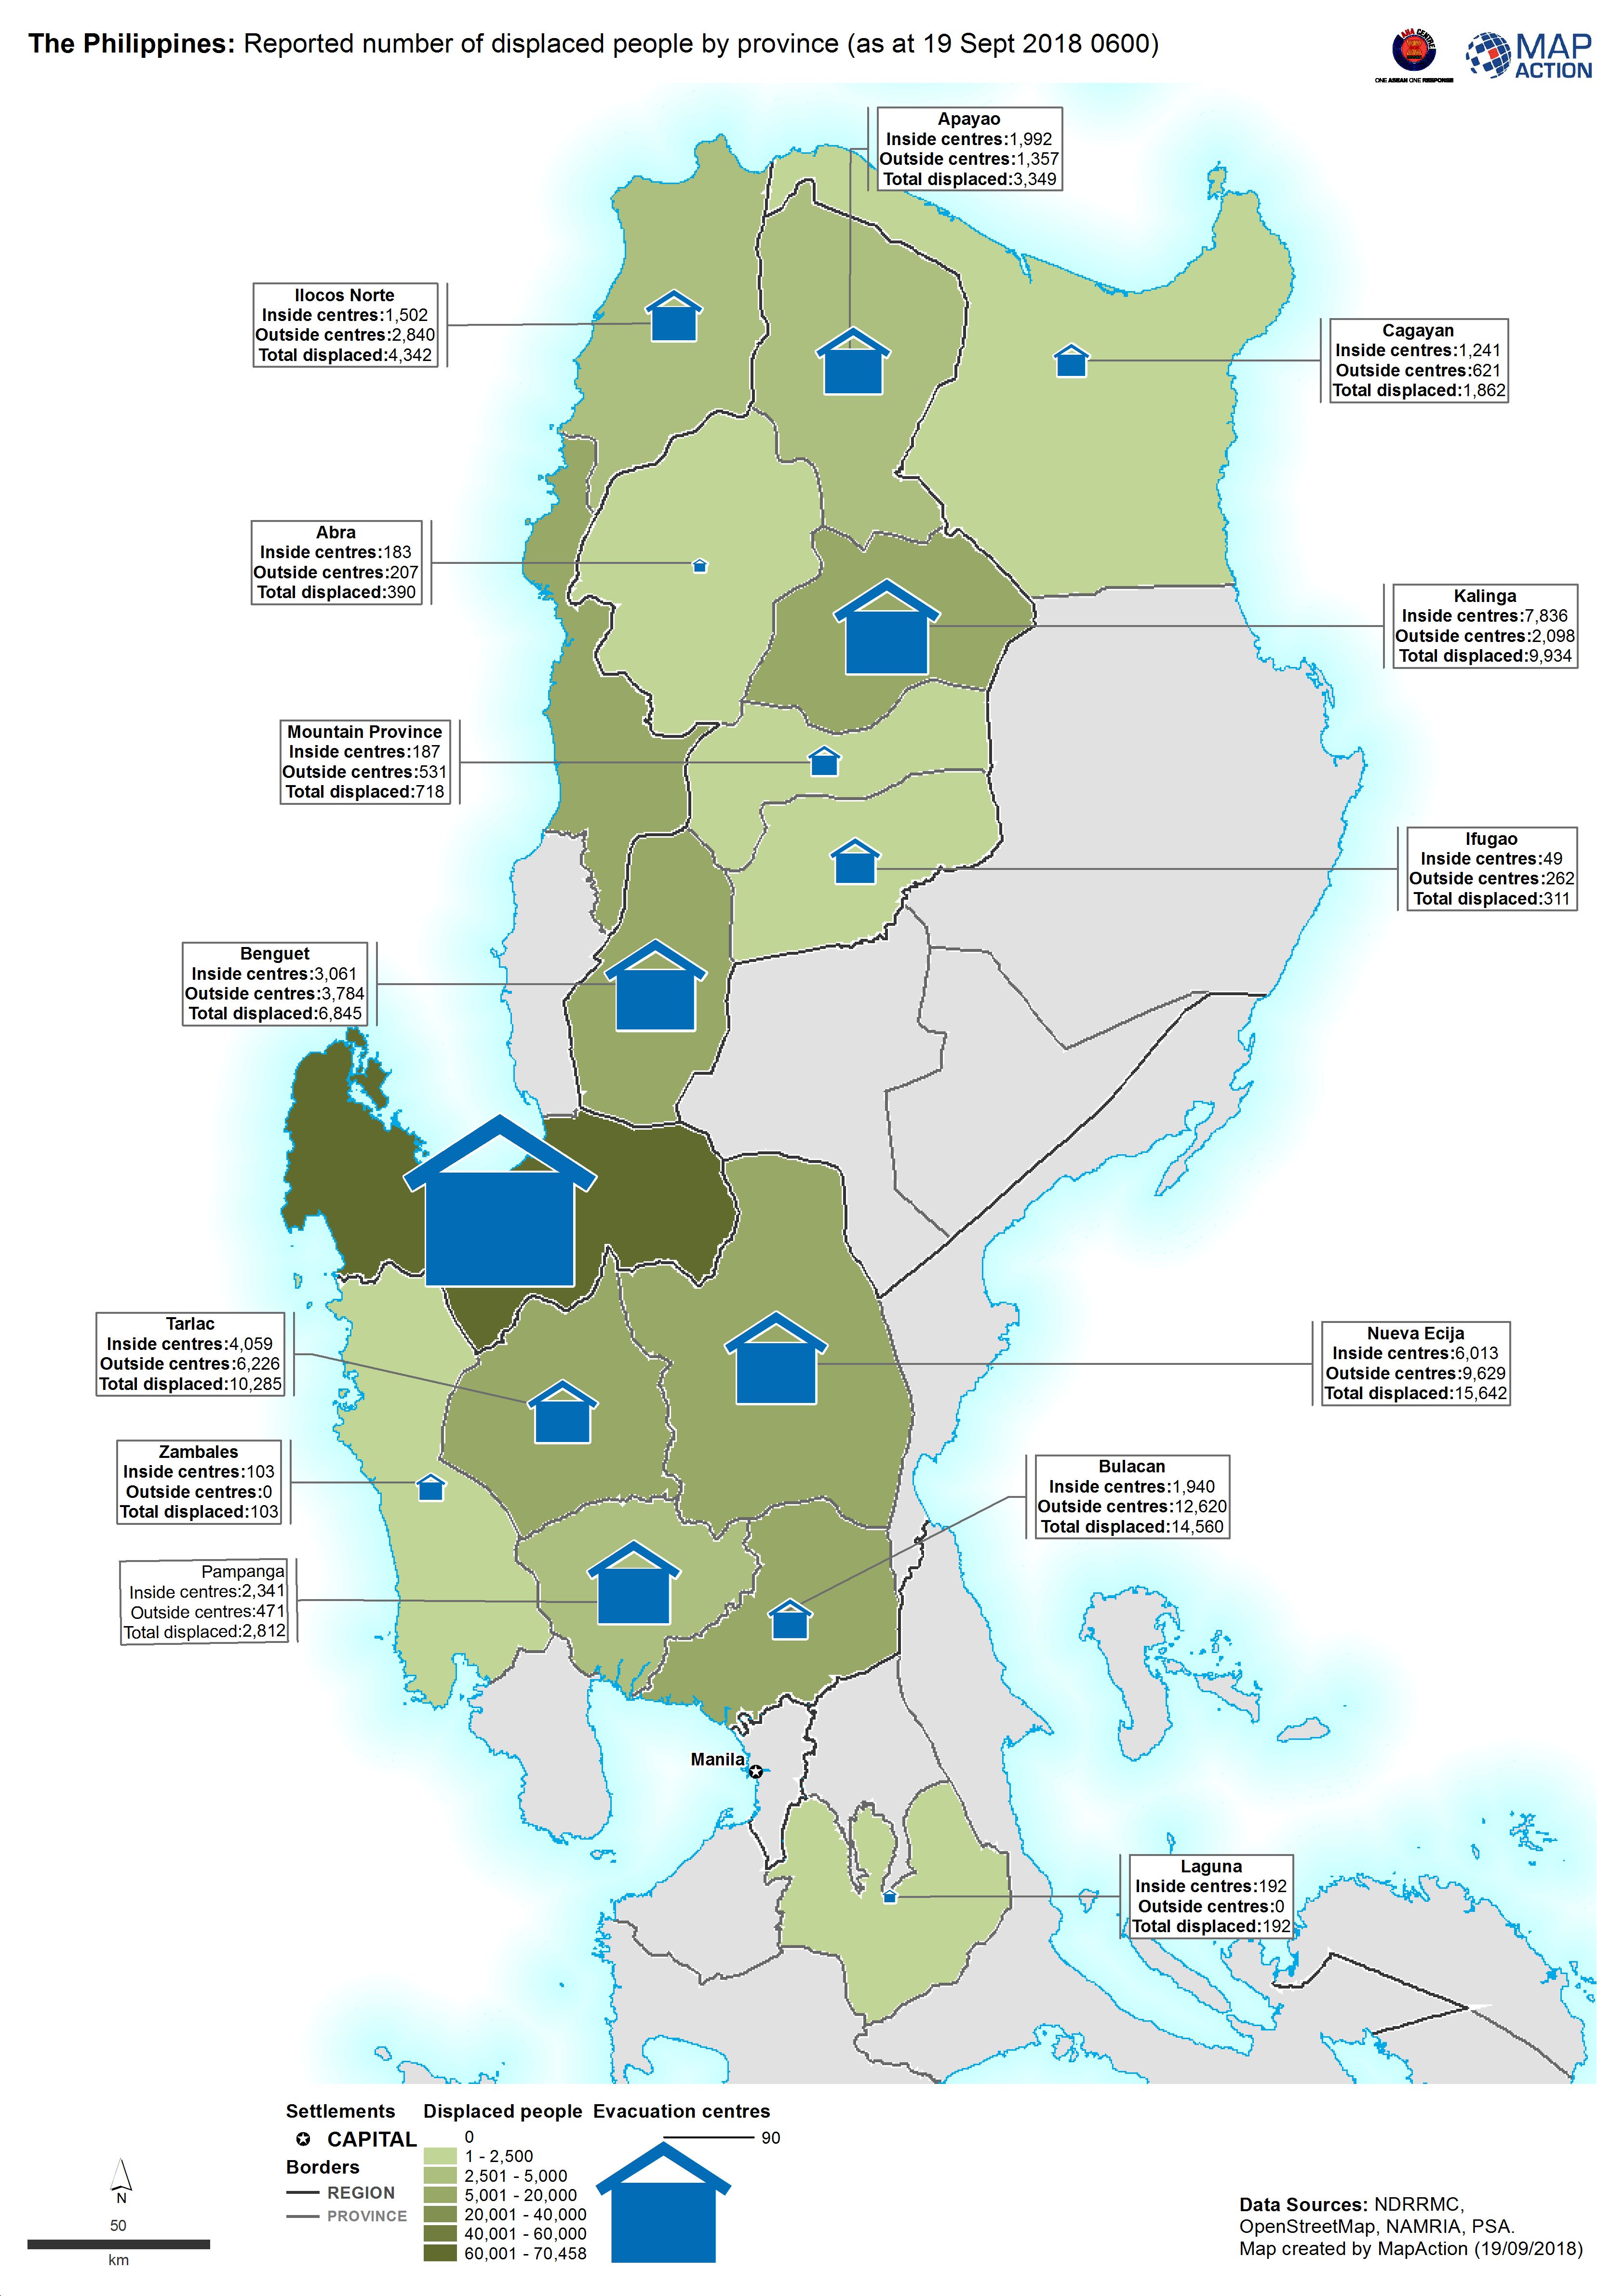
The Philippines: Reported number of displaced people by province (as at 19 Se...
Map shows the reported number of displaced people per province. -

The Philippines: Affected population by municipality (as at 19 Sept 2018 0600)
Map shows the reported number of affected people per province. -
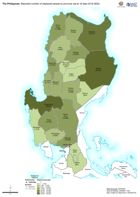
The Philippines: Reported number of displaced people by province (as at 18 Se...
Map shows the reported number of displaced people per province. -
The Philippines: Affected population by province (as at 18 Sept 2018 0600)
Map shows the reported number of affected people per province. -

-
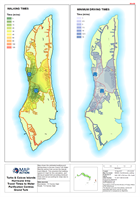
Turks & Caicos Islands Hurricane Irma Travel Times to Water Purification Cent...
Map shows the estimated walking and driving times to the two Grand Turk Water filtering centres from across the islands road network. This assumes that walking speed of 2 mph...