-
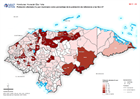
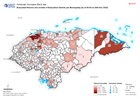
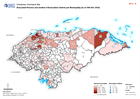
Honduras: Poblacion afectada (%) por municipio como porcentaje de la població...
Poblacion afectada (%) por municipio como porcentaje de la población de referencia a las Nov 27 -

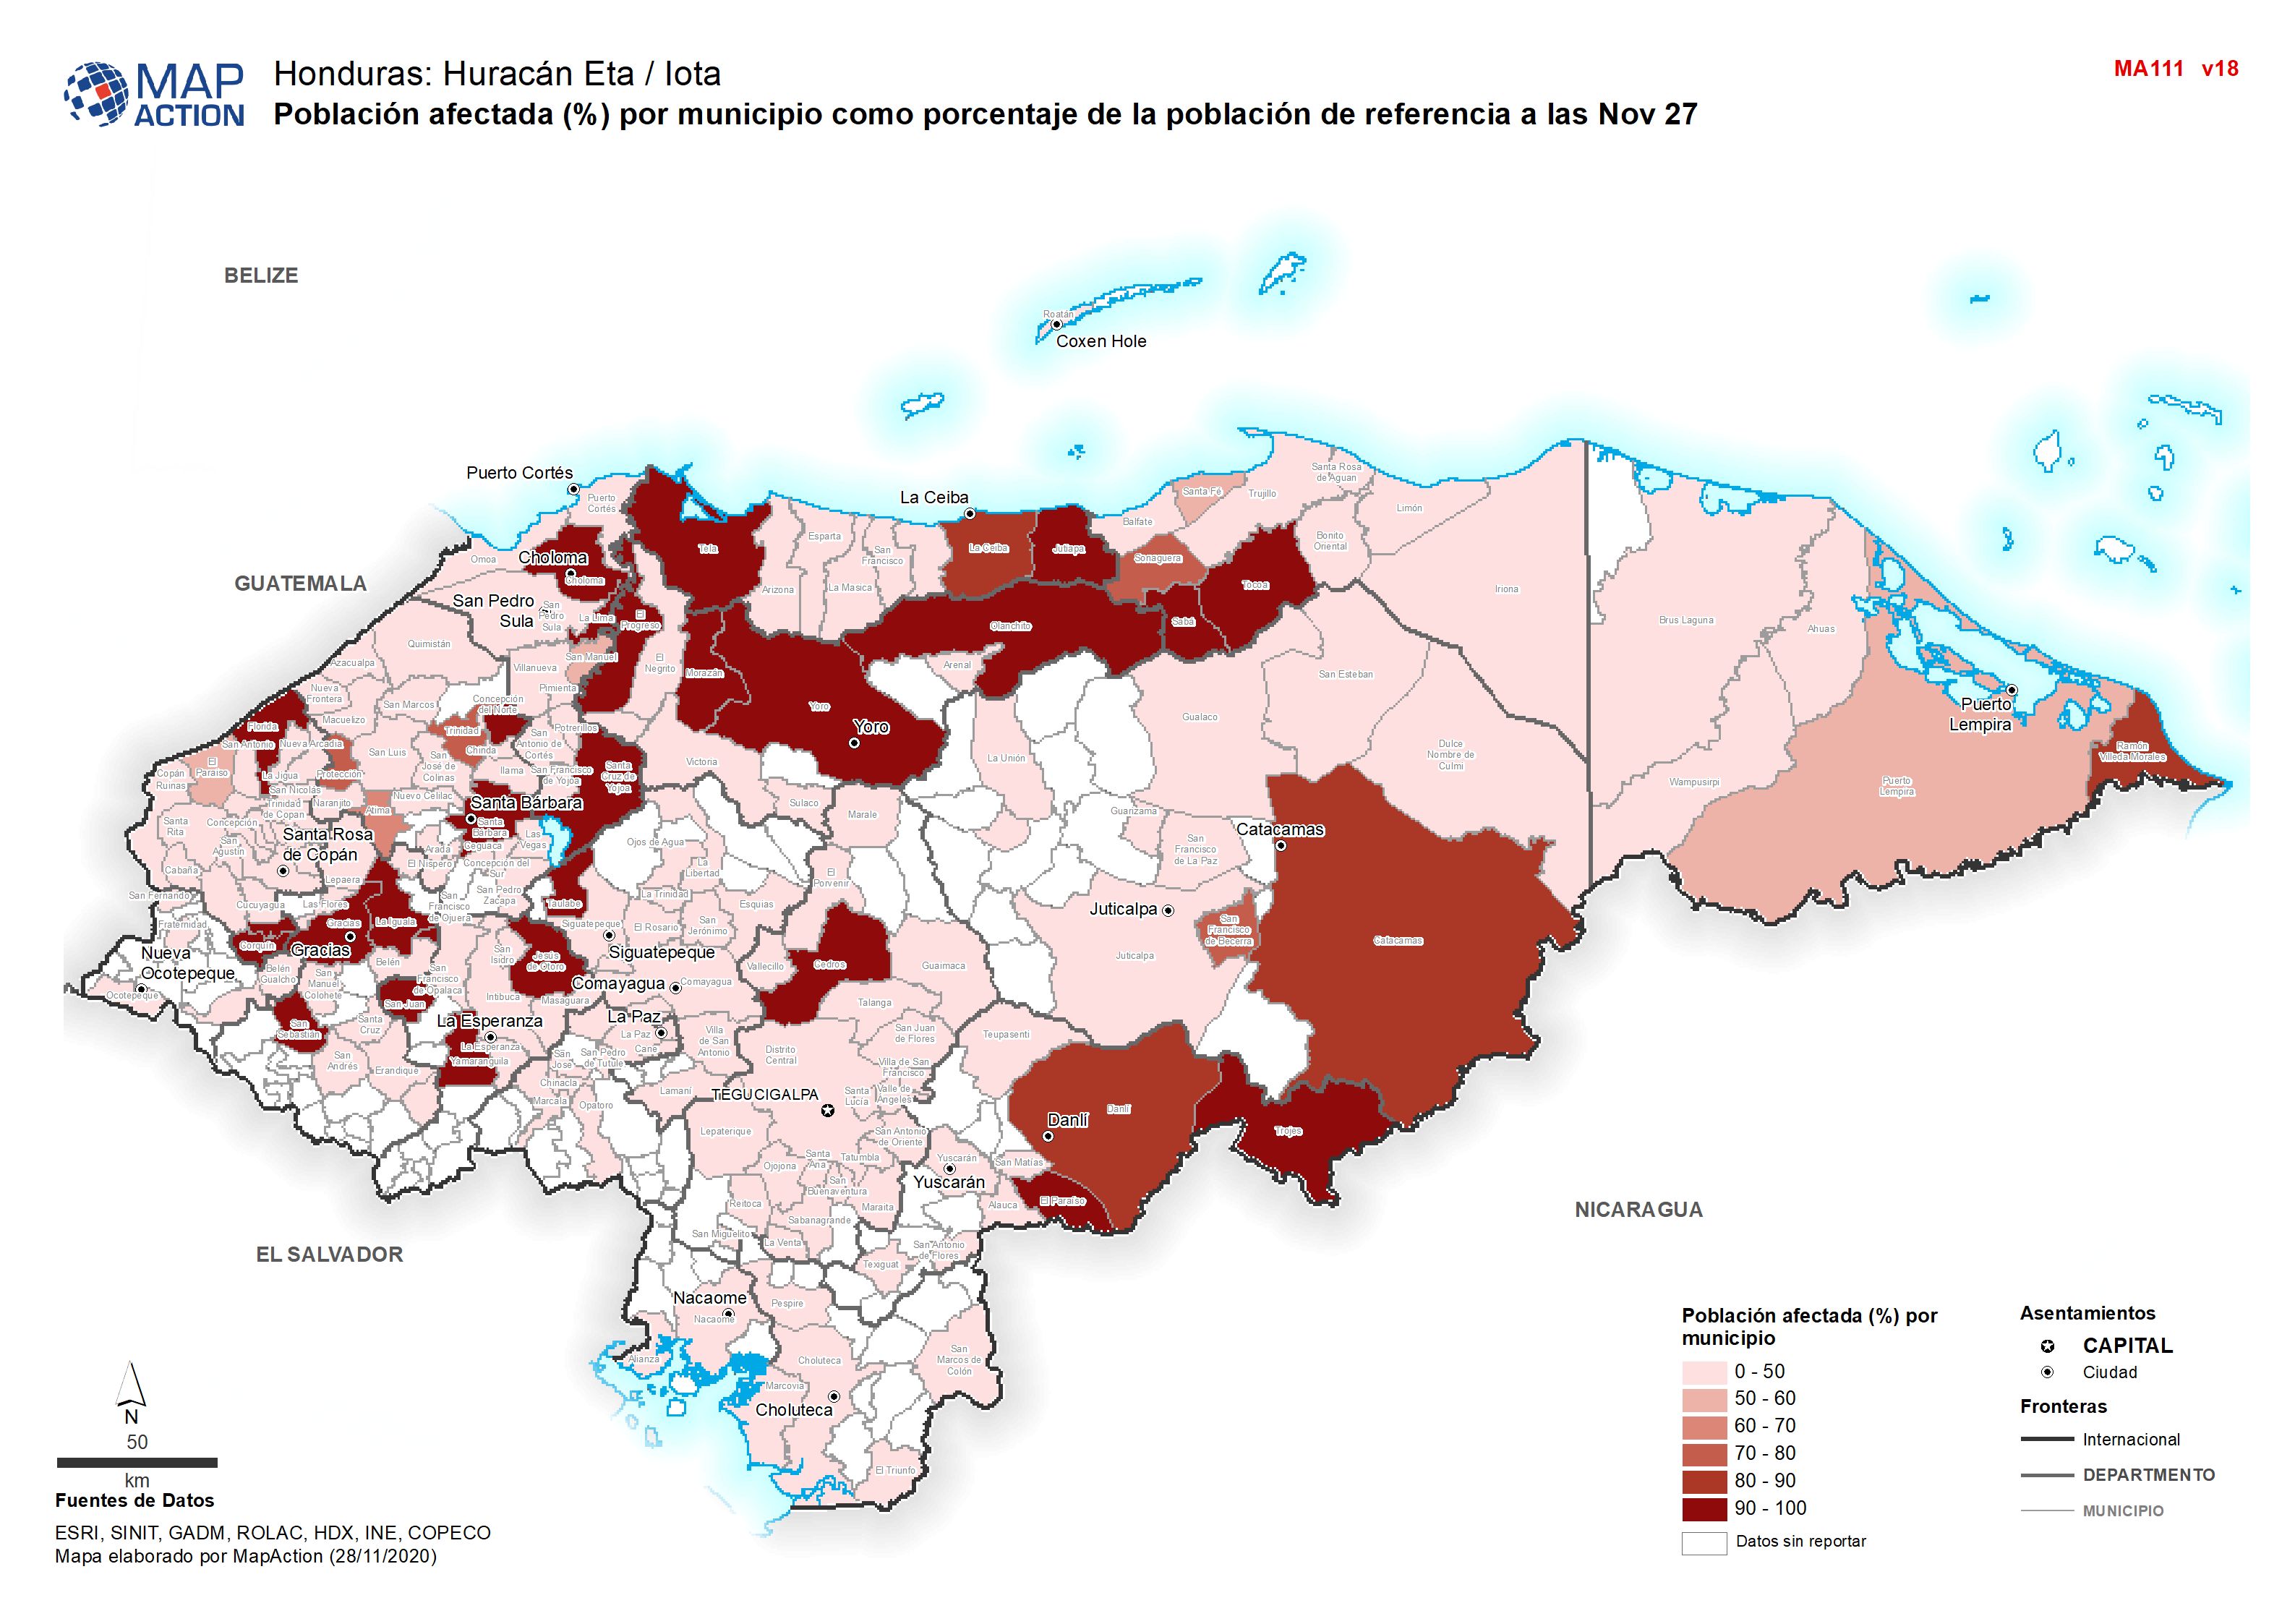
Guatemala: Populations potentially exposed to high and very high impact based...
Map shows the population in high or very high categories of exposure to hazards. The hazards considered include flash floods, landslides, floods, lahars, high swells and winds.... -
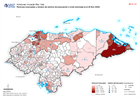
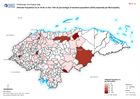
Honduras: Personas evacuadas y número de centros de evacuación a nivel munici...
Personas evacuadas y número de centros de evacuación a nivel municipal (a el 26 Nov 2020) -

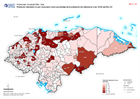
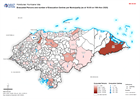
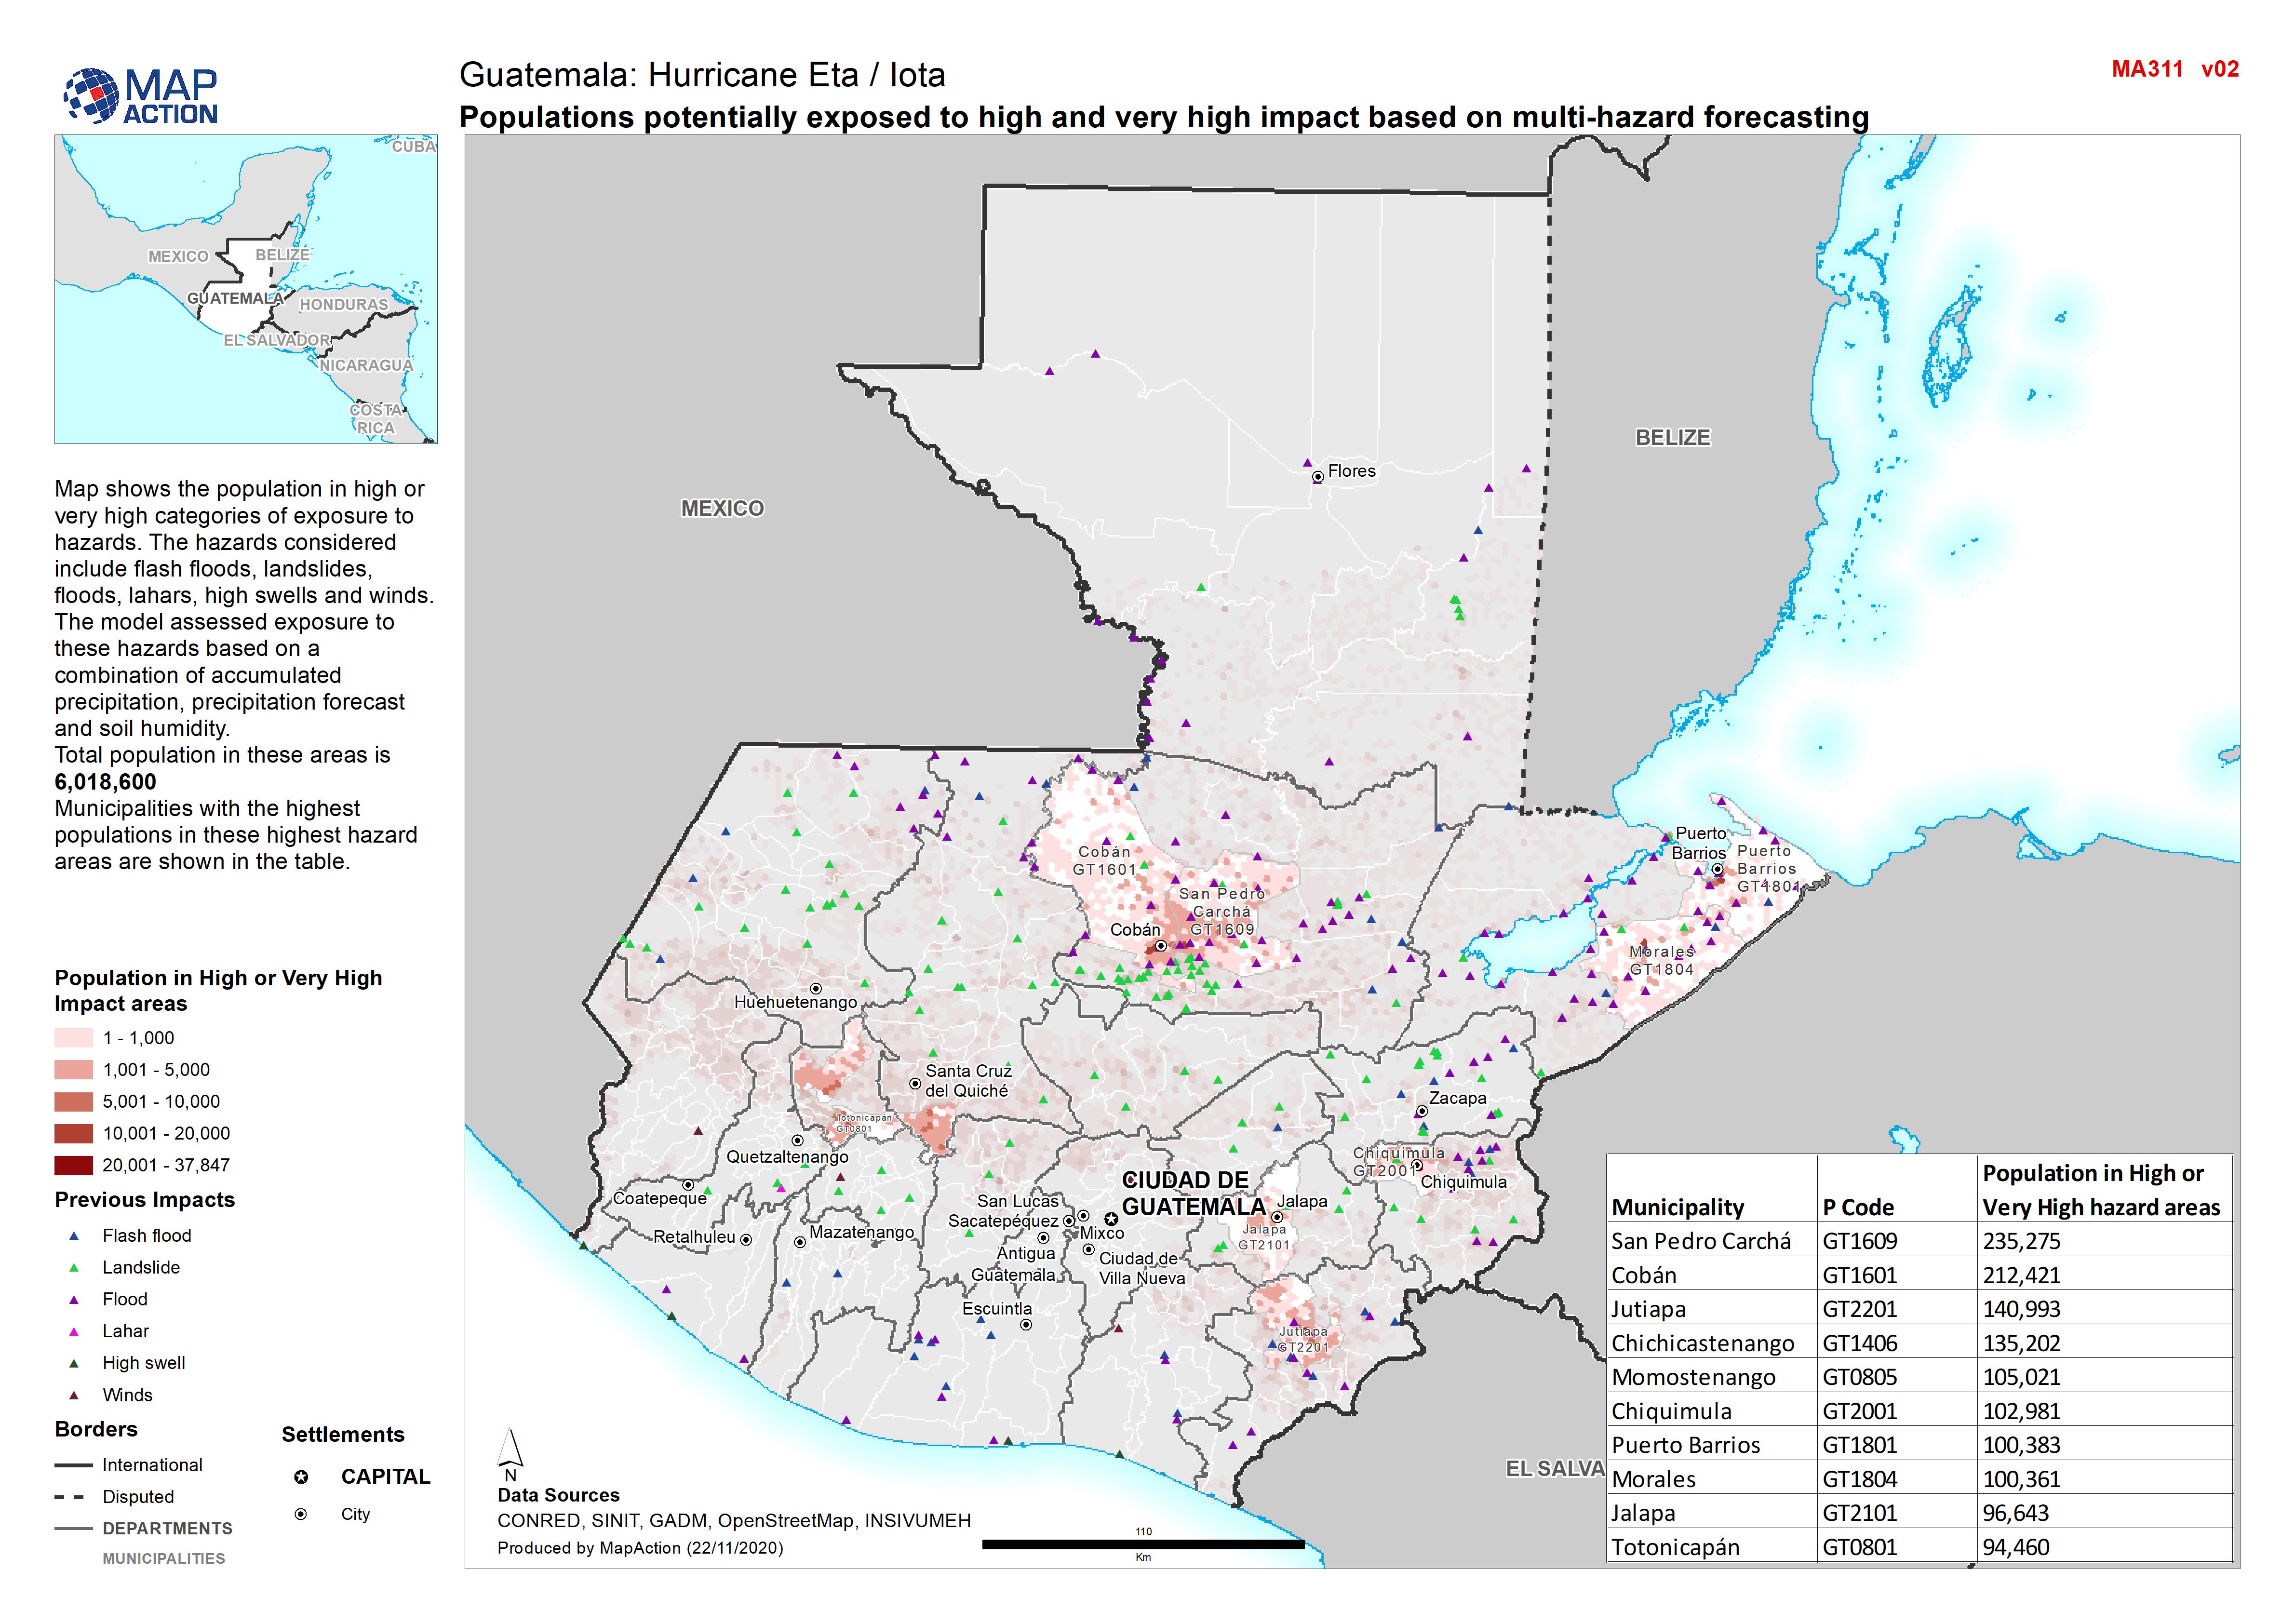
Honduras: Población afectada (%) por municipio como porcentaje de la població...
Población afectada (%) por municipio como porcentaje de la población de referencia a las Nov 26 -
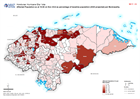
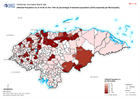
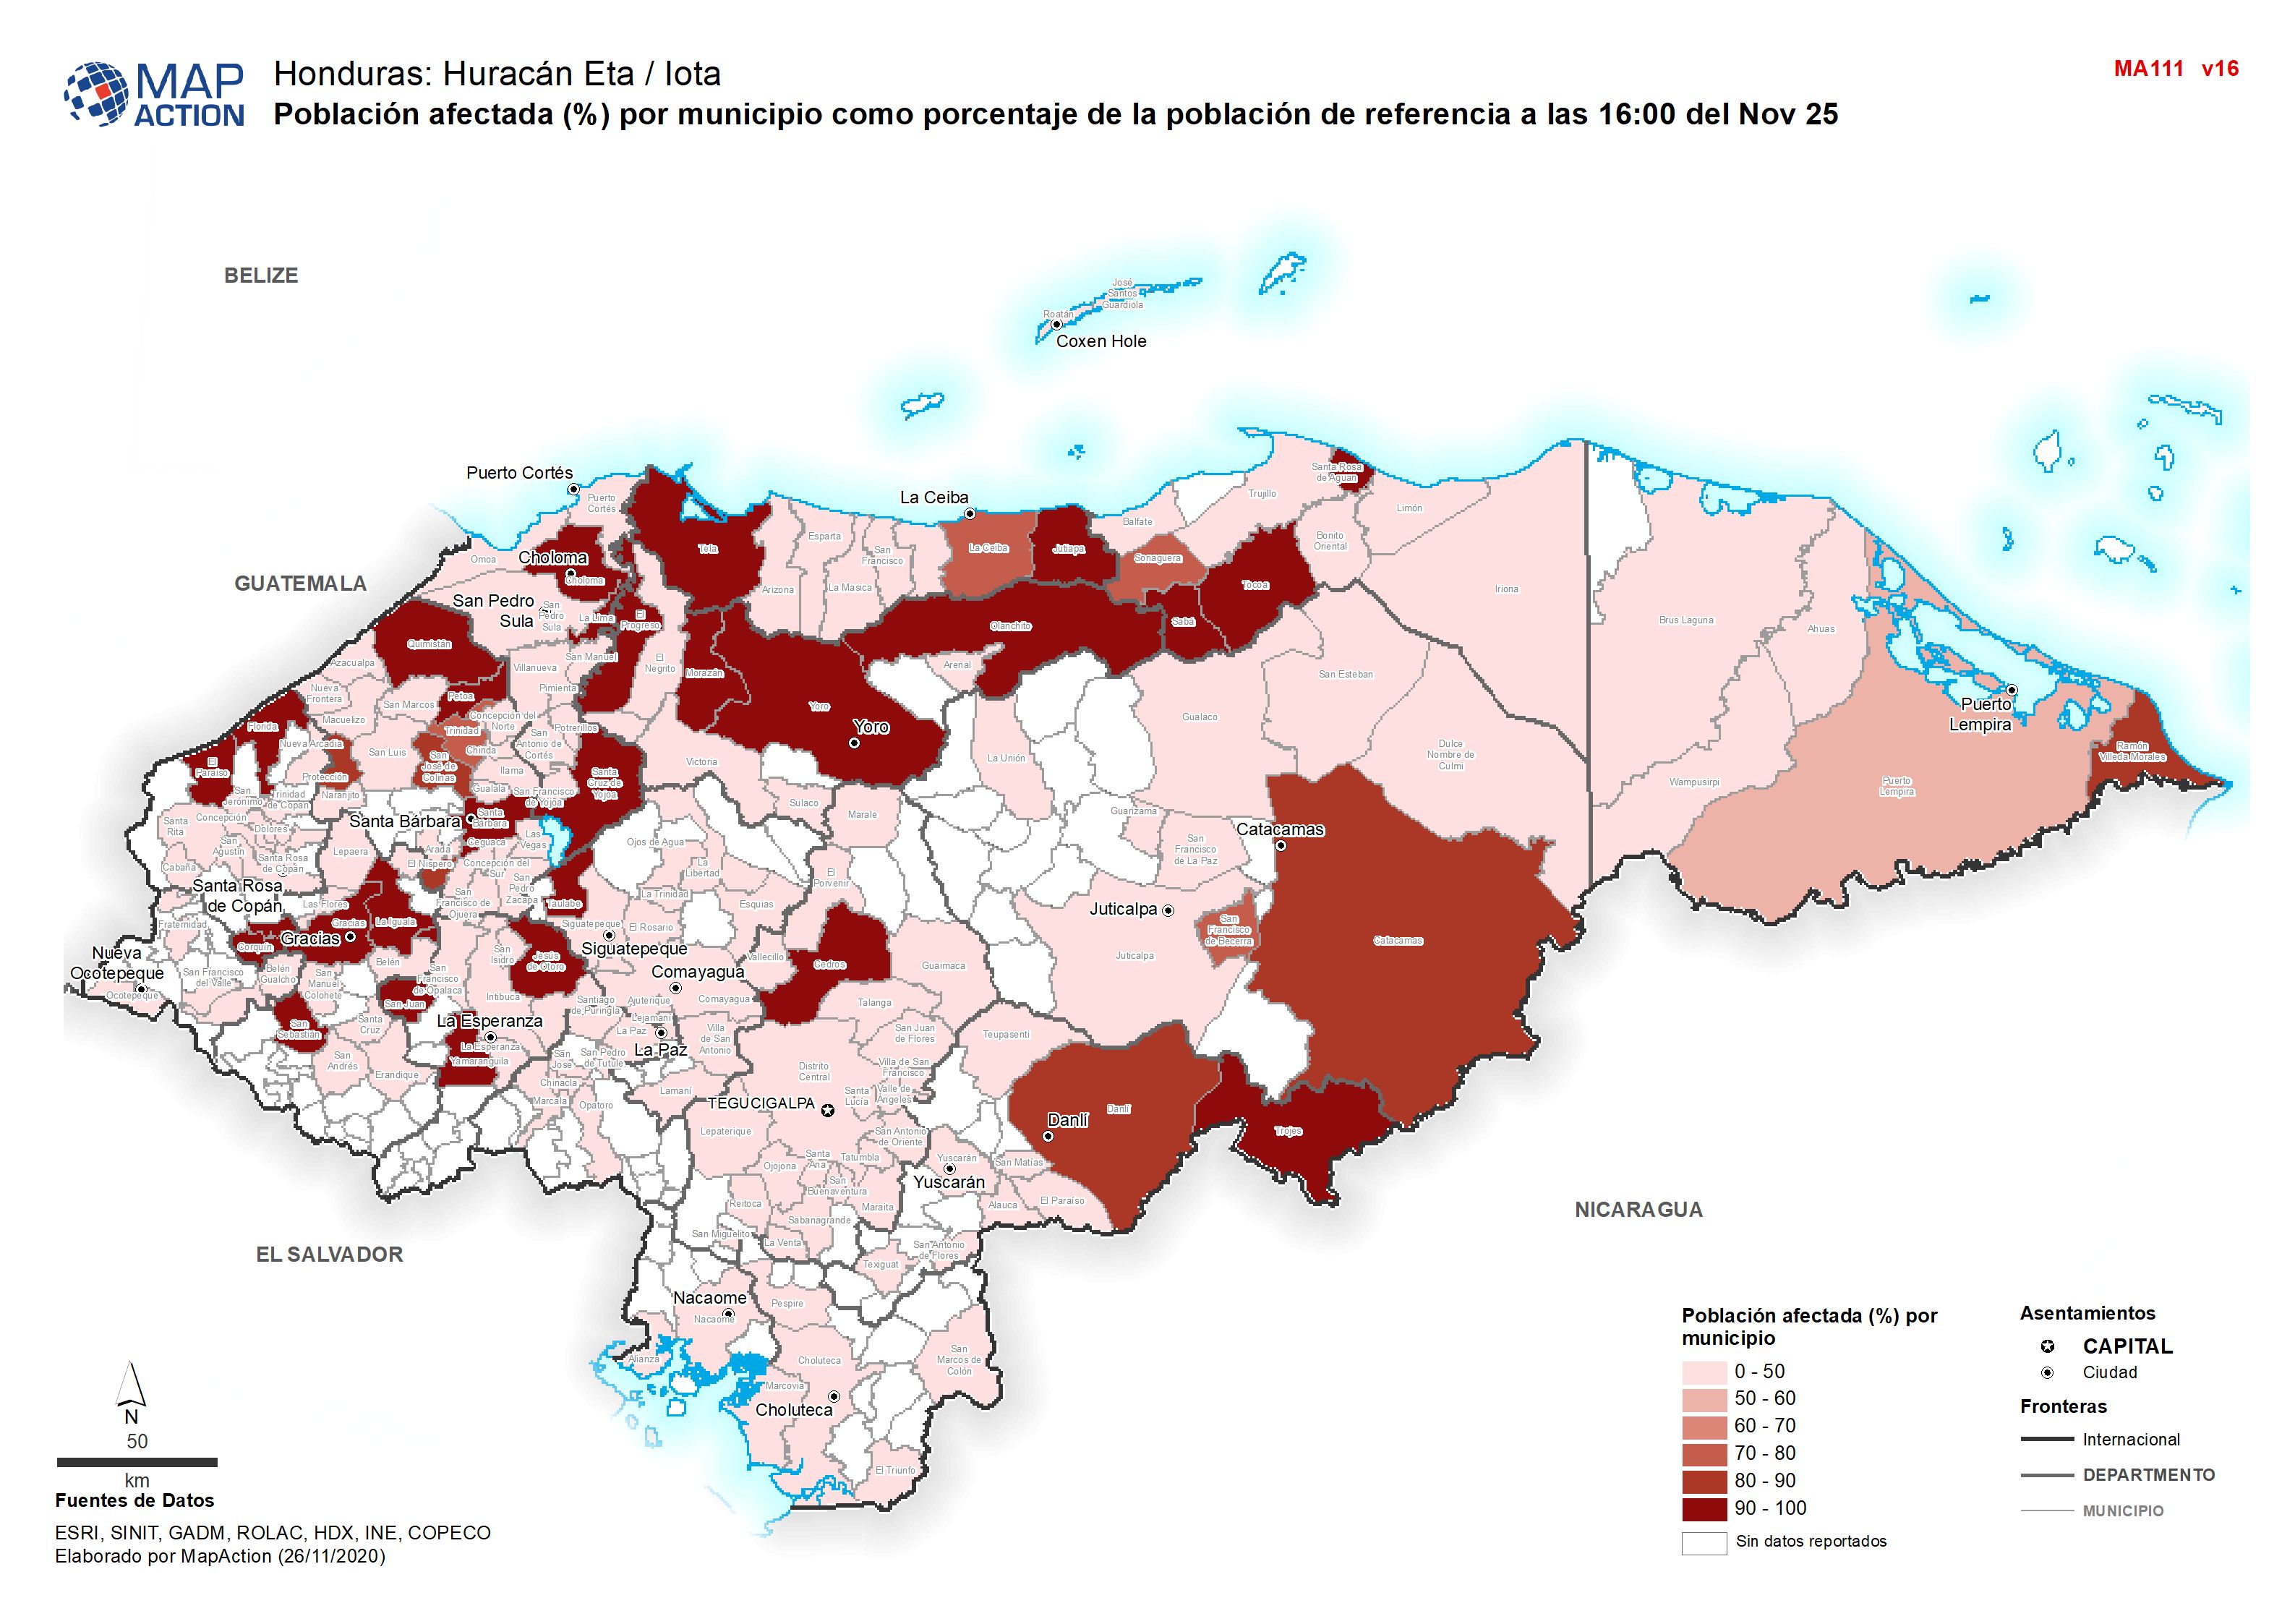
Honduras: Población afectada (%) por municipio como porcentaje de la població...
Población afectada (%) por municipio como porcentaje de la población de referencia a las 16:00 del Nov 25 -
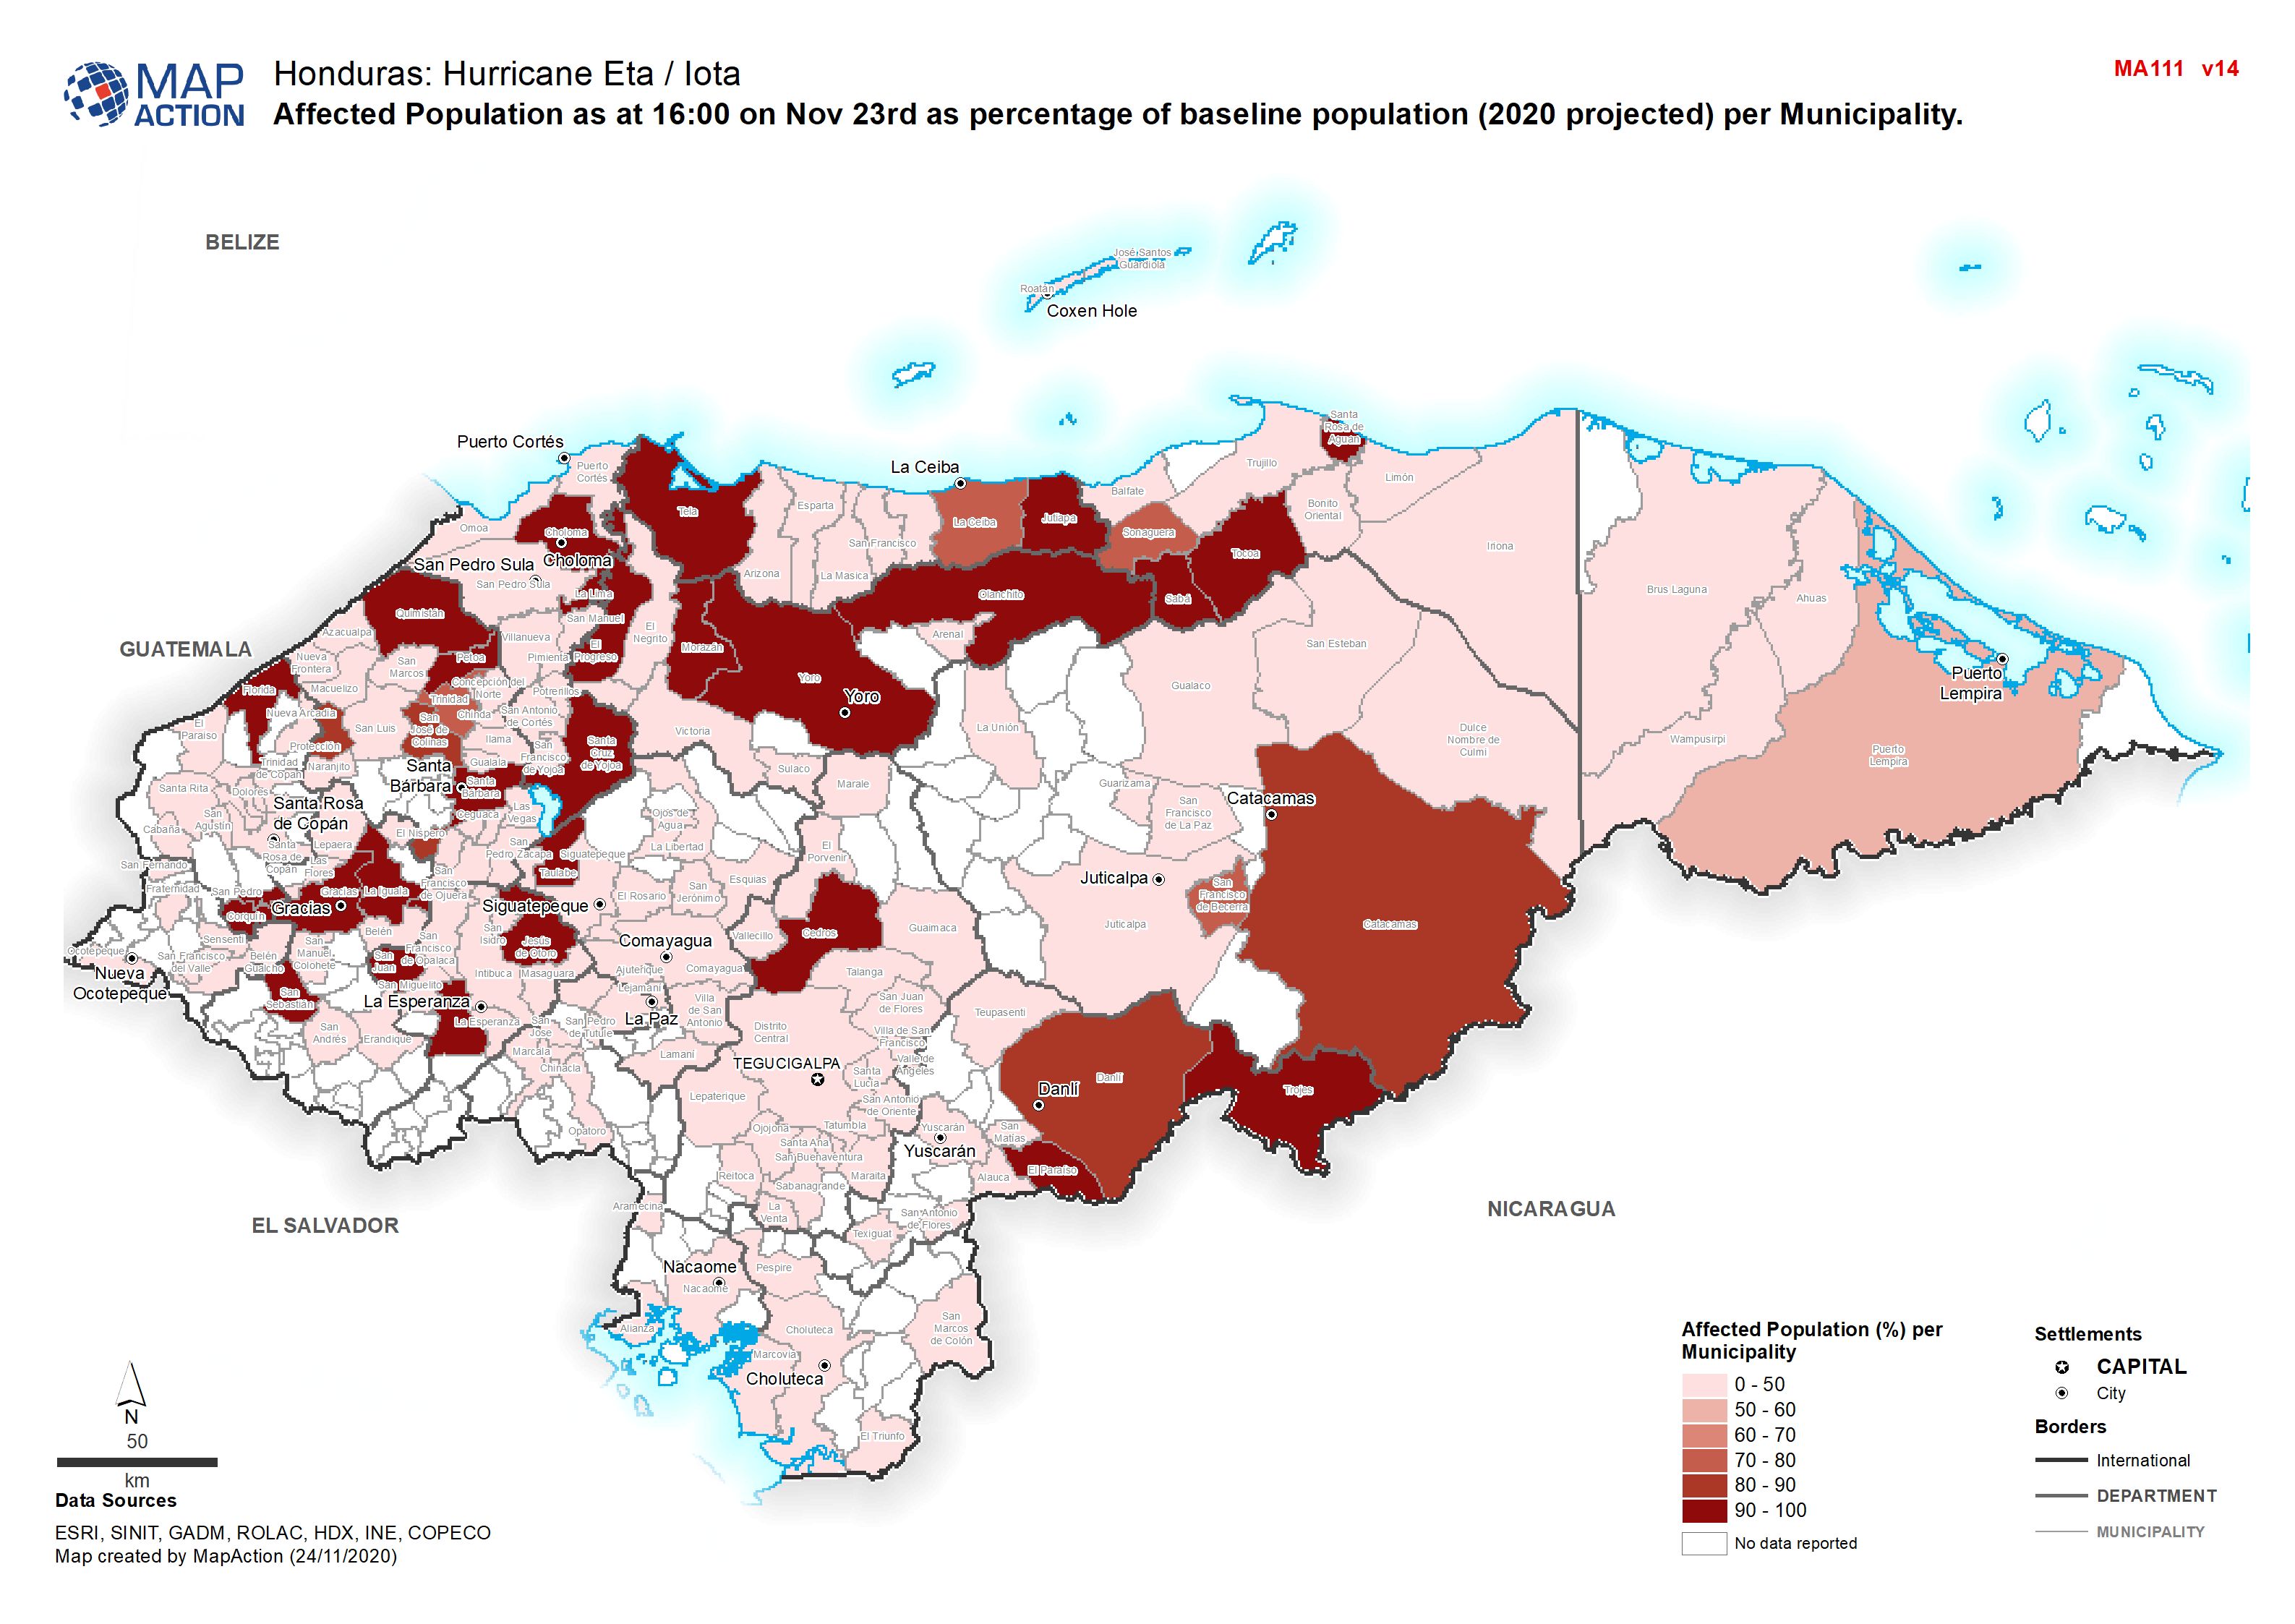
Honduras: Affected Population as at 16:00 on Nov 23rd as percentage of baseli...
Map shows affected population as at 16:00 on Nov 23rd as percentage of baseline population (2020 projected) per Municipality. -

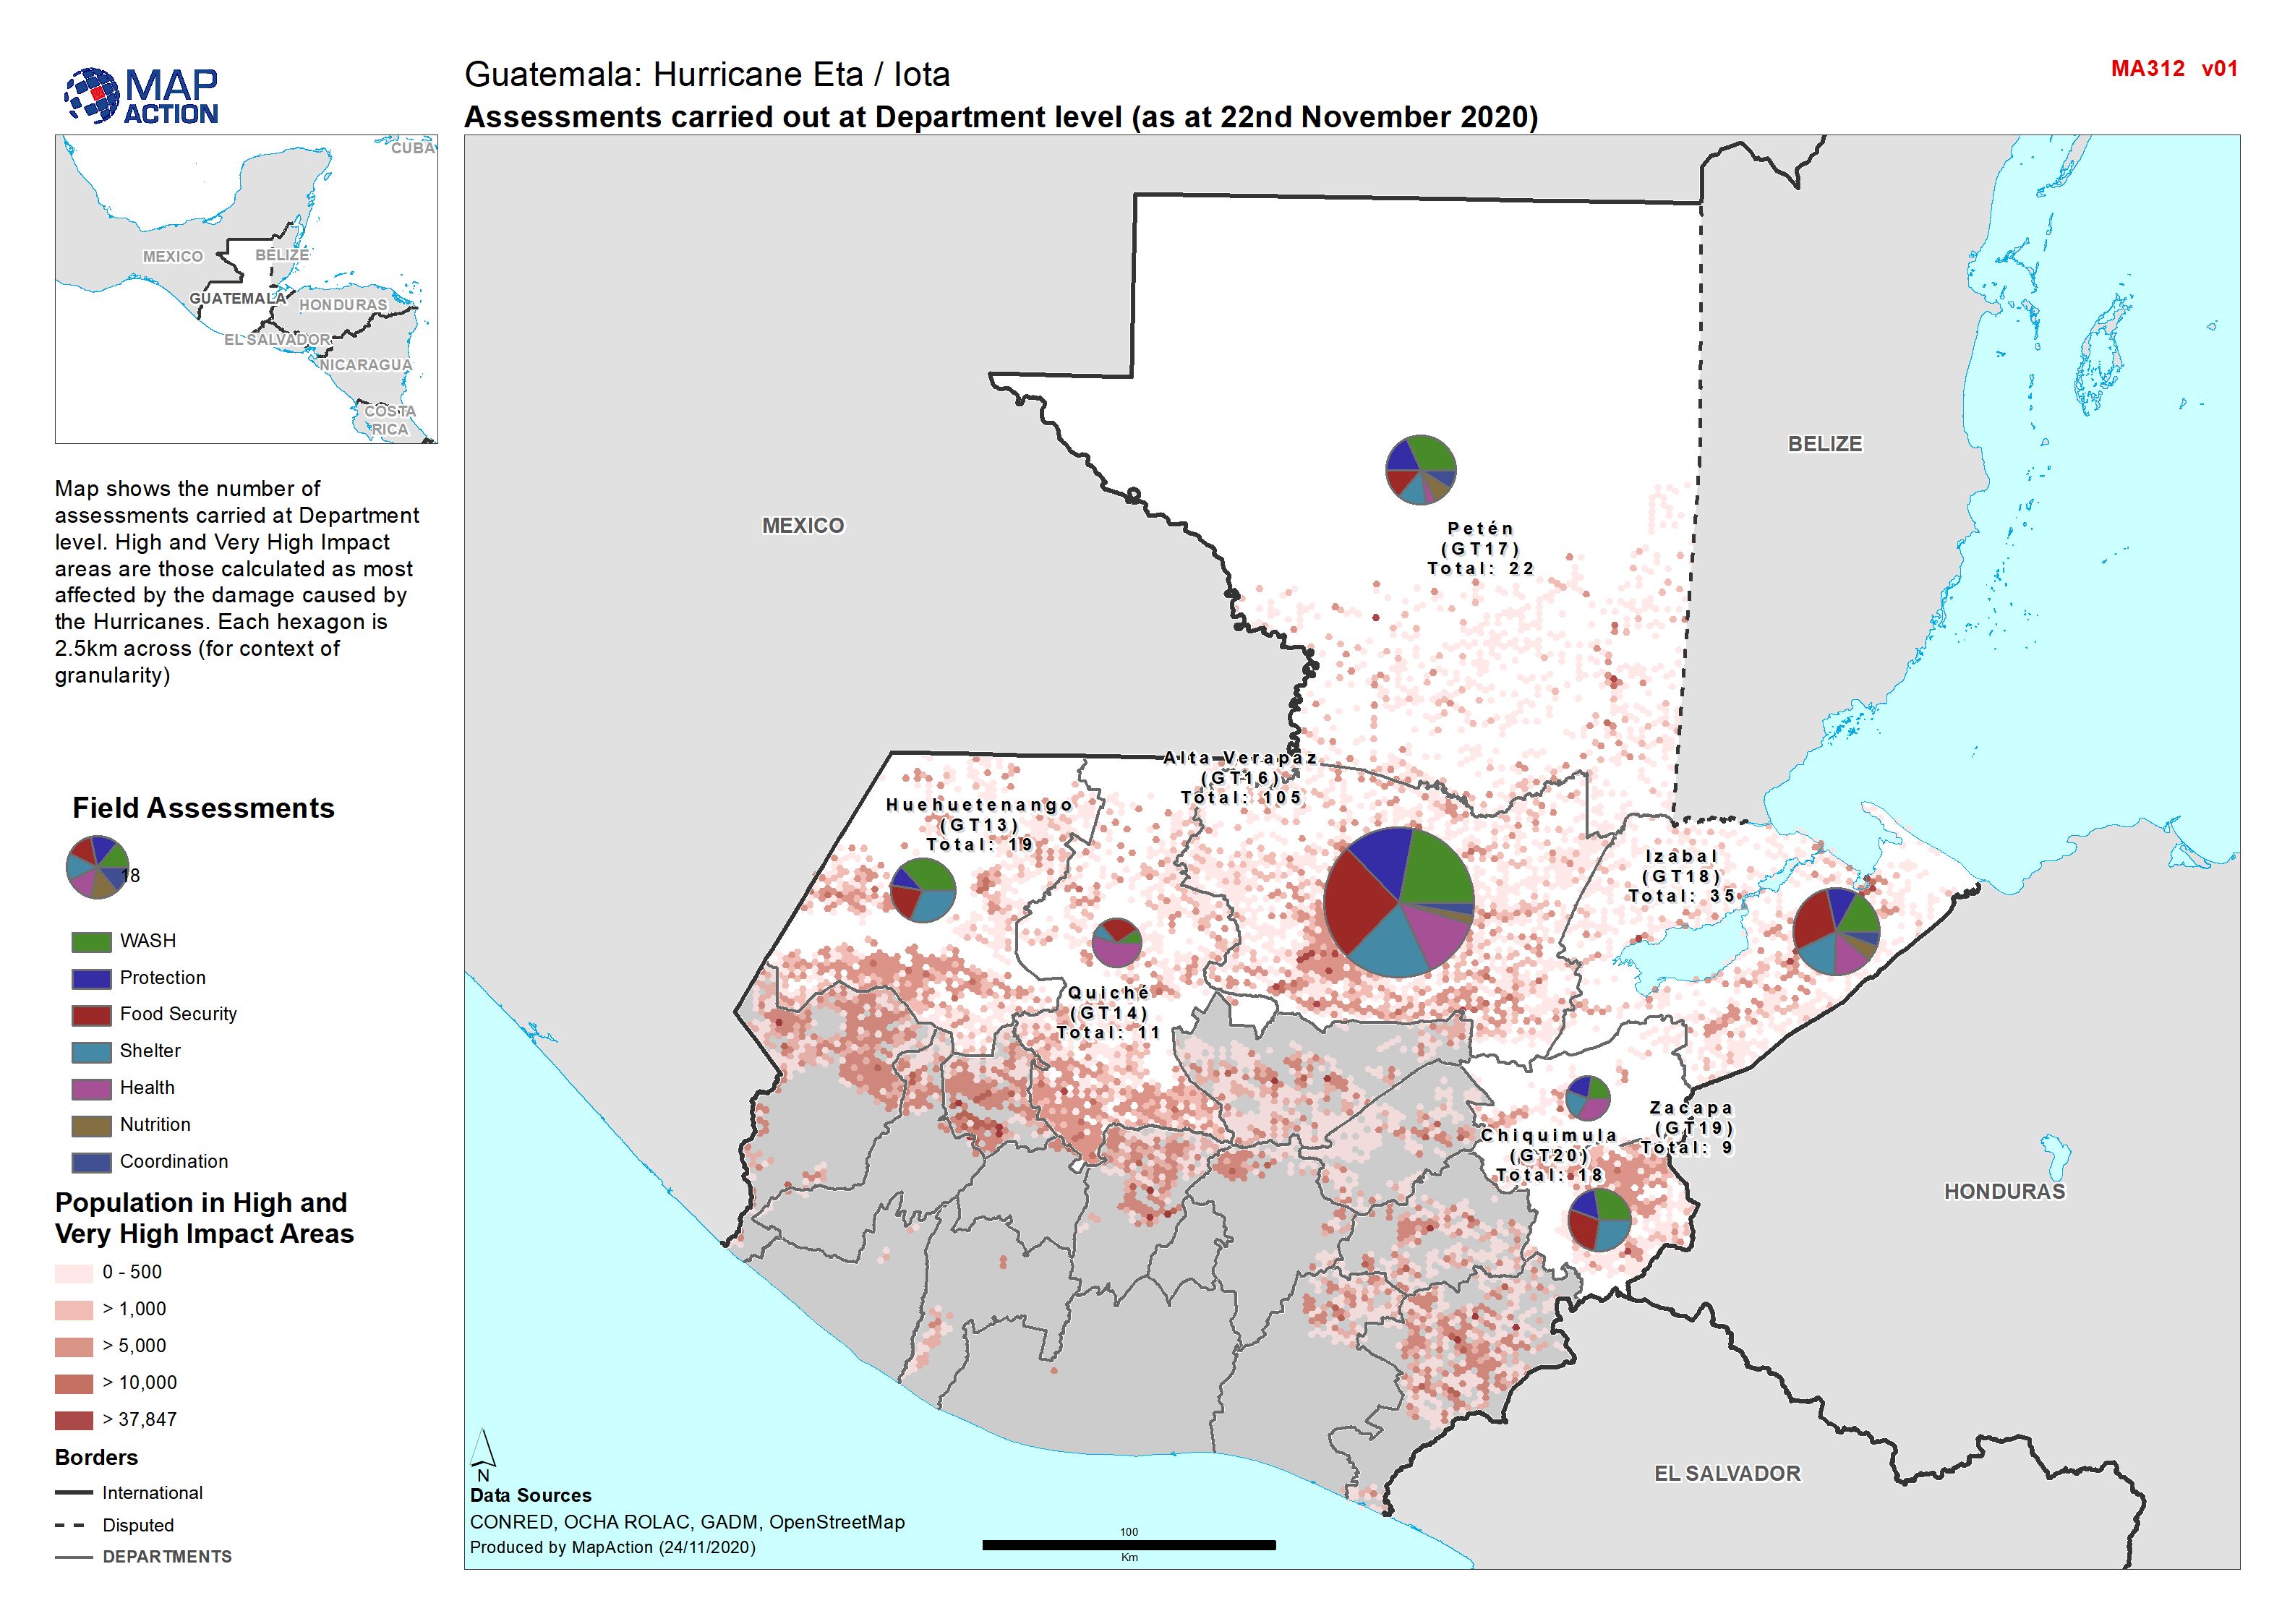
Guatemala: Assessments carried out at Department level (as at 22nd November 2...
Map shows the number of assessments carried at Department level. High and Very High Impact areas are those calculated as most affected by the damage caused by the Hurricanes.... -

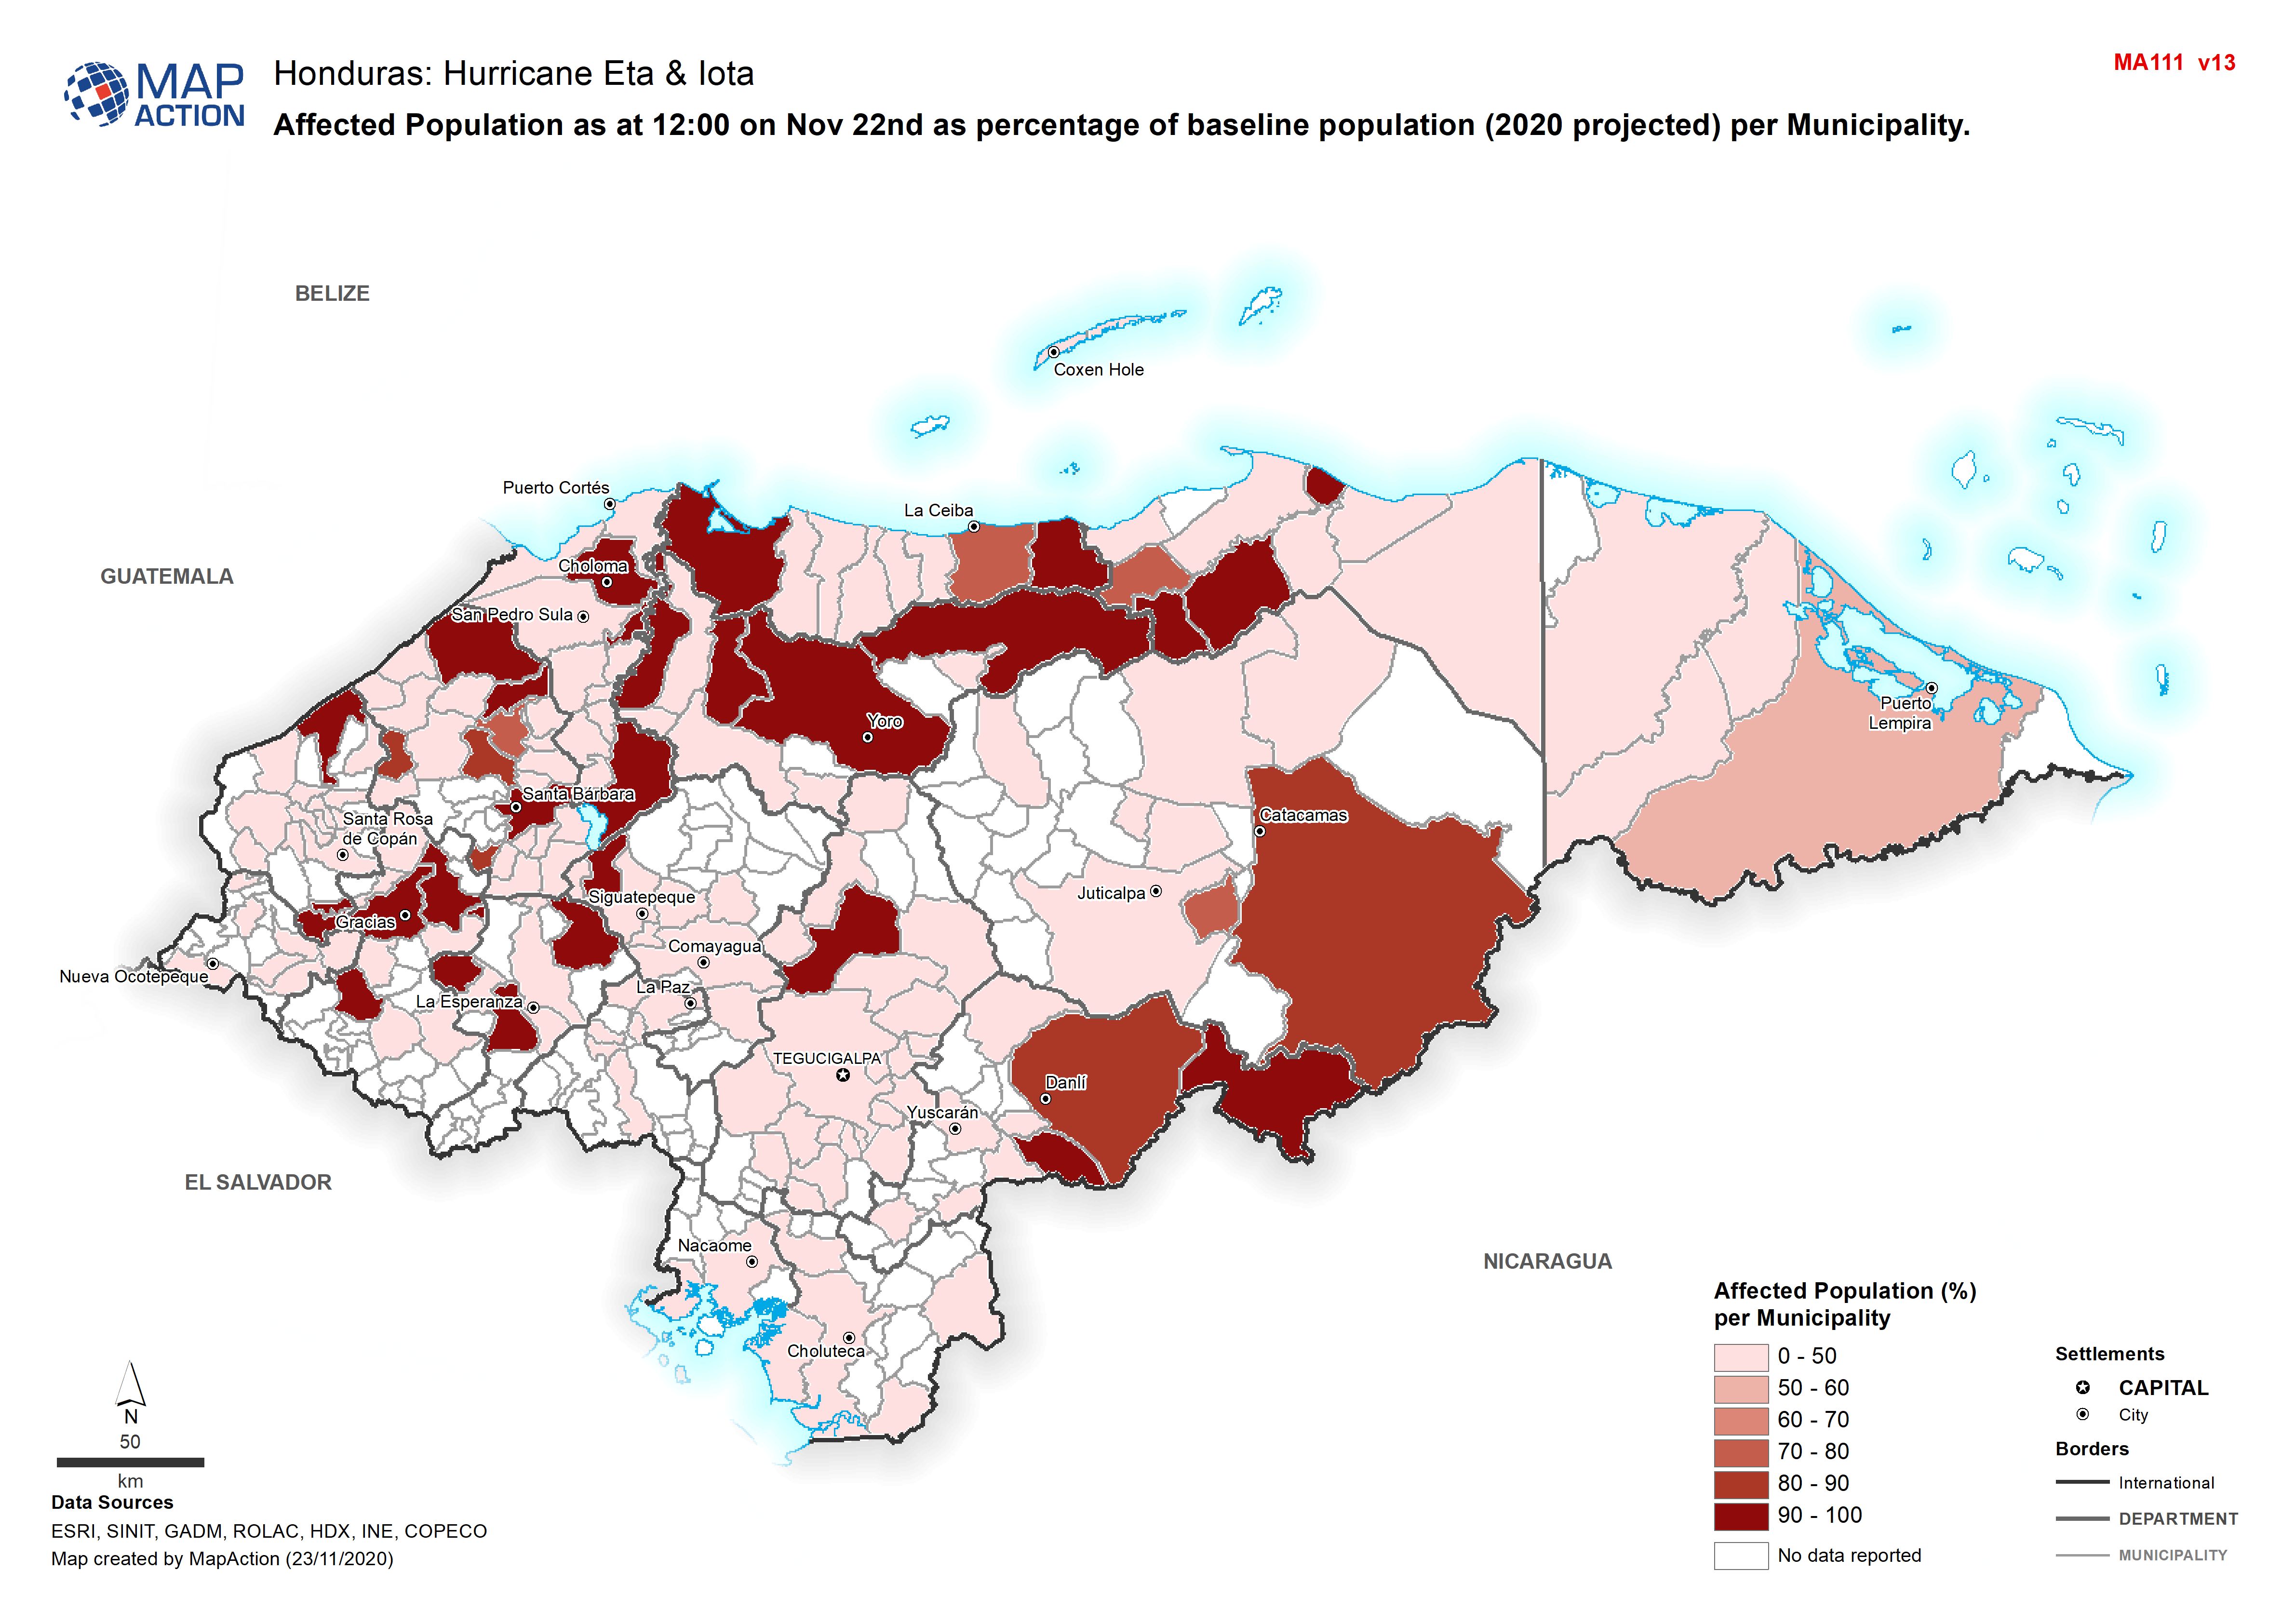
Honduras: Affected Population as at 12:00 on Nov 22nd as percentage of baseli...
Map shows affected population as at 12:00 on Nov 22nd as percentage of baseline population (2020 projected) per Municipality. -

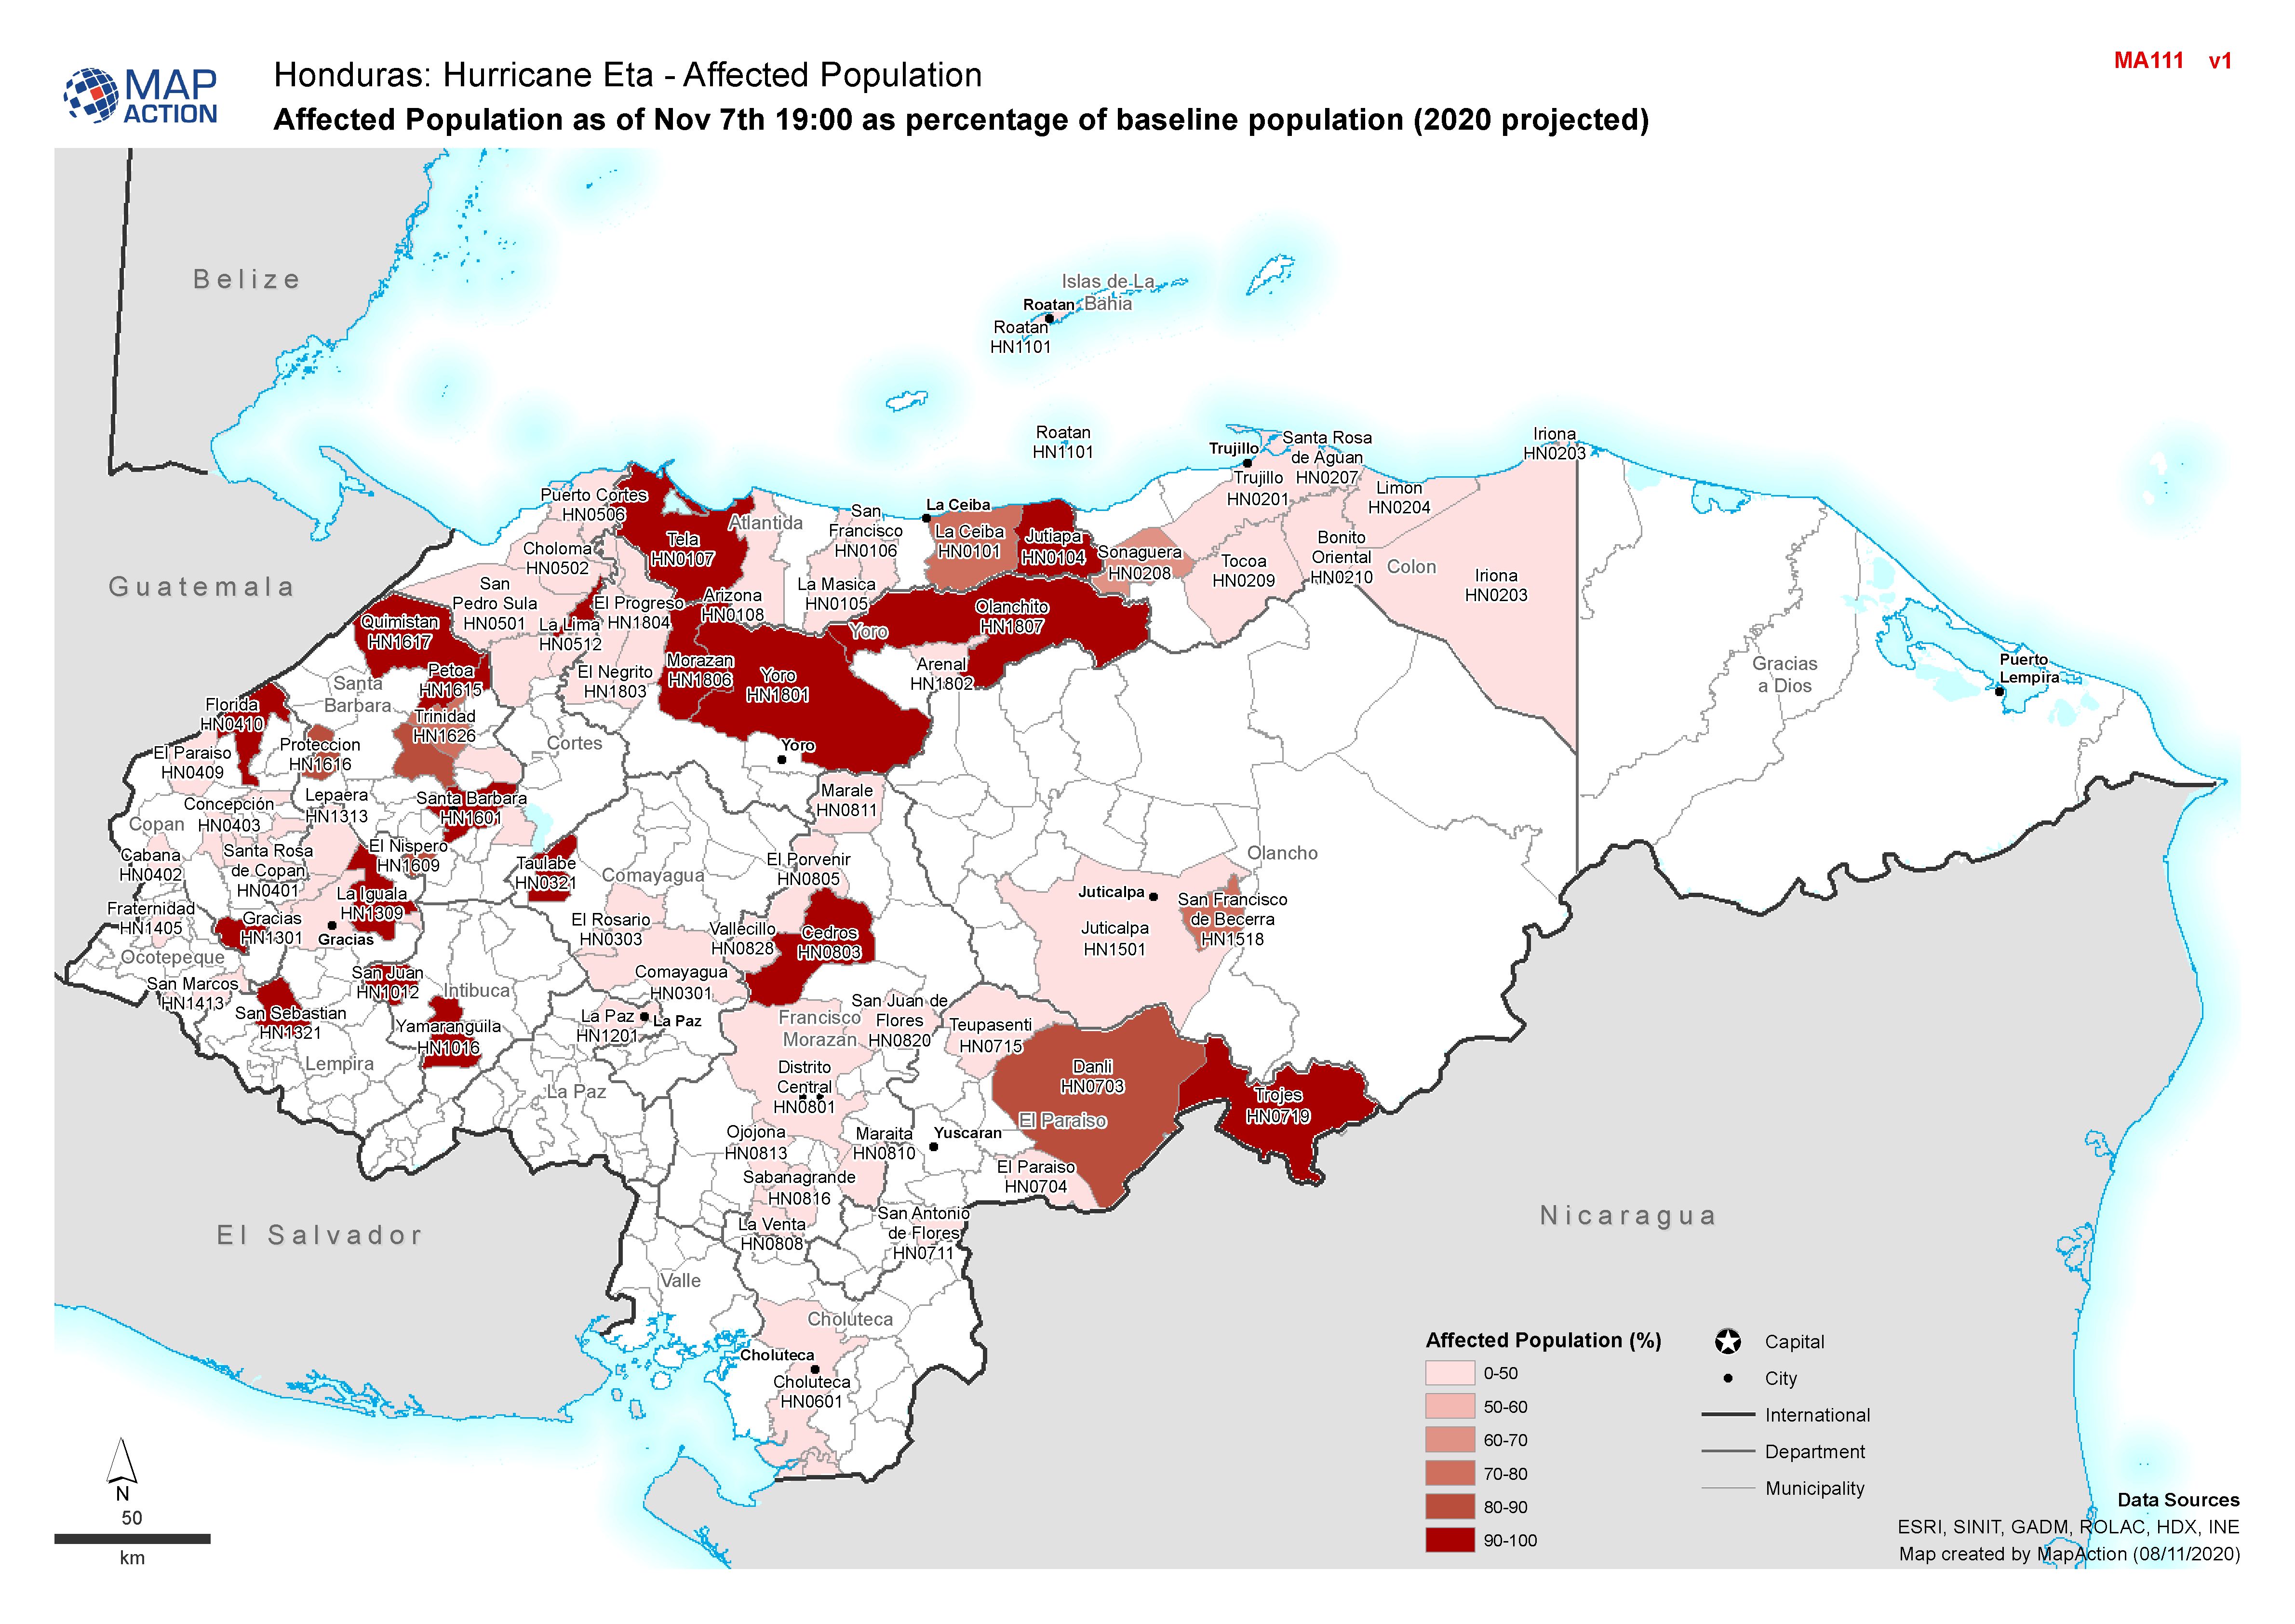
Honduras: Affected Population as of Nov 7th 19:00 as percentage of baseline p...
Affected Population (% of baseline population) for Honduras. -

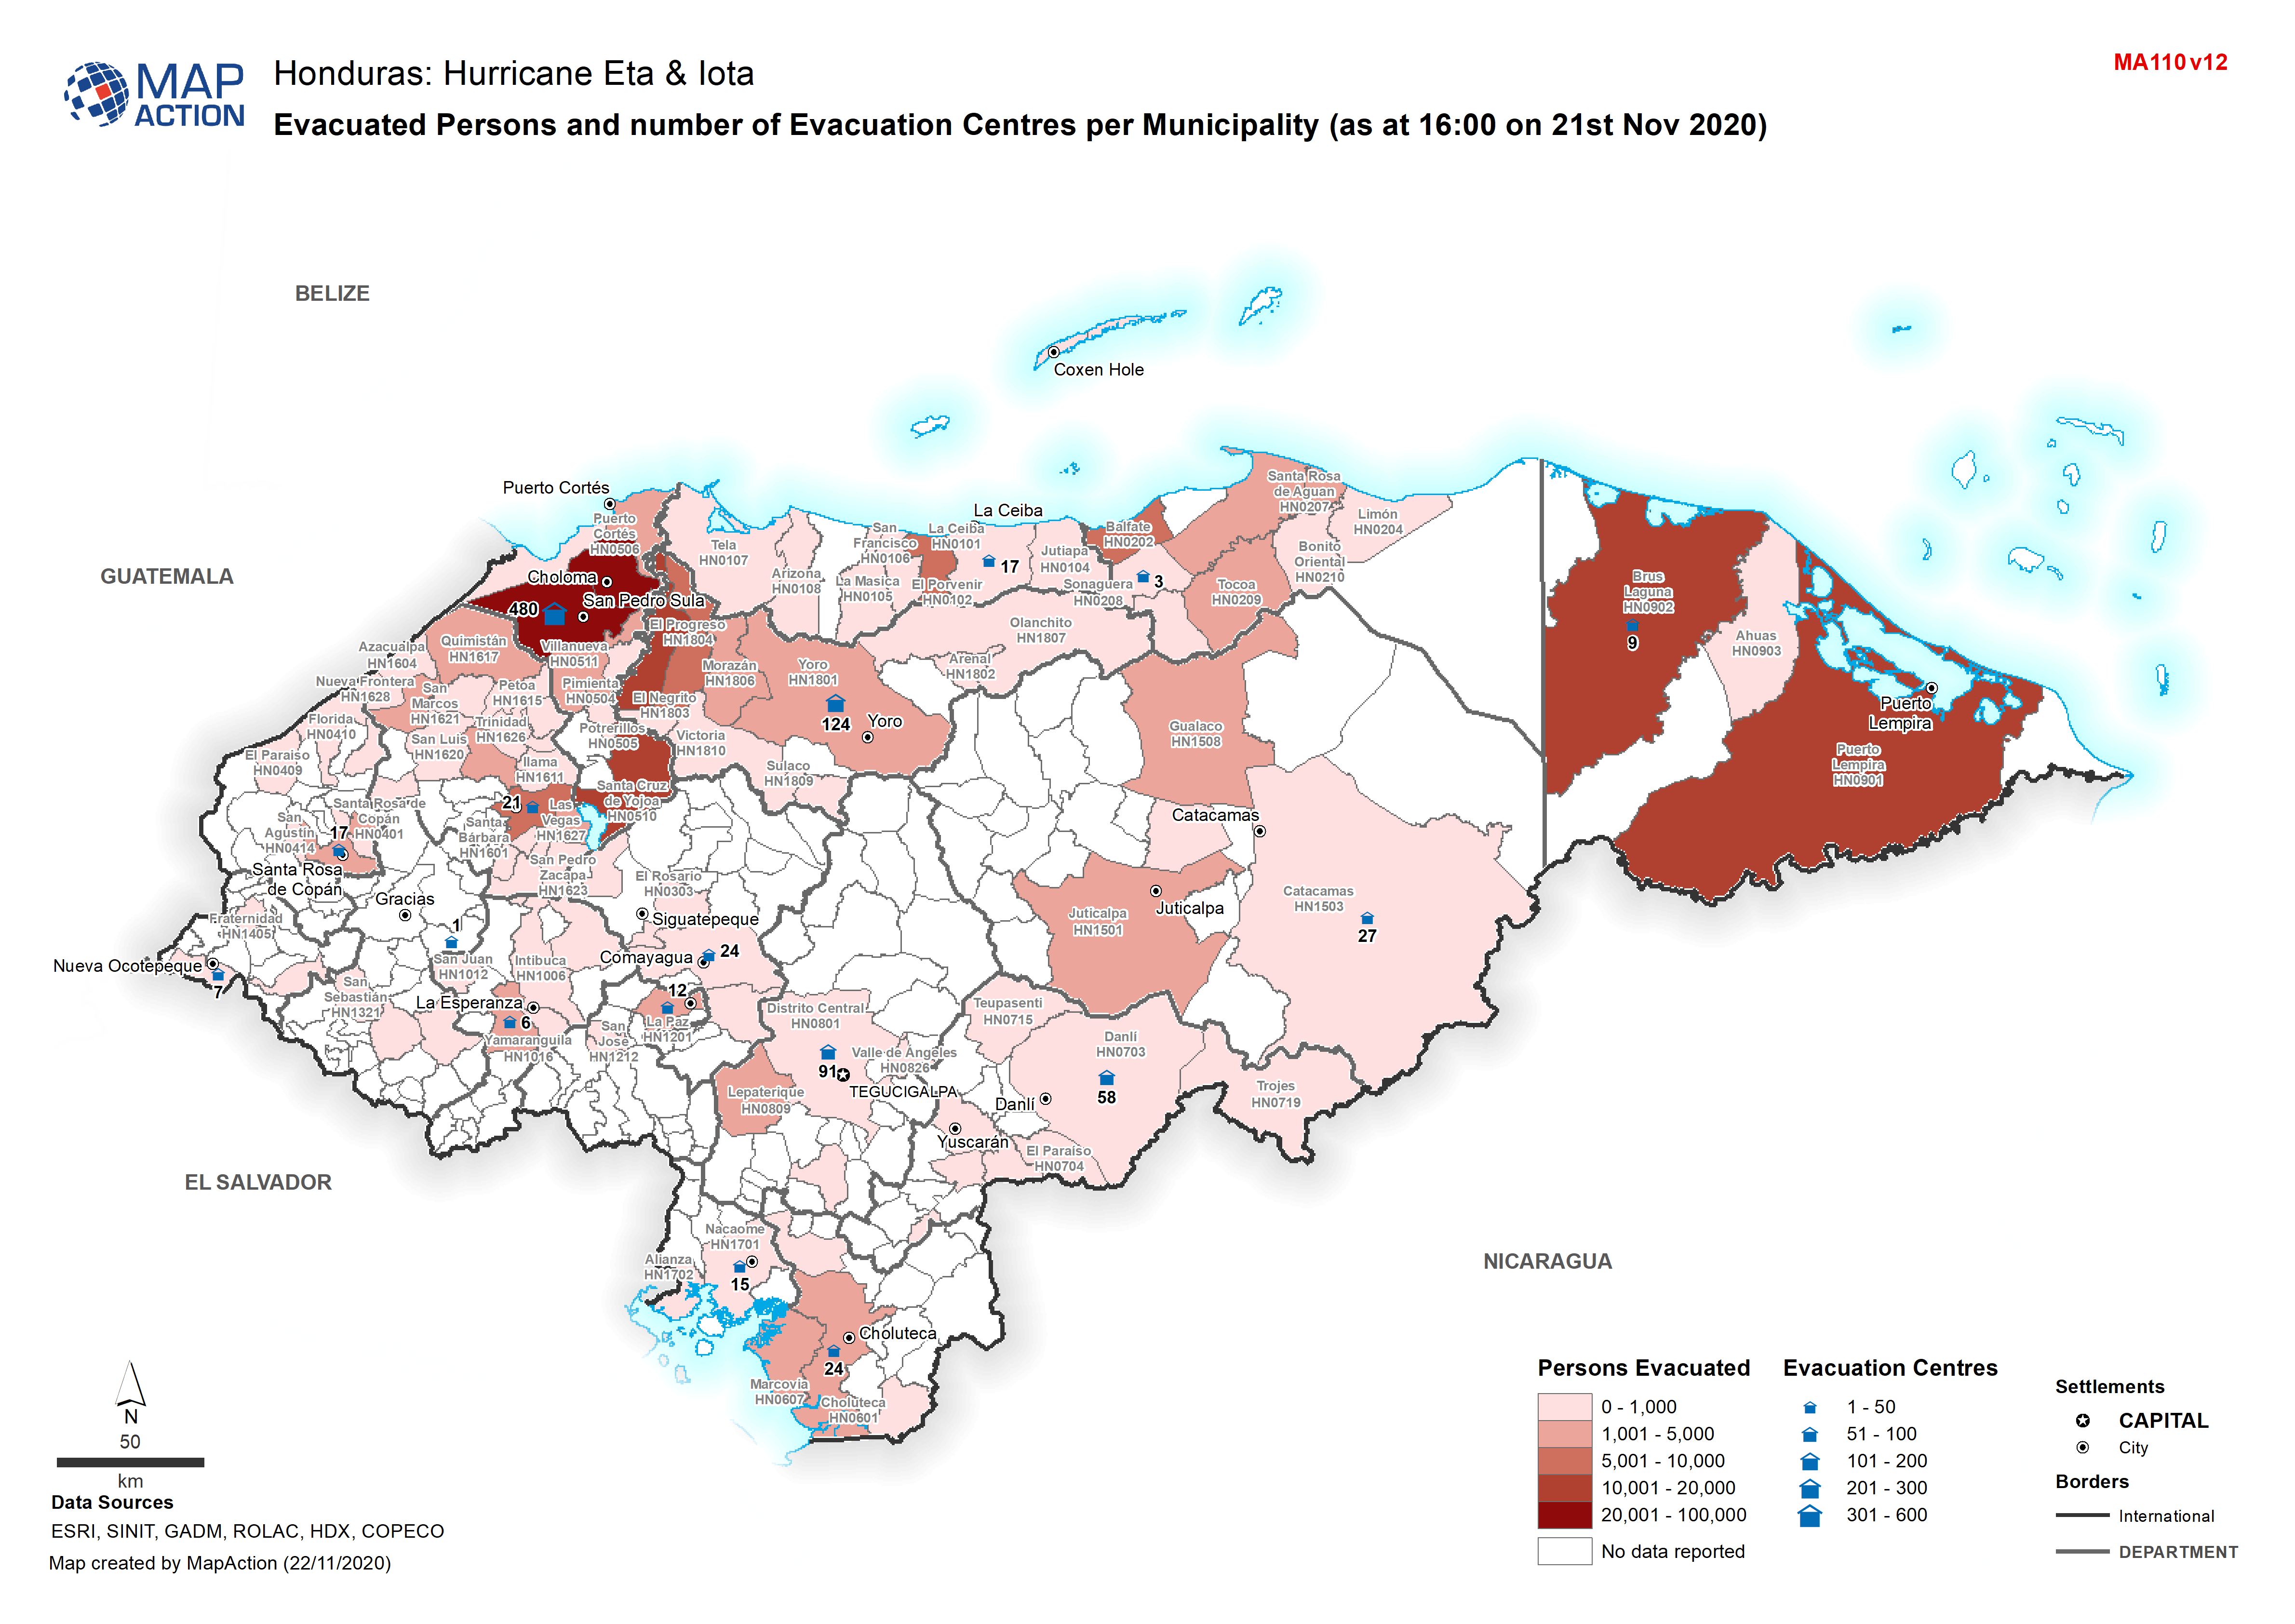
Honduras: Evacuated Persons and number of Evacuation Centres per Municipality...
Map shows evacuated persons and number of evacuation centres per Municipality (as at 16:00 on 21st Nov 2020) -

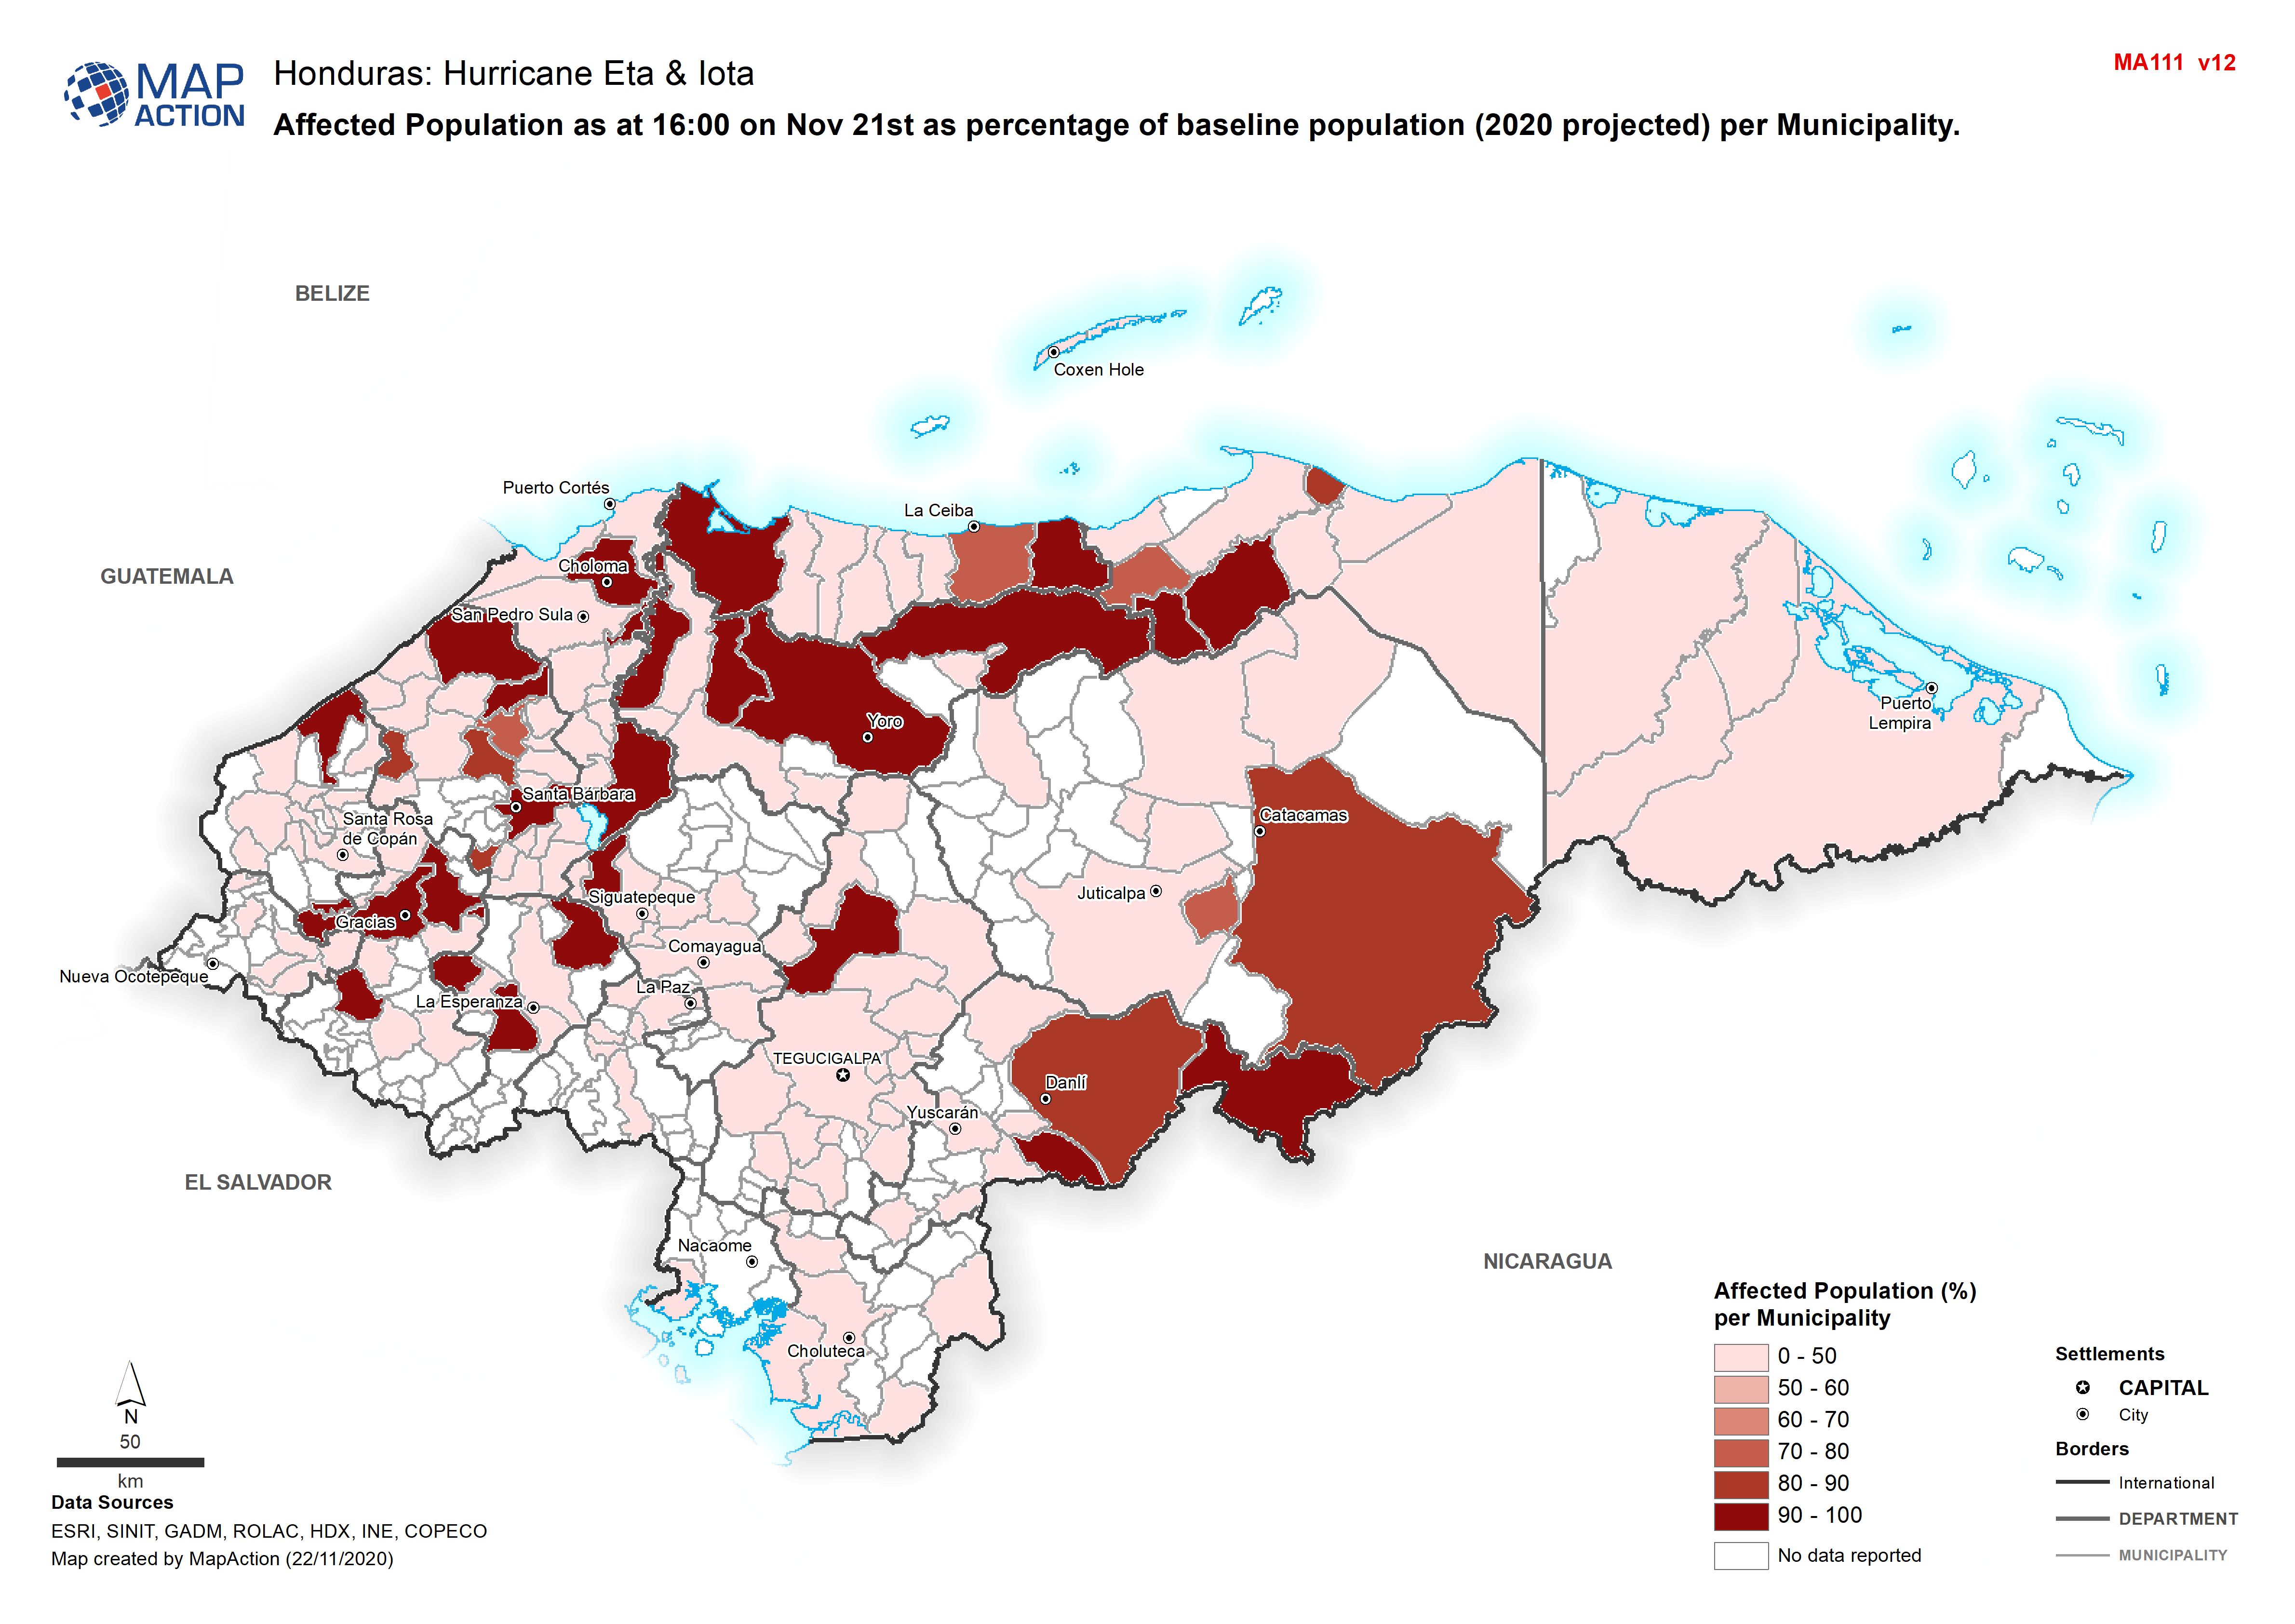
Honduras: Affected Population as at 16:00 on Nov 21st as percentage of baseli...
Map shows affected population as at 16:00 on Nov 21st as percentage of baseline population (2020 projected) per Municipality. -

Honduras: Affected Population as at 04:00 on Nov 20th as percentage of baseli...
Map shows affected population as at 04:00 on Nov 20th as percentage of baseline population (2020 projected) per Municipality. -
Honduras: Evacuated Persons and number of Evacuation Centres per Municipality...
Map shows evacuated persons and number of evacuation centres per Municipality (as at 04:00 on 20th Nov 2020) -
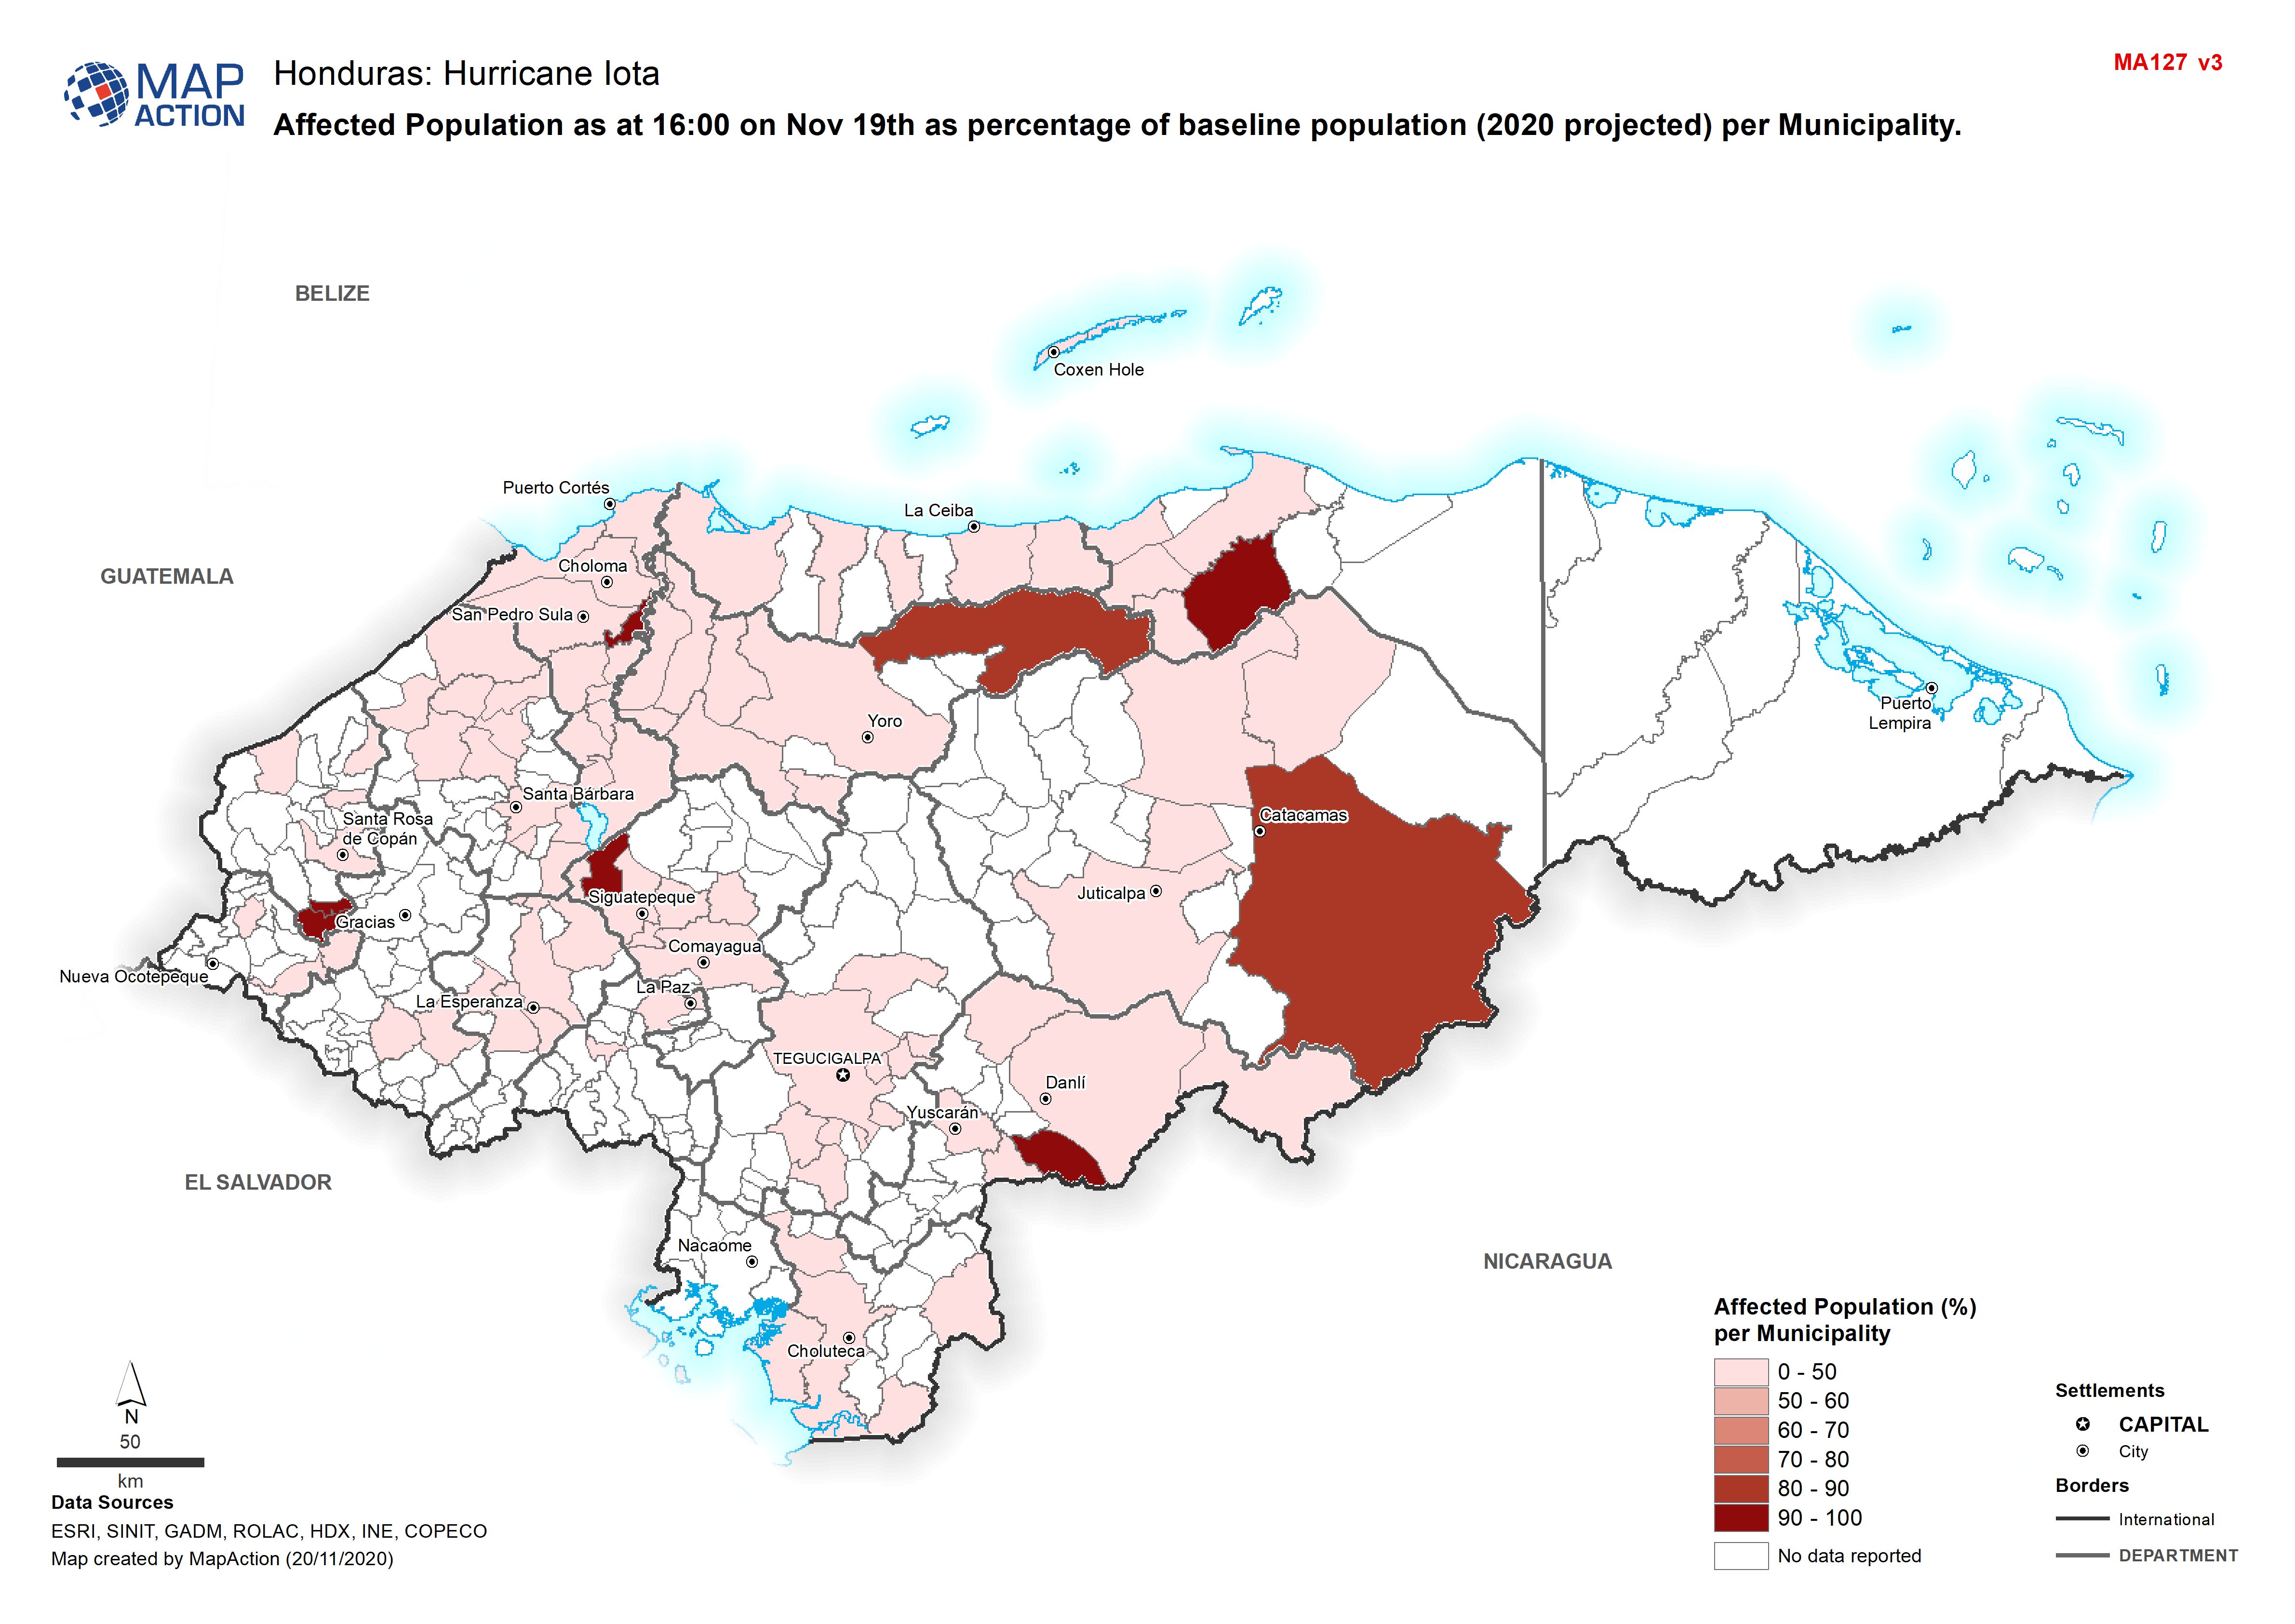
Honduras: Hurricane Iota, Affected Population as at 16:00 on Nov 19th as perc...
Map shows affected population as at 16:00 on Nov 19th as percentage of baseline population (2020 projected) per Municipality. -
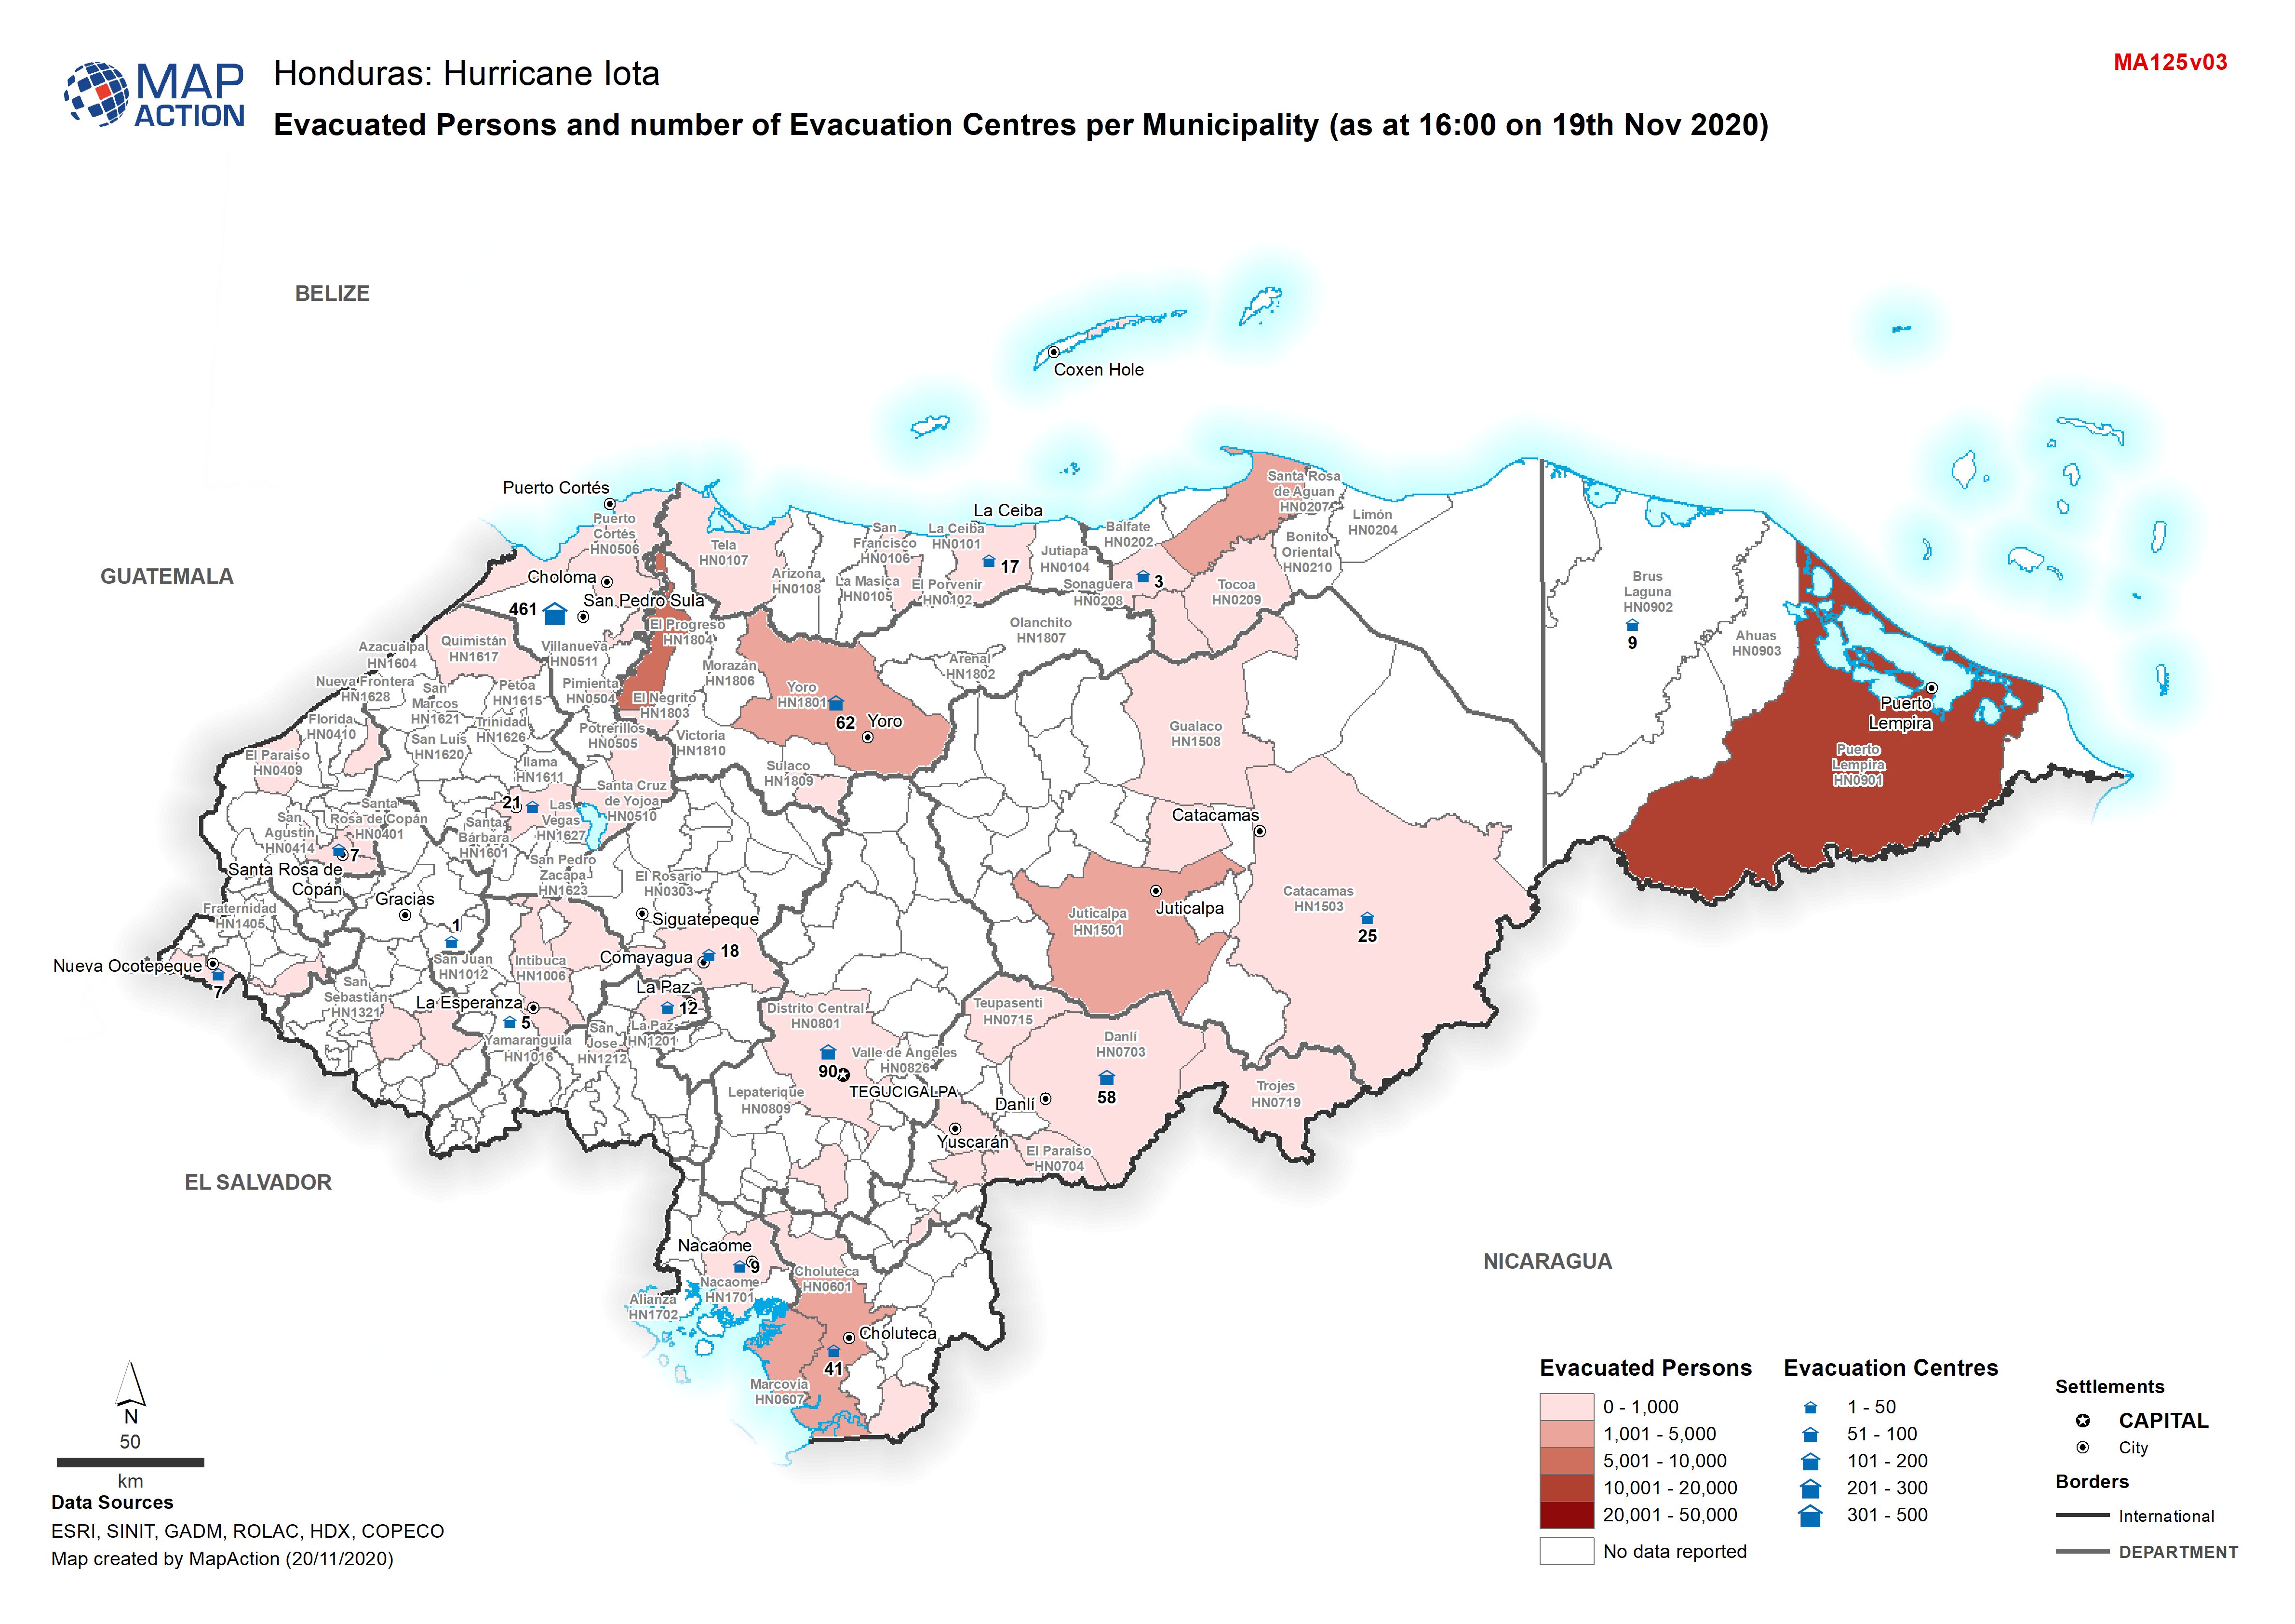
Honduras: Hurricate Iota, Evacuated Persons and number of Evacuation Centres ...
Map shows evacuated persons and number of evacuation centres per Municipality (as at 16:00 on19th Nov 2020) -
Honduras: Affected Population as at 16:00 on Nov 19th as percentage of baseli...
Map shows affected population as at 16:00 on Nov 19th as percentage of baseline population (2020 projected) per Municipality. -

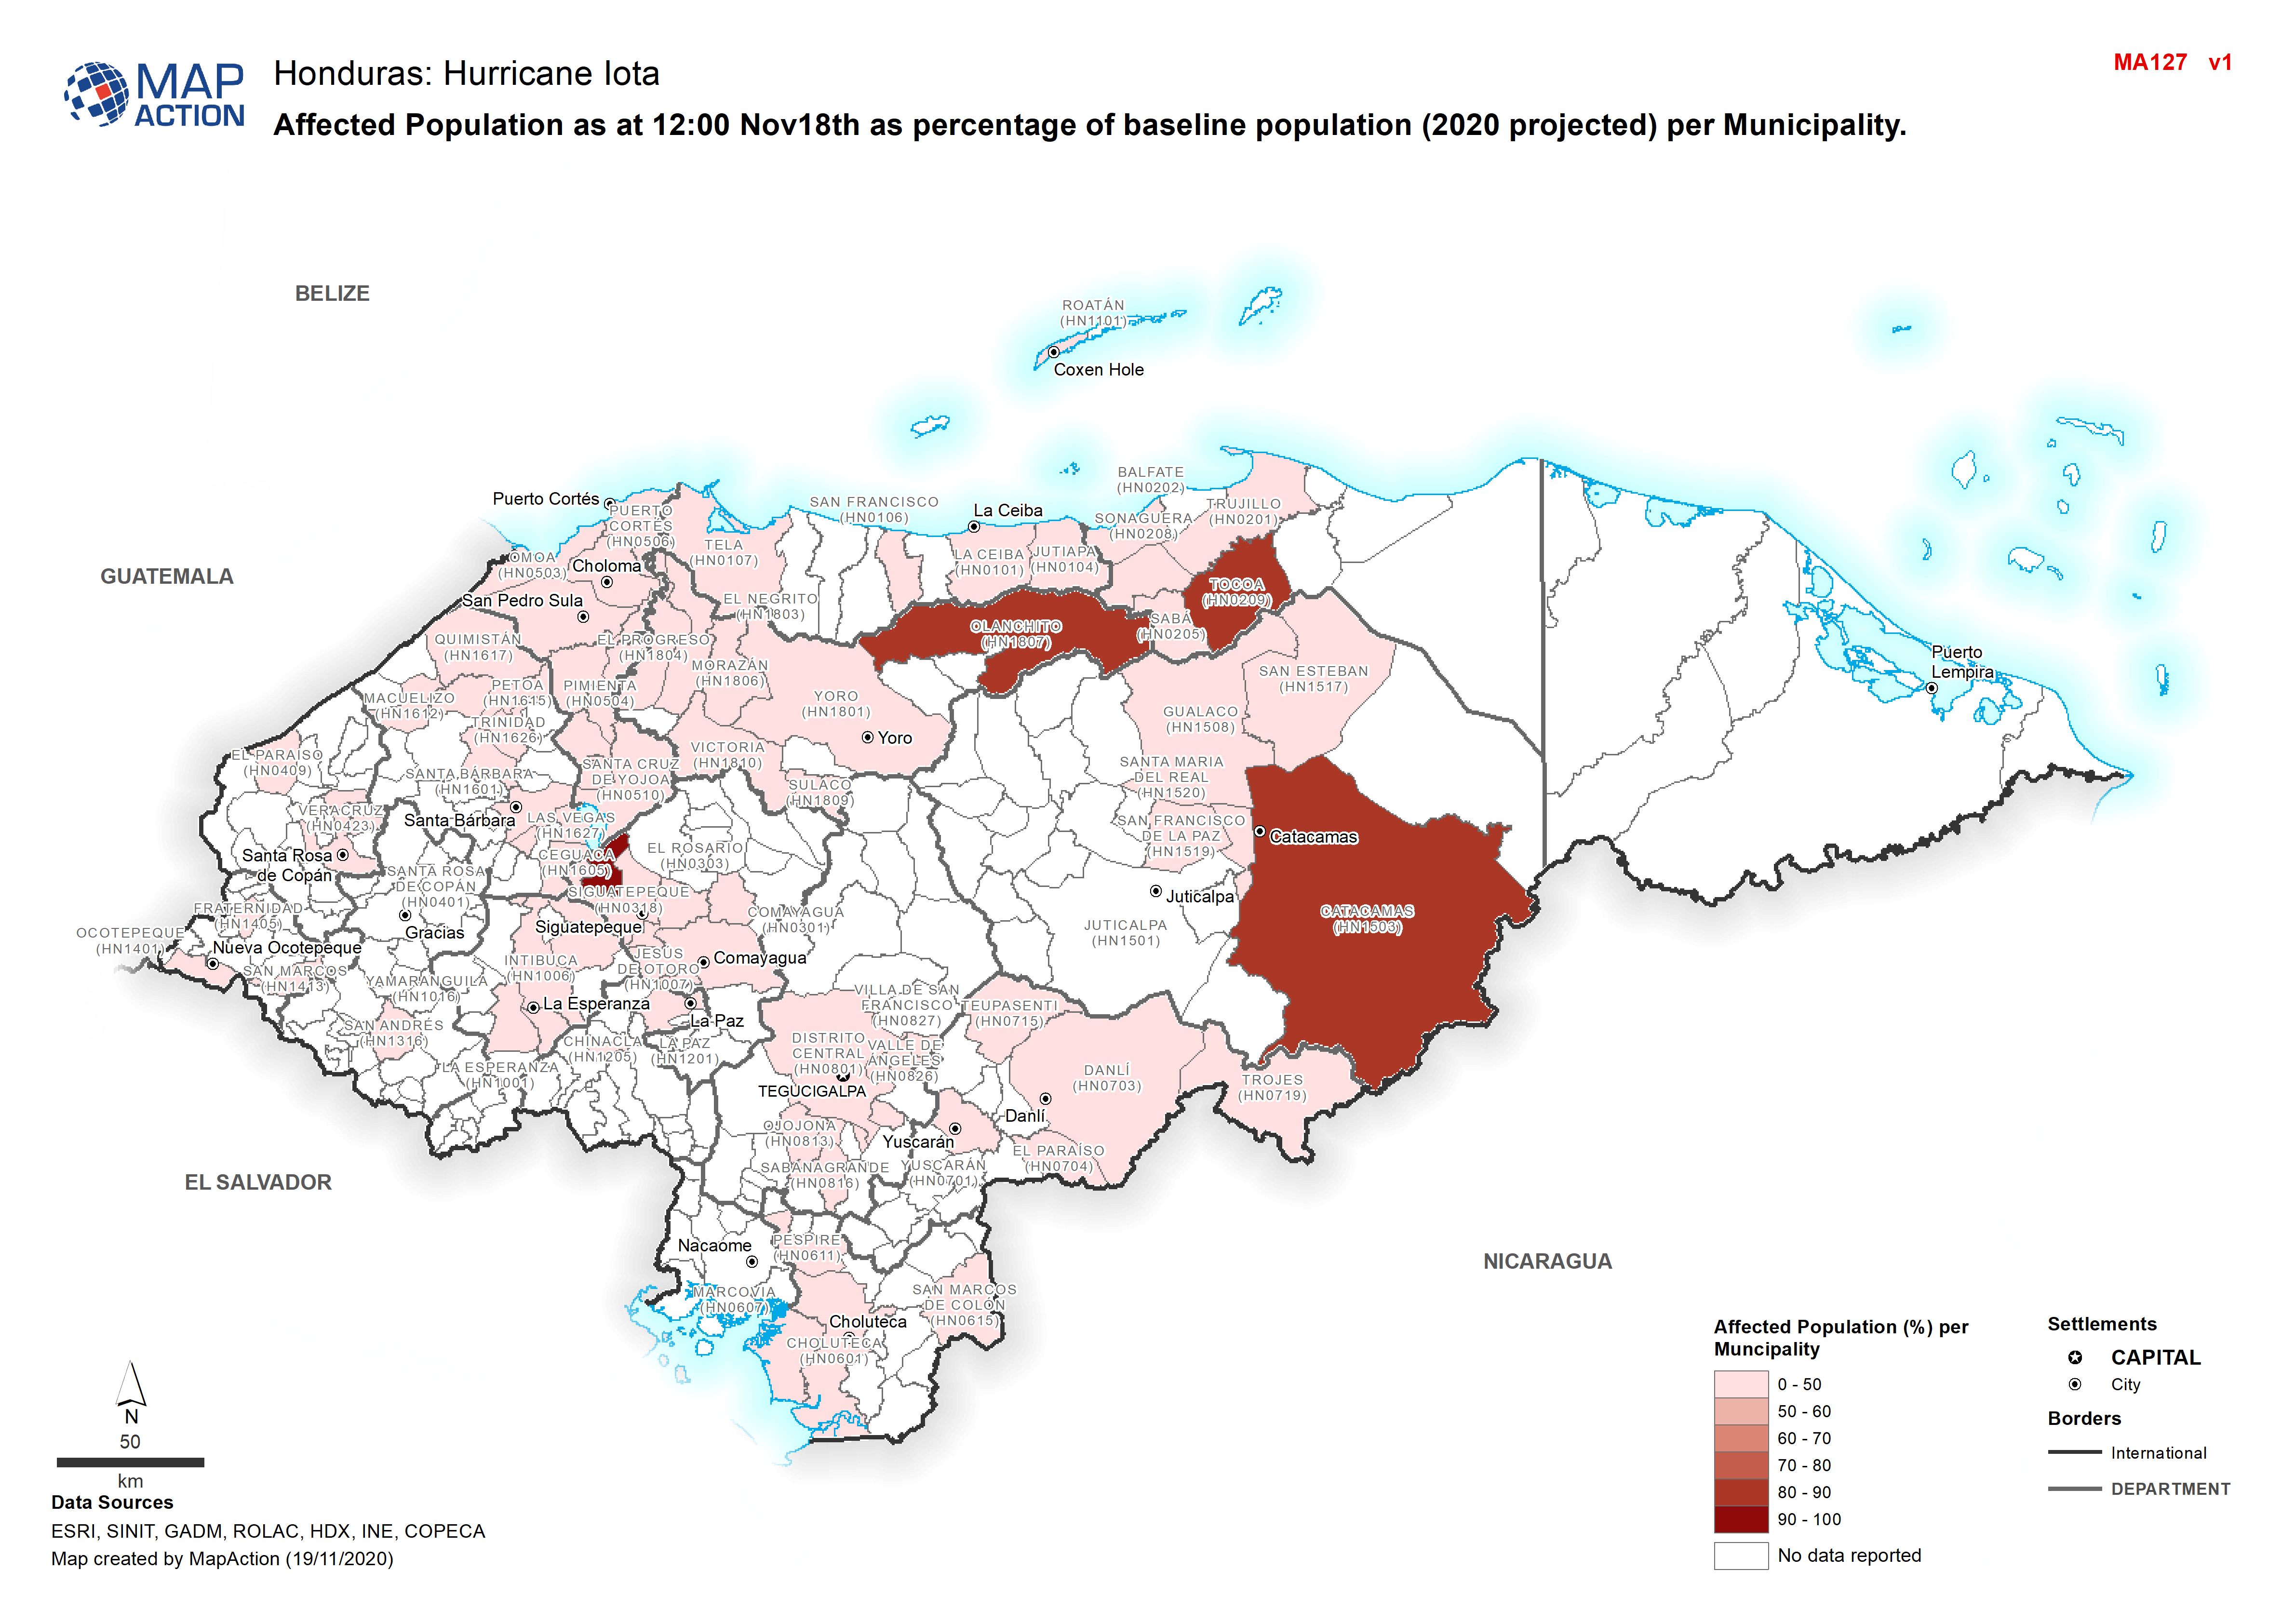
Honduras: Affected Population as at 12:00 Nov 18th as percentage of baseline ...
Map shows affected population as at Nov 15th as percentage of baseline population (2020 projected) per Municipality. -

Centro América: Huacán Iota - Trayectoria potencial de Iota e inundaciones de...
This map shows the storm track for hurricane Iota, with potentially affected administrative departments for Nicaragua and Honduras. It also includes previous flooded areas from... -
Honduras: Evacuated Persons and number of Evacuation Centres per Municipality...
Map shows evacuated persons and number of evacuation centres per Municipality (as at 16th Nov 2020) -

Honduras: Affected Population as at Nov 16th as percentage of baseline popula...
Map shows affected population as at Nov 16th as percentage of baseline population (2020 projected) per Municipality.