-
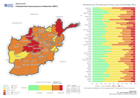
Afghanistan: Projected food Insecurity (June to November 2021)
Map and charts show the projected IPC phases per province. -

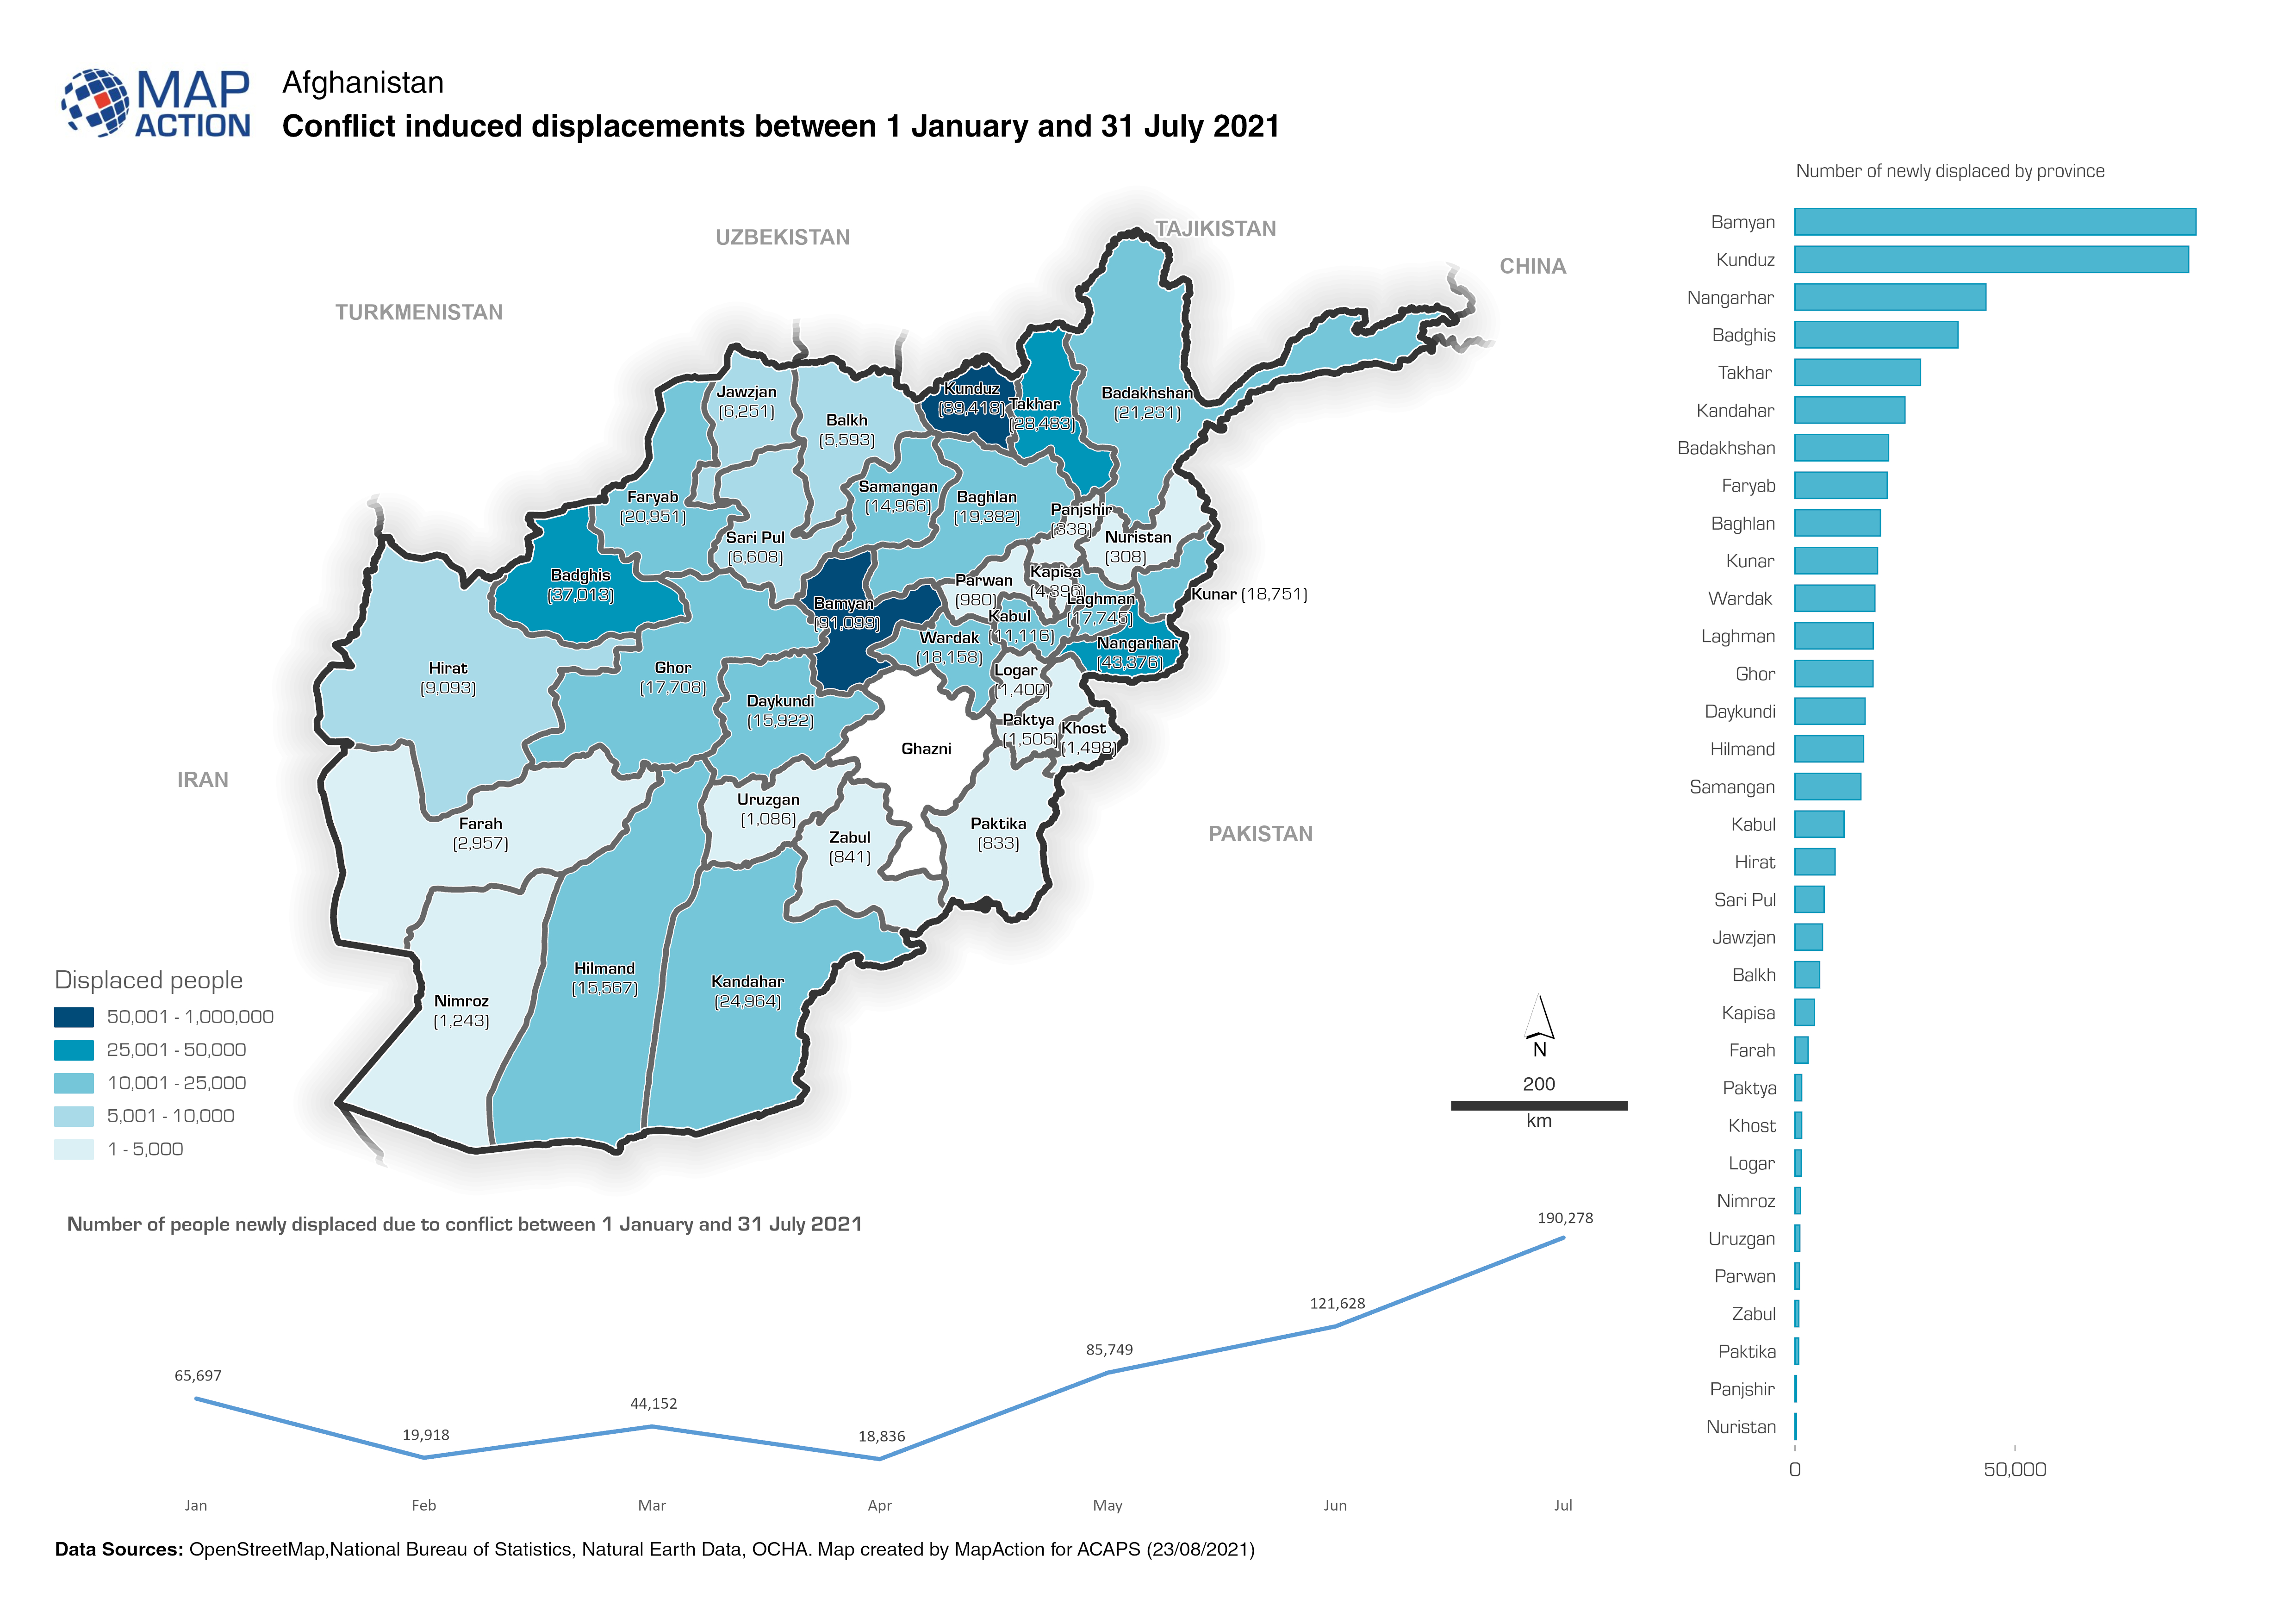
Afghanistan: Conflict induced displacements between 1 January and 31 July 2021
Map shows the number of people newly displaced due to conflict between 1 January and 31 July 2021 -
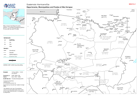
Guatemala: Admin and Pcode Atlas
Map shows the Departments (Admin 1) and Municipalities (Admin 2) boundaries with Pcodes -

Reference map of Saint Vincent
Map shows detailed features of St Vincent including settlements, roads and phyiscal features. -

Reference map of Saint Vincent
Detailed reference map at Parish level (Admin 1) showing settlements, transport, and physical features. -

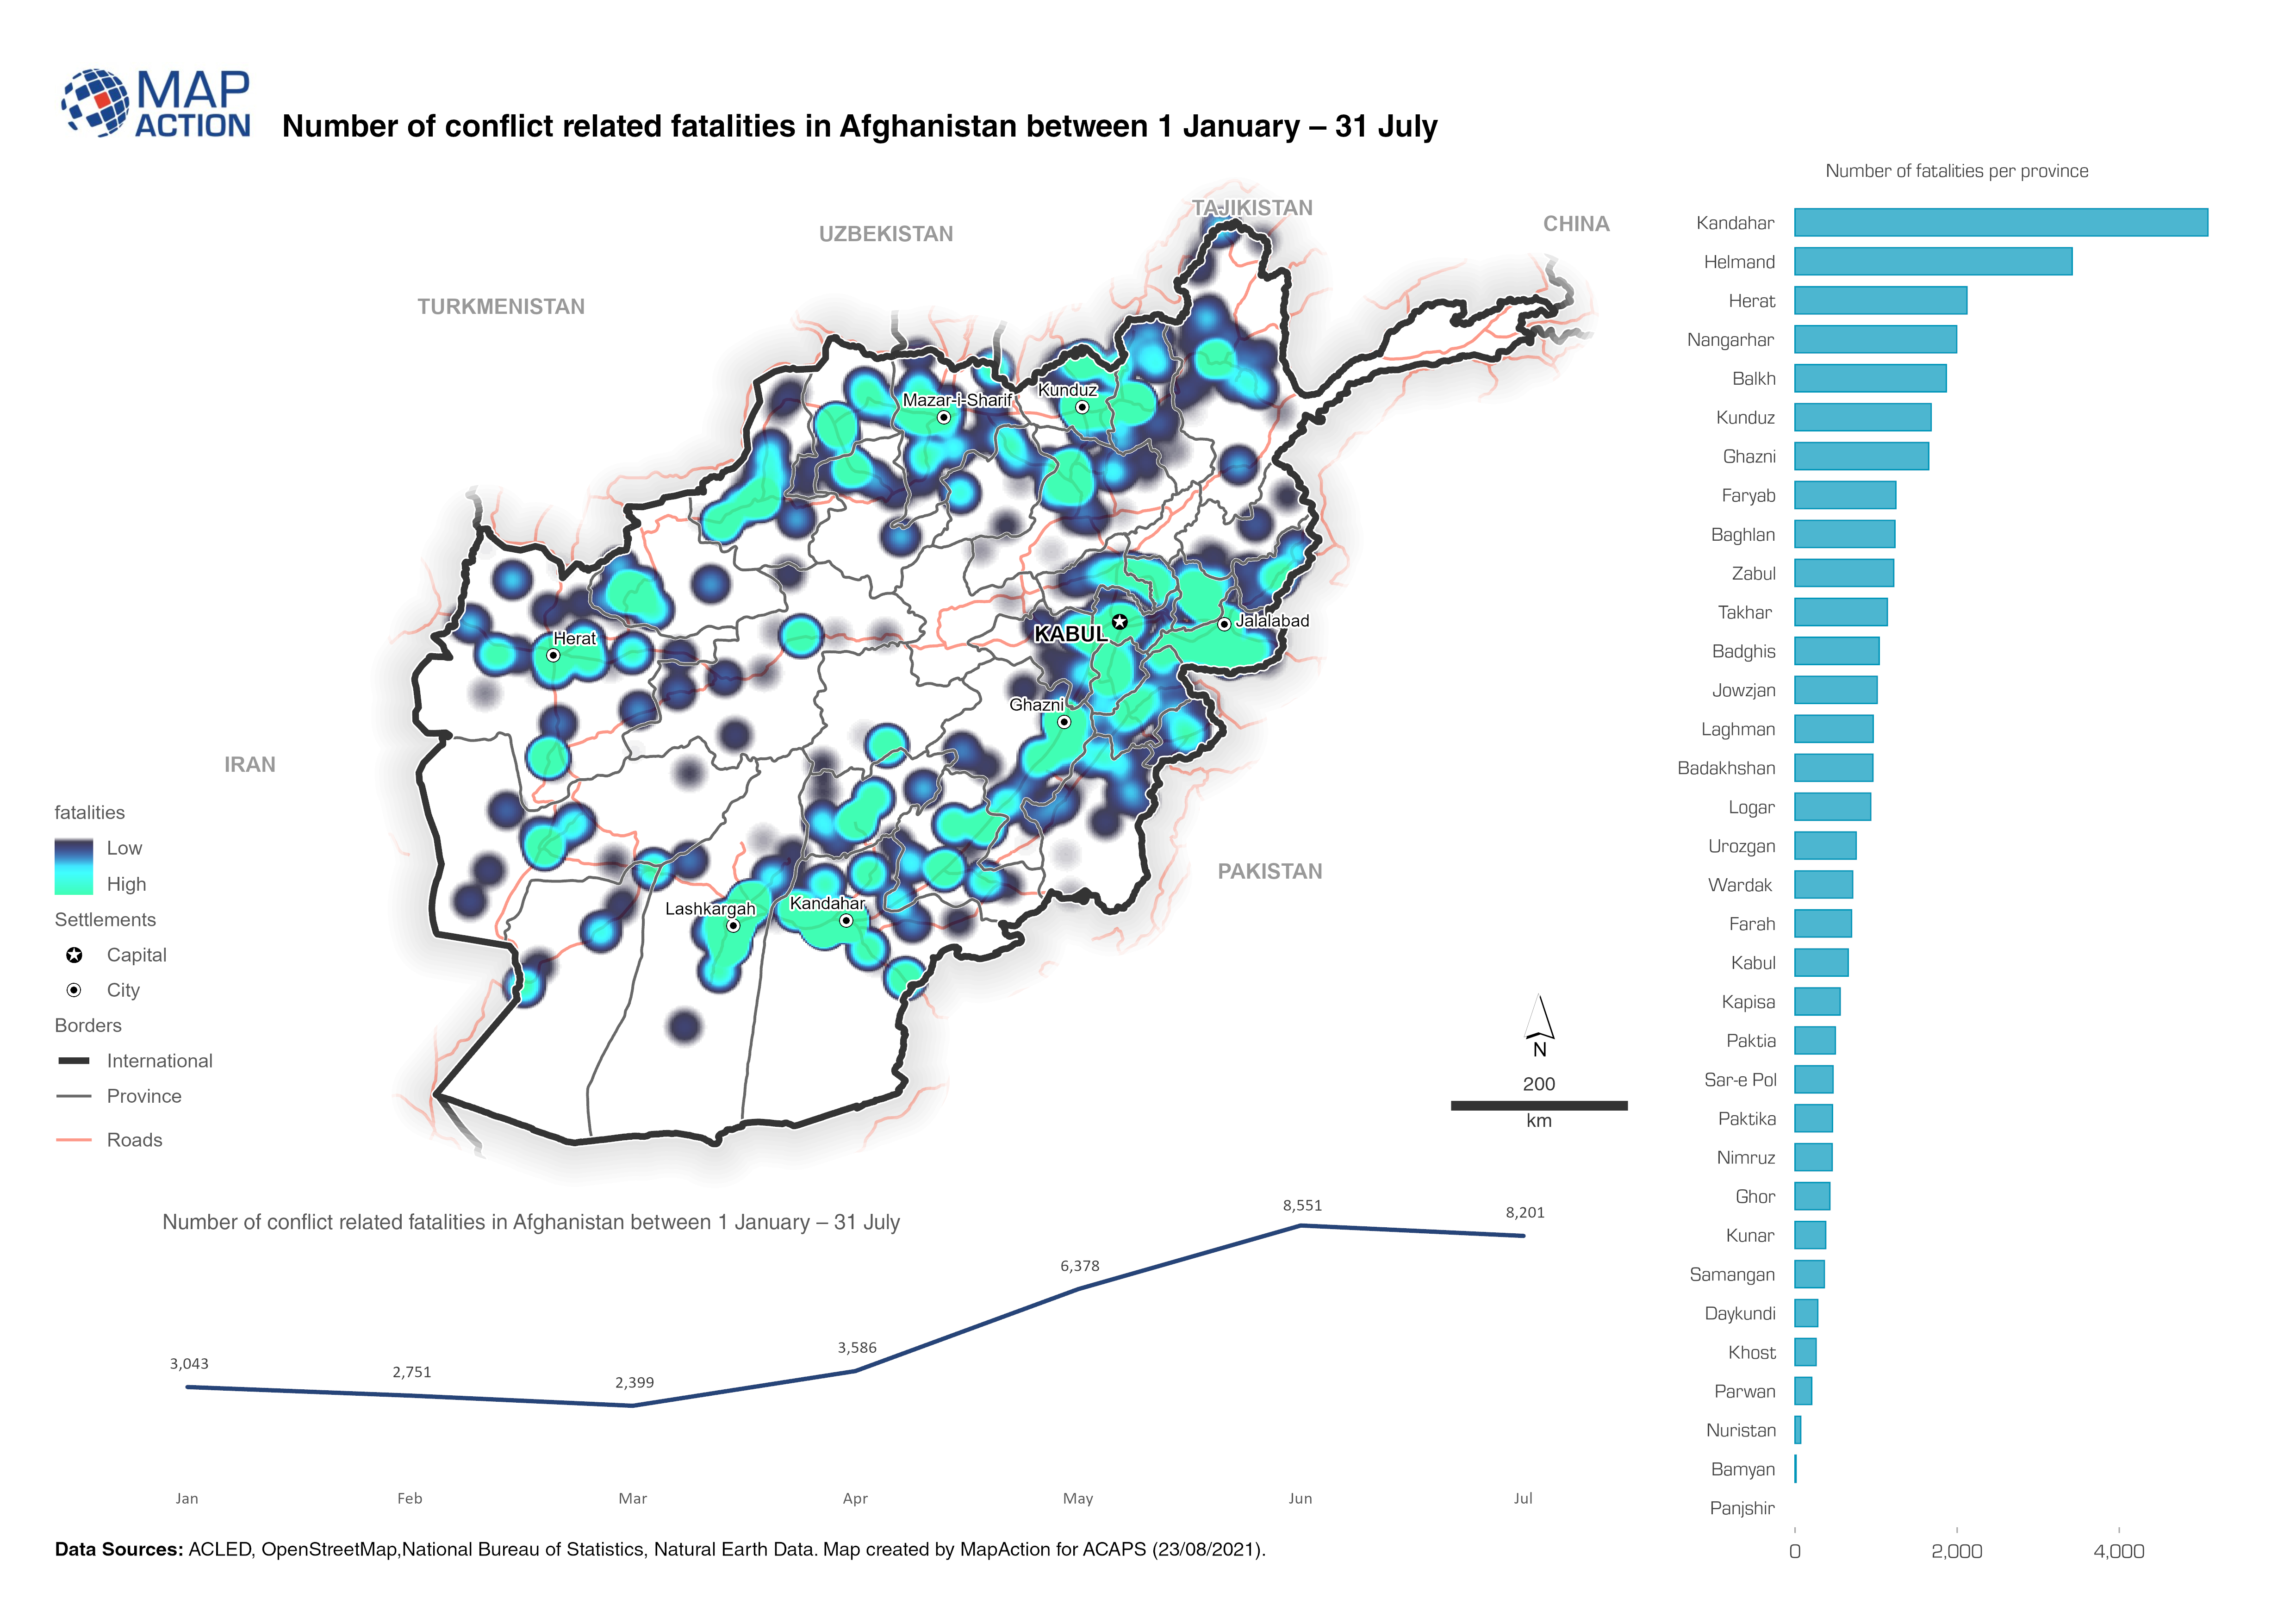
Afghanistan: Number of fatalities per event type (1 January to 31 July 2021)
The map provides an overview of different security related incidents and fatalities. -
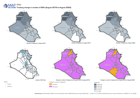
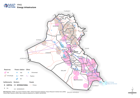
Iraq: Tracking change in numbers of IDPs (August 2018 to August 2020)
Maps show the number of displaced people and the change between years. -

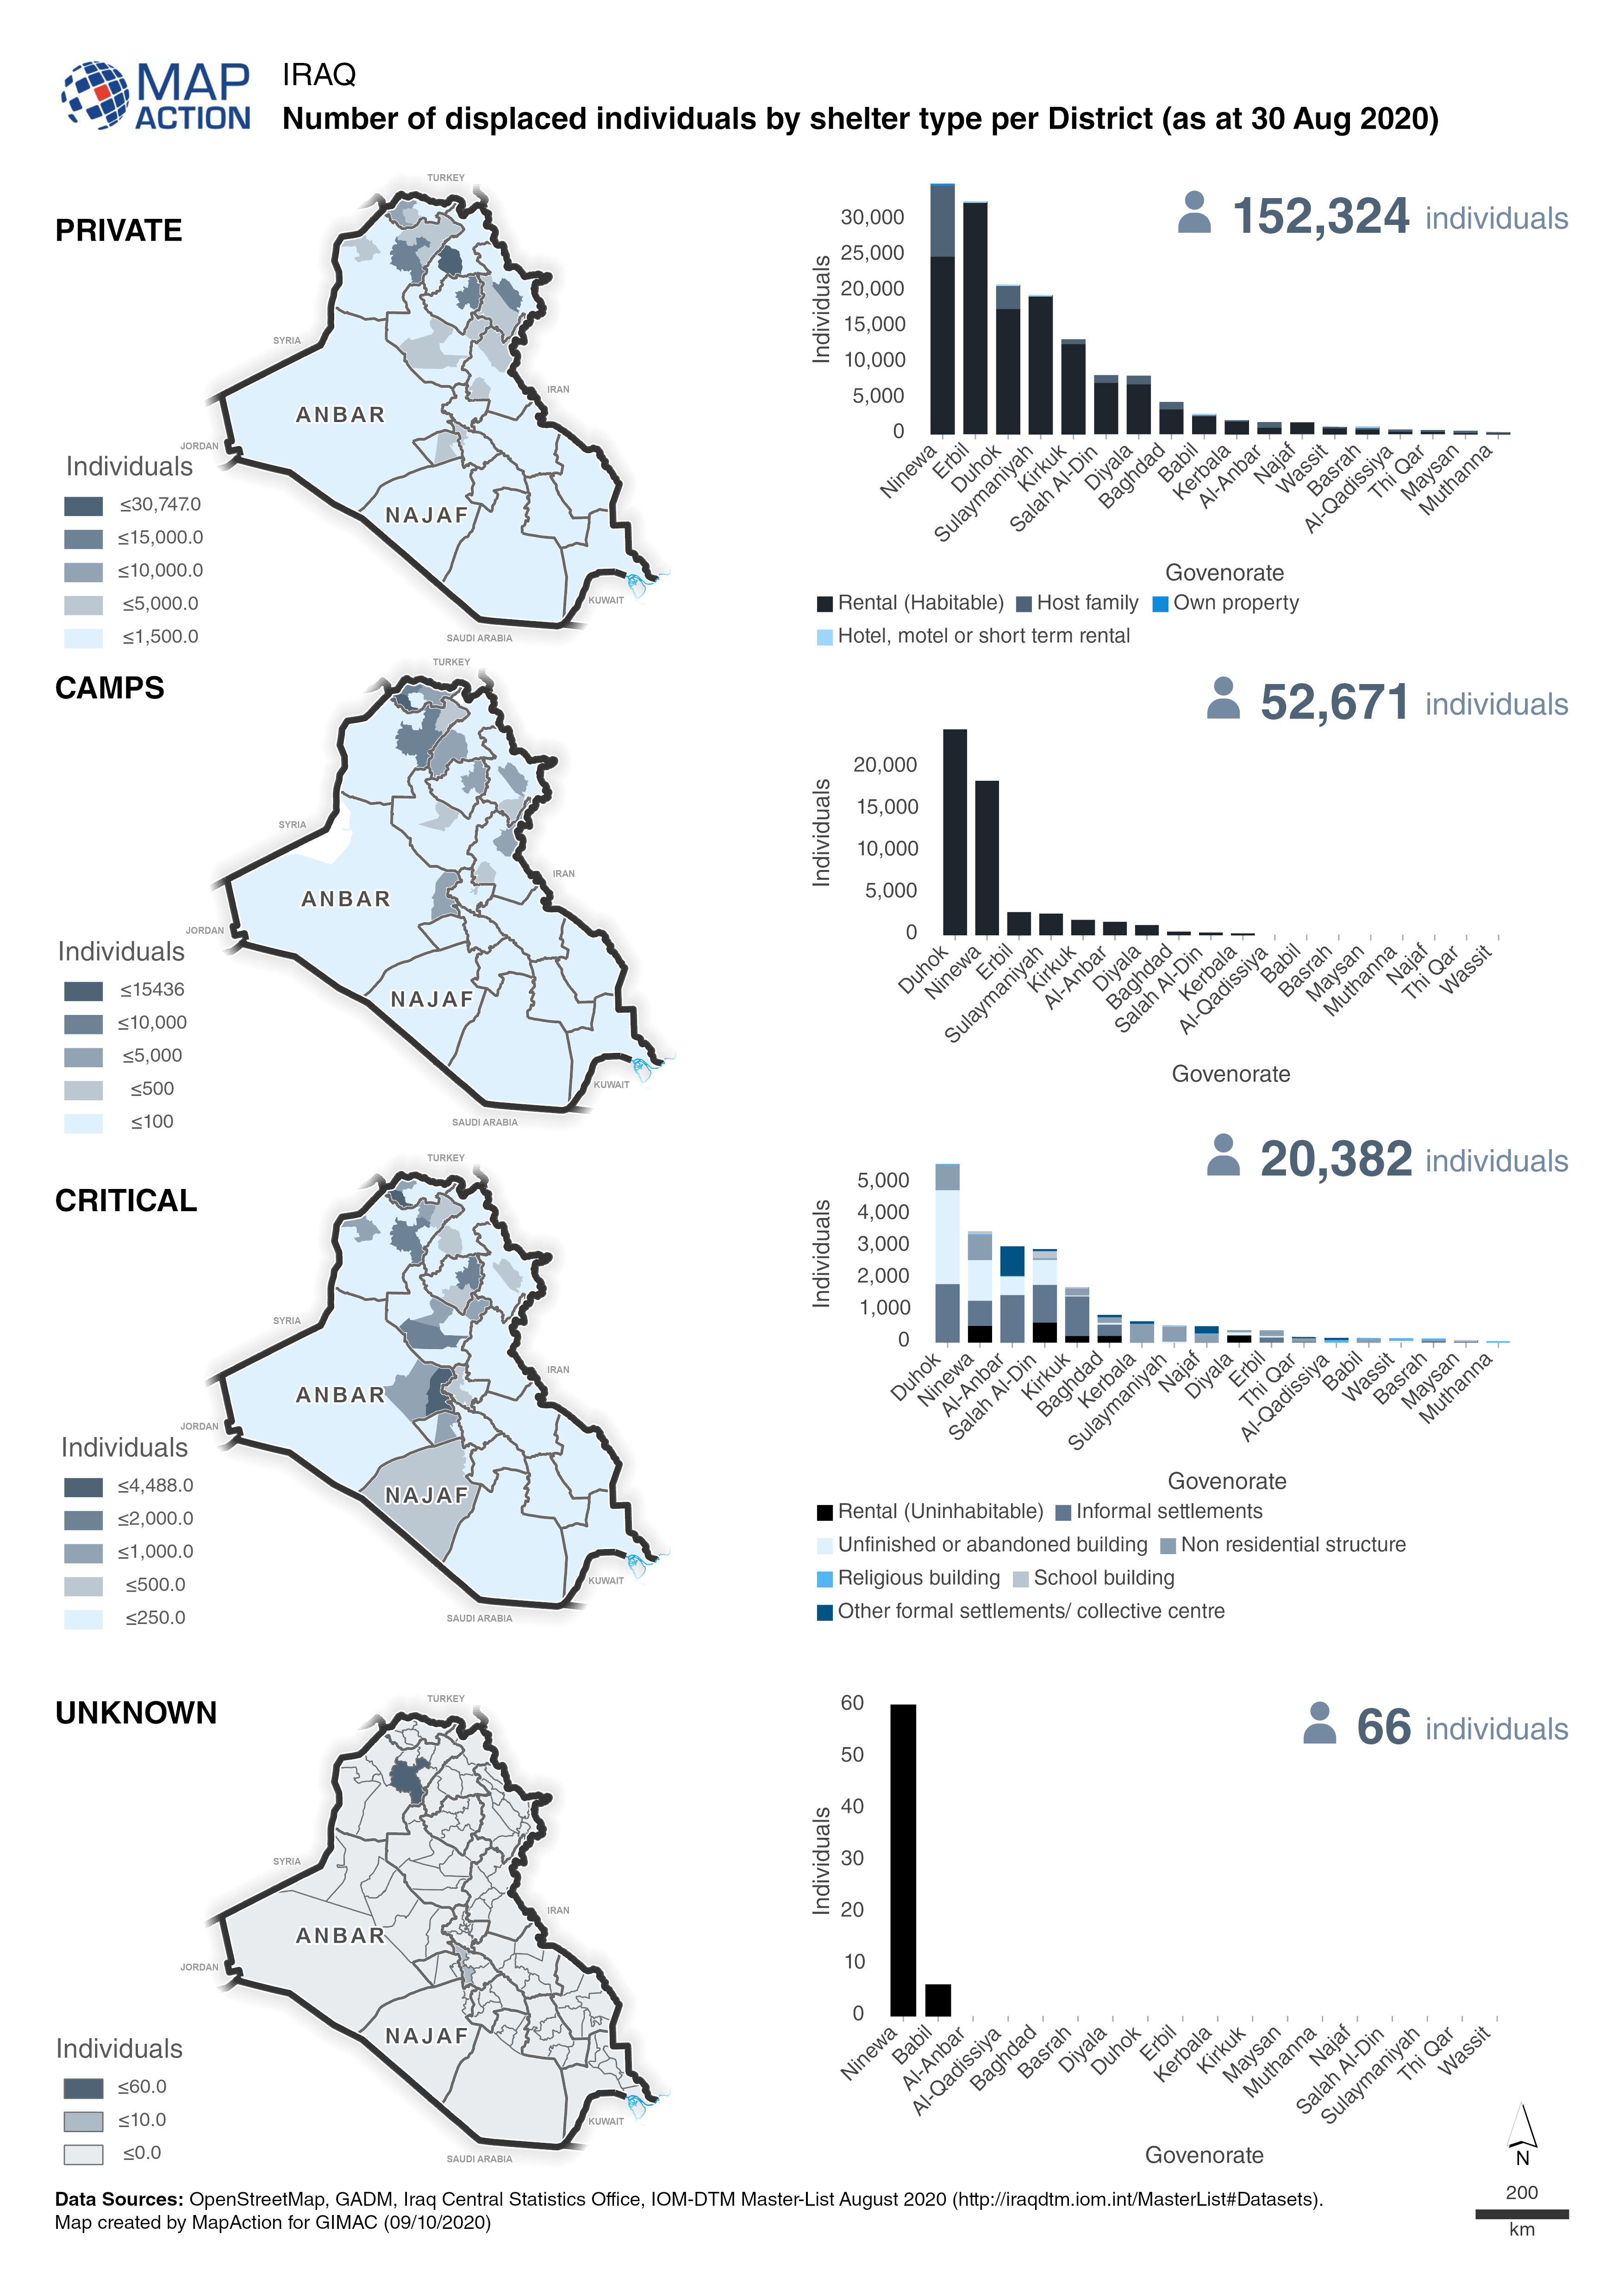
Iraq: Number of displaced individuals by shelter type per district (as at 30 ...
Maps and charts show a breakdown of the number displaced individuals in private accomodation, camps, critical shelters or unknown. -
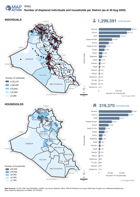
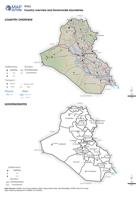
Iraq: Number of displaced individuals and households per district (as at 30 A...
Map shows the number of displaced individuals and households per district in Iraq. -

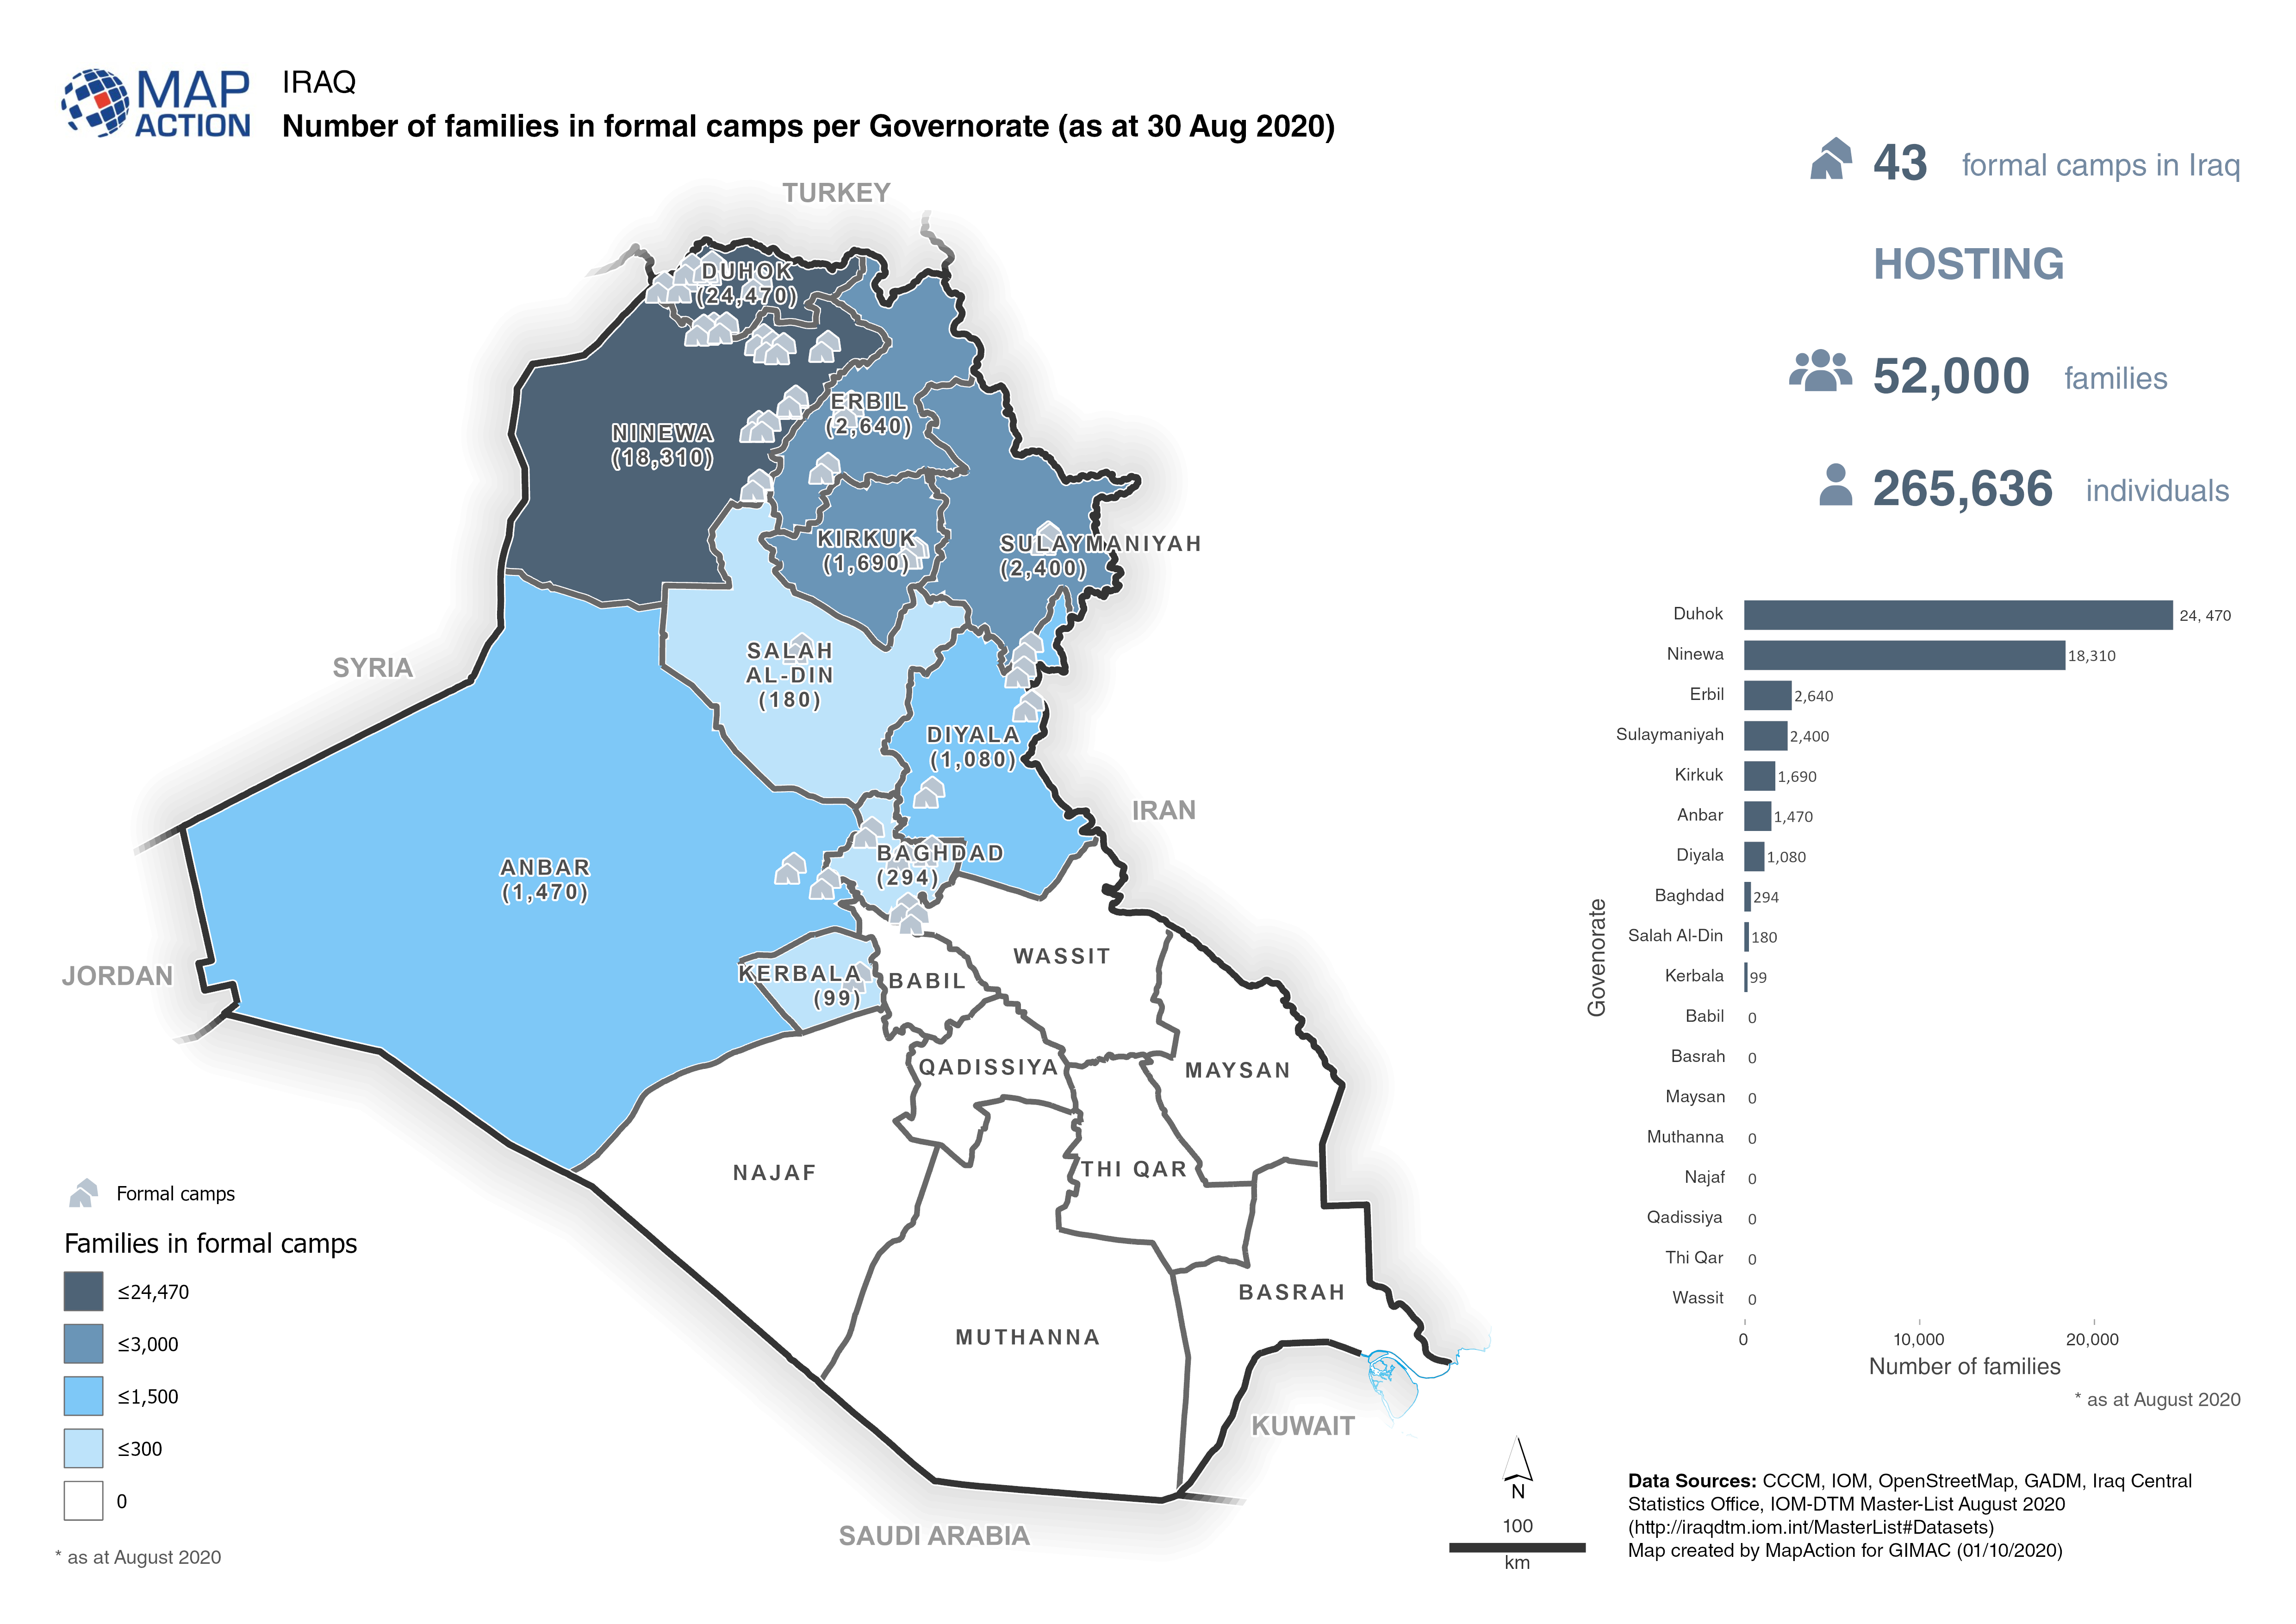
Iraq: Number of families in formal camps per Governorate (as at 30 Aug 2020)
Map shows the number of families and the locations of formal camps in Iraq. -
-

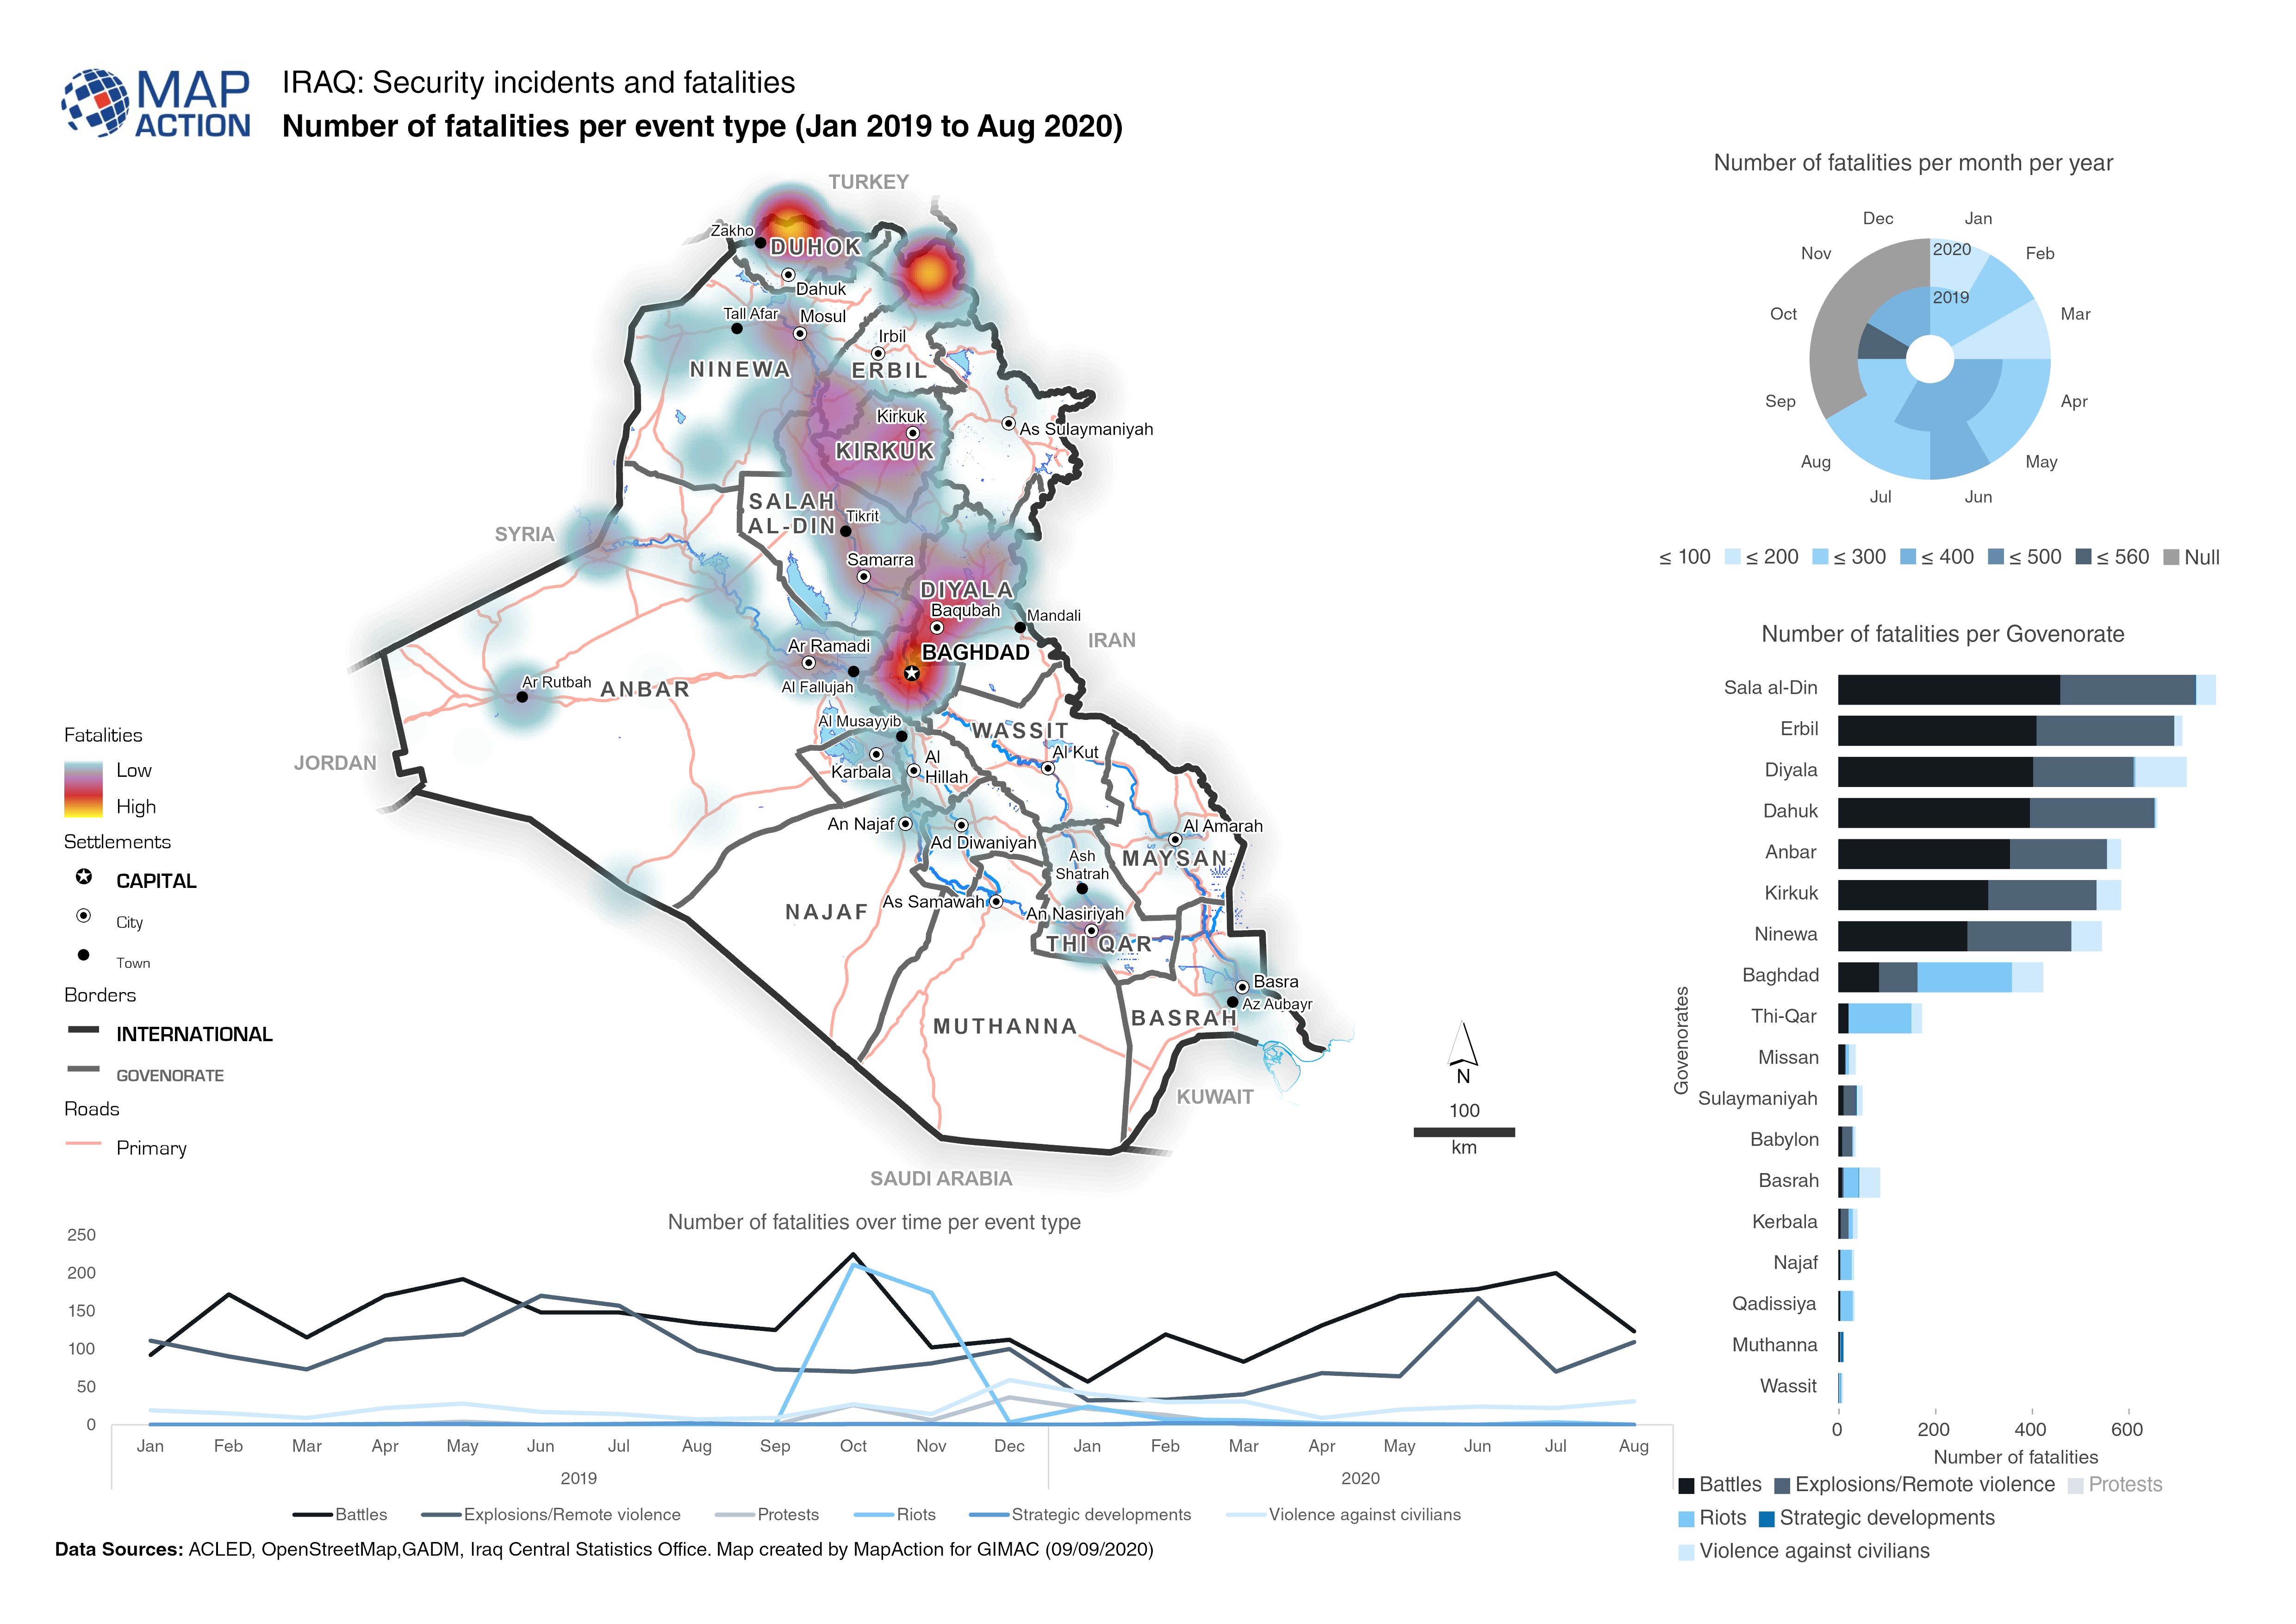
Iraq: Number of fatalities per event type (Jan 2019 to Aug 2020)
The map provides an overview of different security related incidents and fatalities. -

-
-
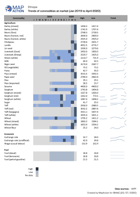
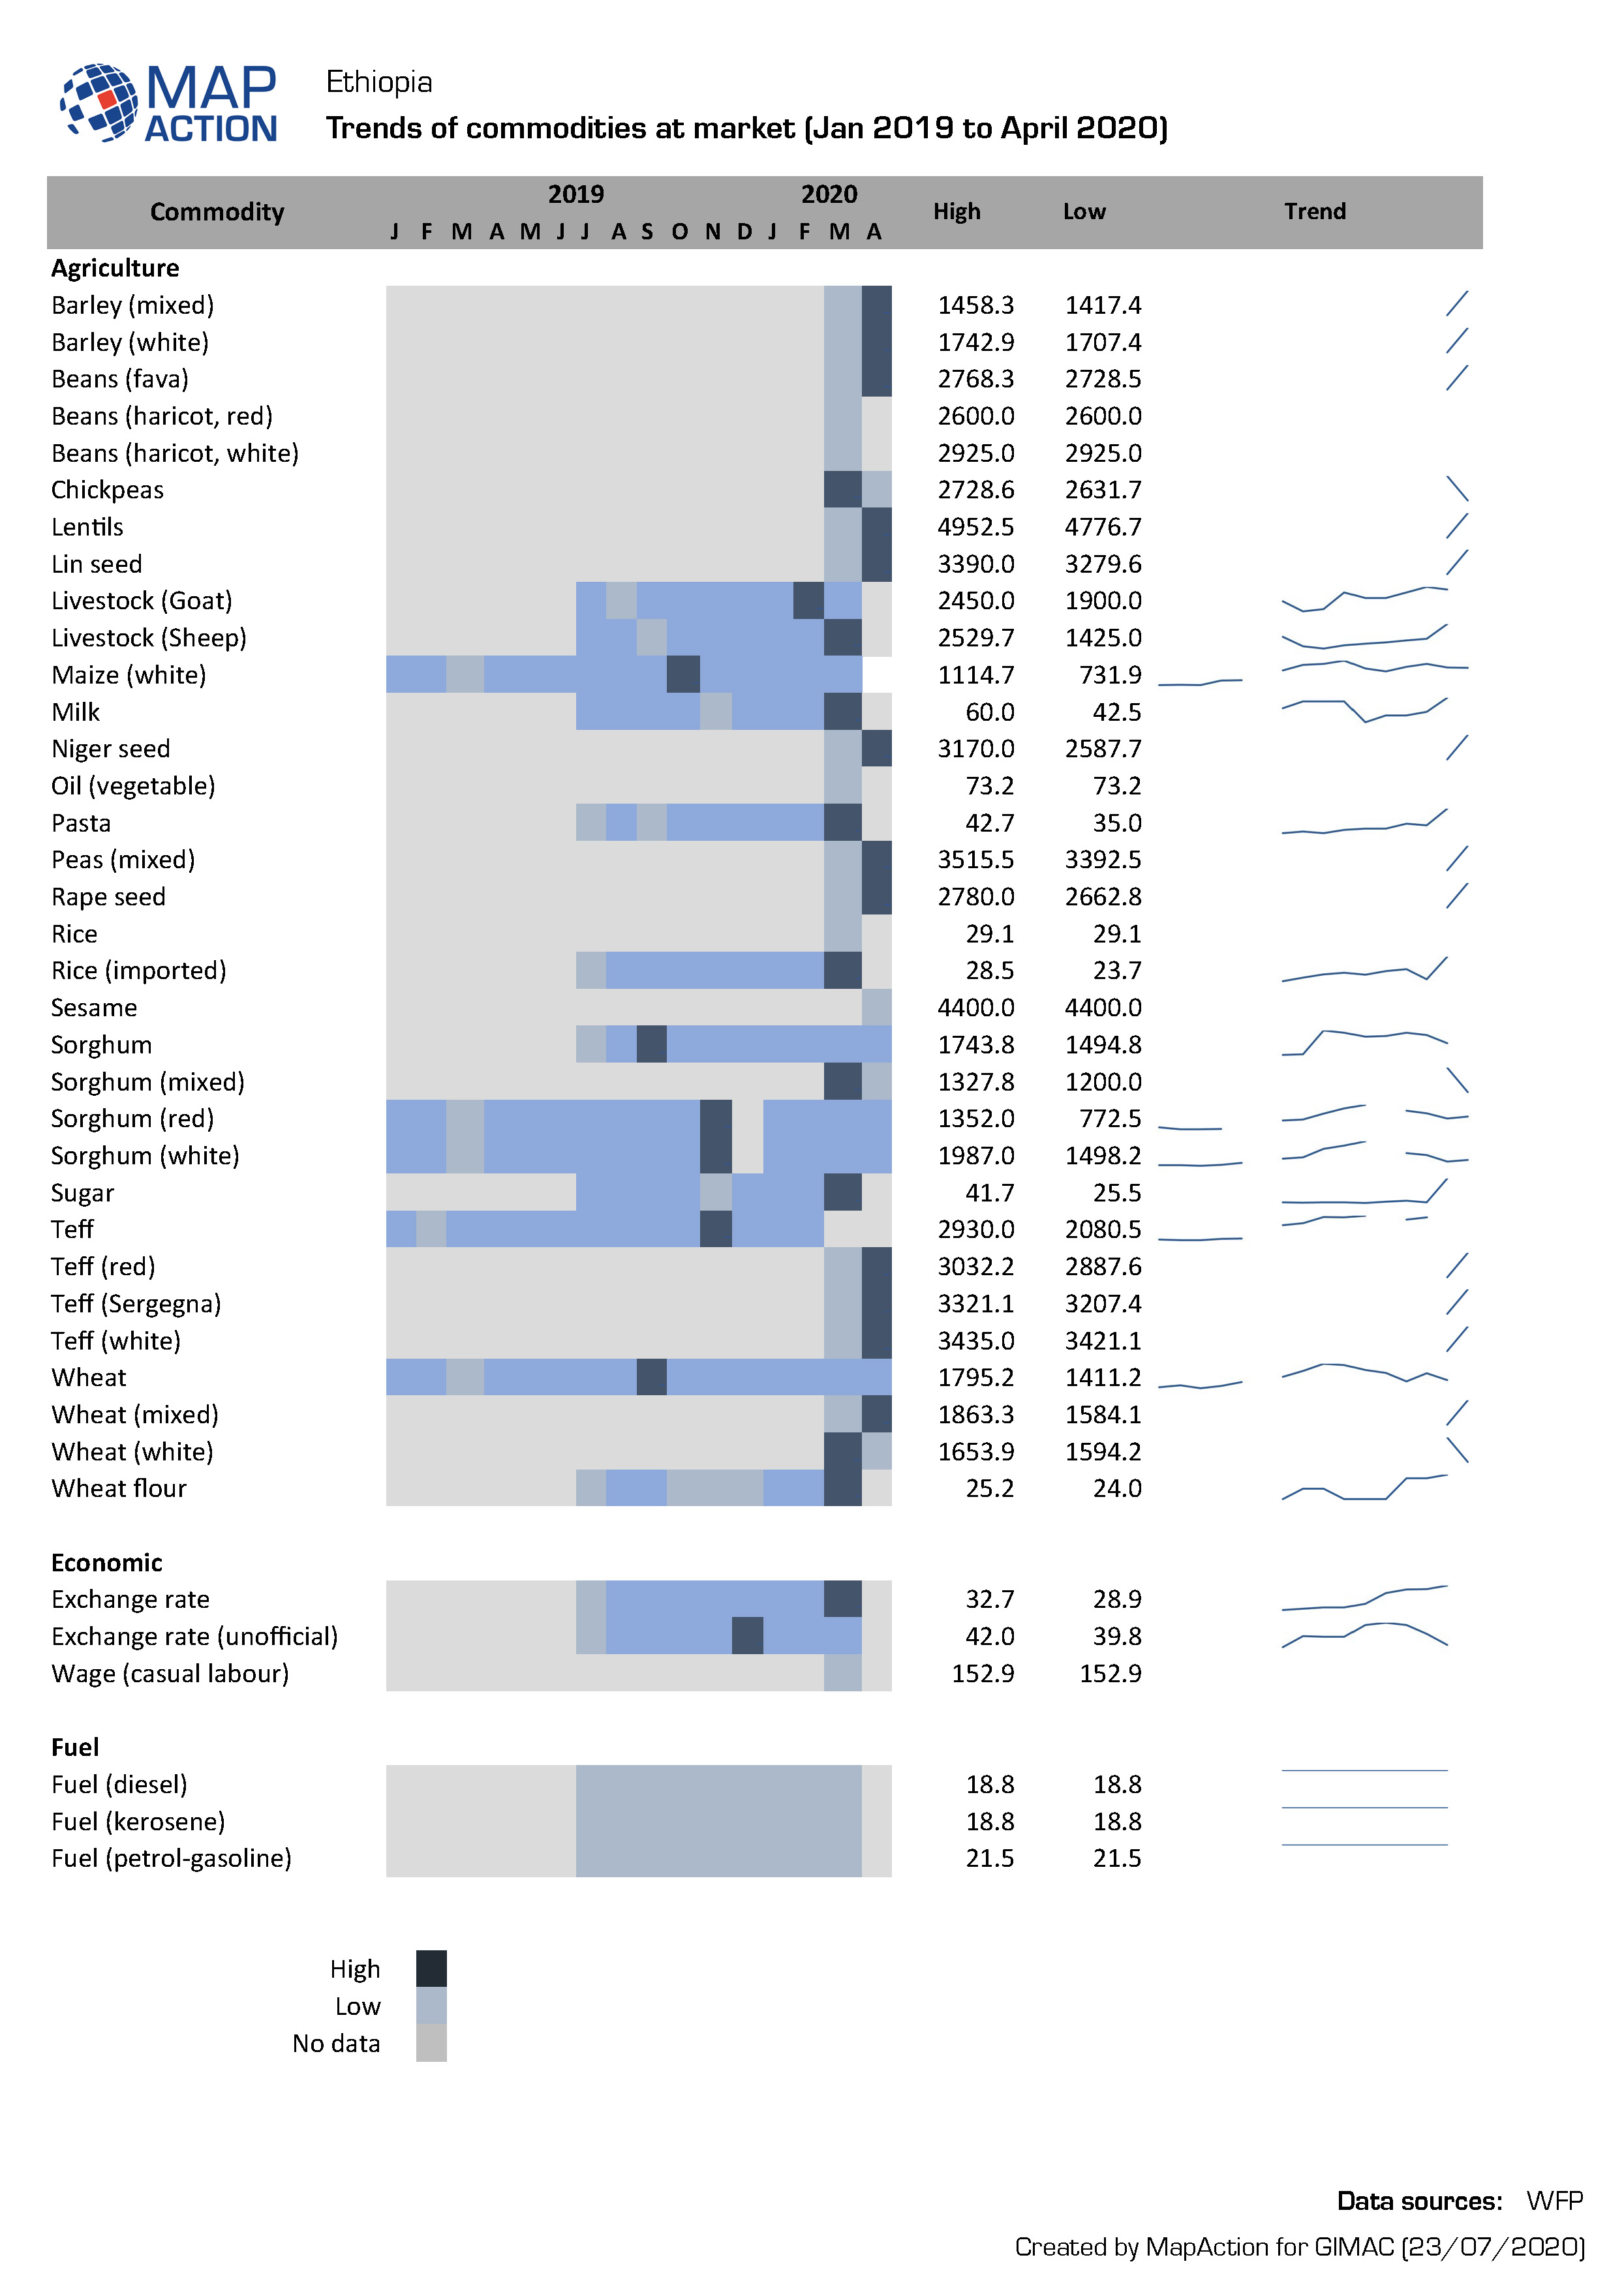
Ethiopia: Trends of commodities at market (Jan 2019 to April 2020)
Infographic shows the type and trends of commodities sold at market. -
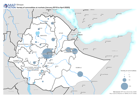
Ethiopia: Tracking change in numbers of IDPs (January 2018 to January 2020)
Maps show the number of displaced people and the change between years. -
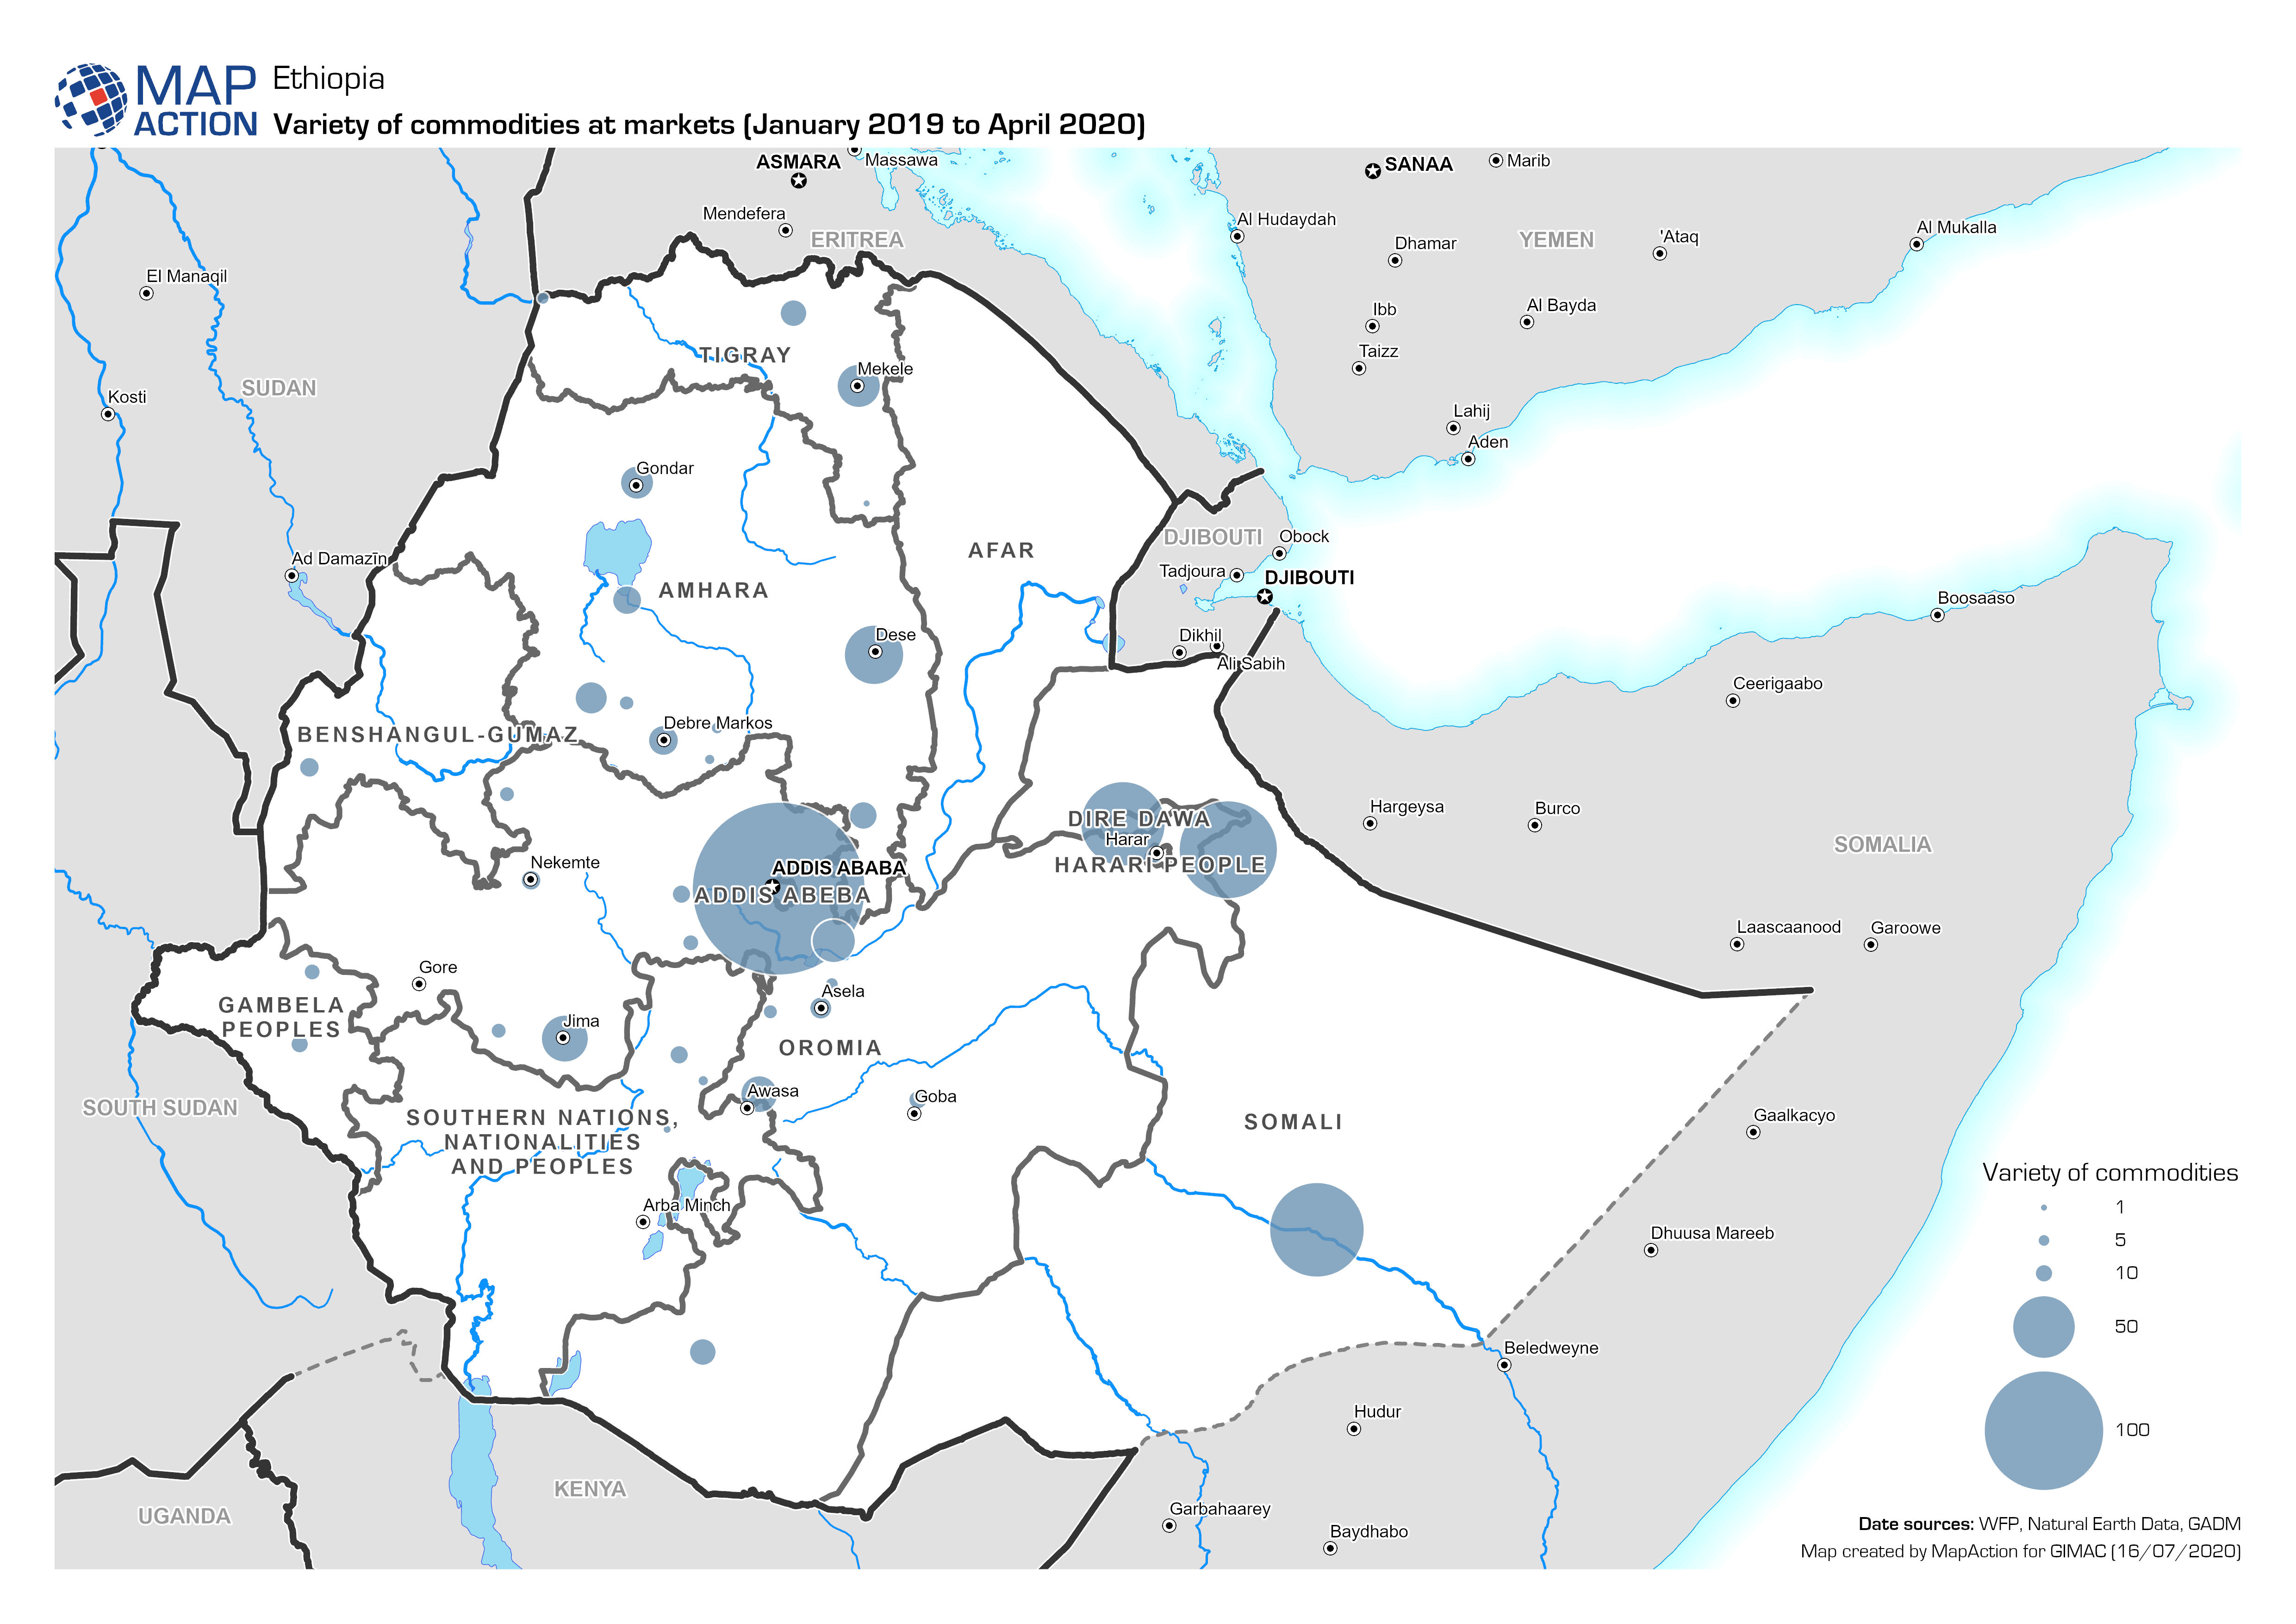
Ethiopia: Variety of commodities in markets (January 2019 to April 2020)
Map shows the variety in the number of commodities being sold in market places. -
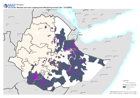
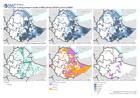
Ethiopia: Woreda and main cropping land affected by locuts (Jan - Jul 2020)
Map shows the location of the main cropping lands, the position of locusts and the woreda affected by locusts. -

Ethiopia: Number of fatalities per event (July 2019 to July 2020)
The map provides an overview of different security related incidents and fatalities. -

Sudan: Number of fatalities per event type (June 2018 to June 2021)
The map provides an overview of different security related incidents and fatalities.