-
Somalia: Number of fatalities per event type (June 2018 to June 2021)
The map provides an overview of different security related incidents and fatalities. -

-

Somalia: Status of schools between 16 Februray 2020 and 30 June 2021
Infographic shows when schools have been open and closed and for how many days in total. -

Niger: Number of fatalities per event type (June 2018 to June 2021)
The map provides an overview of different security related incidents and fatalities. -

-
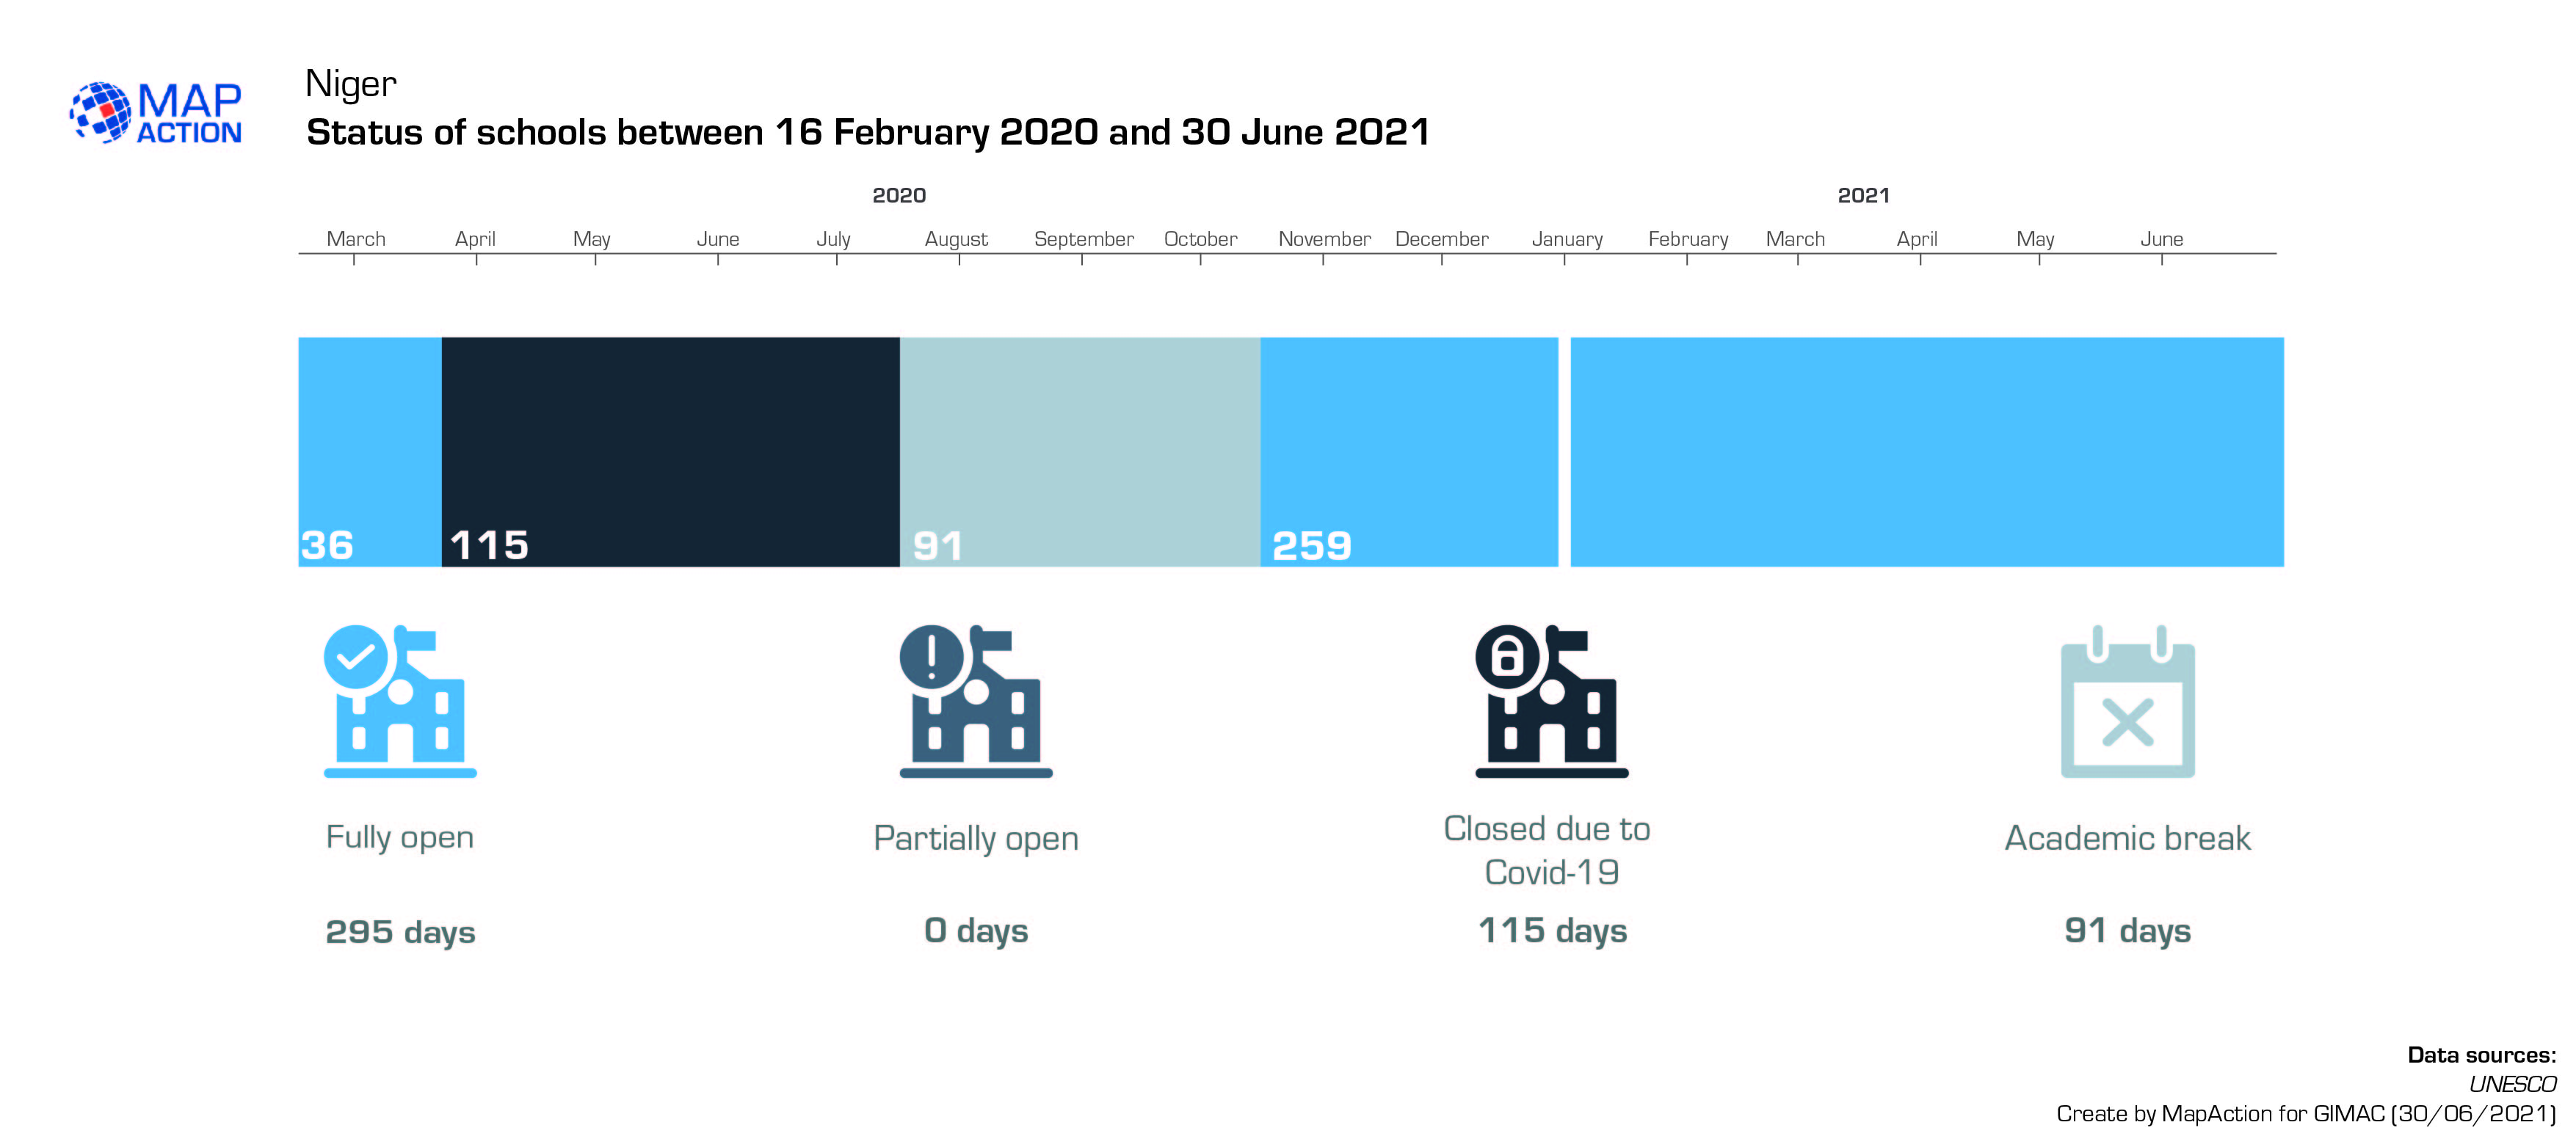
Niger: Status of schools between 16 Februray 2020 and 30 June 2021
Infographic shows when schools have been open and closed and for how many days in total. -

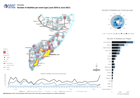
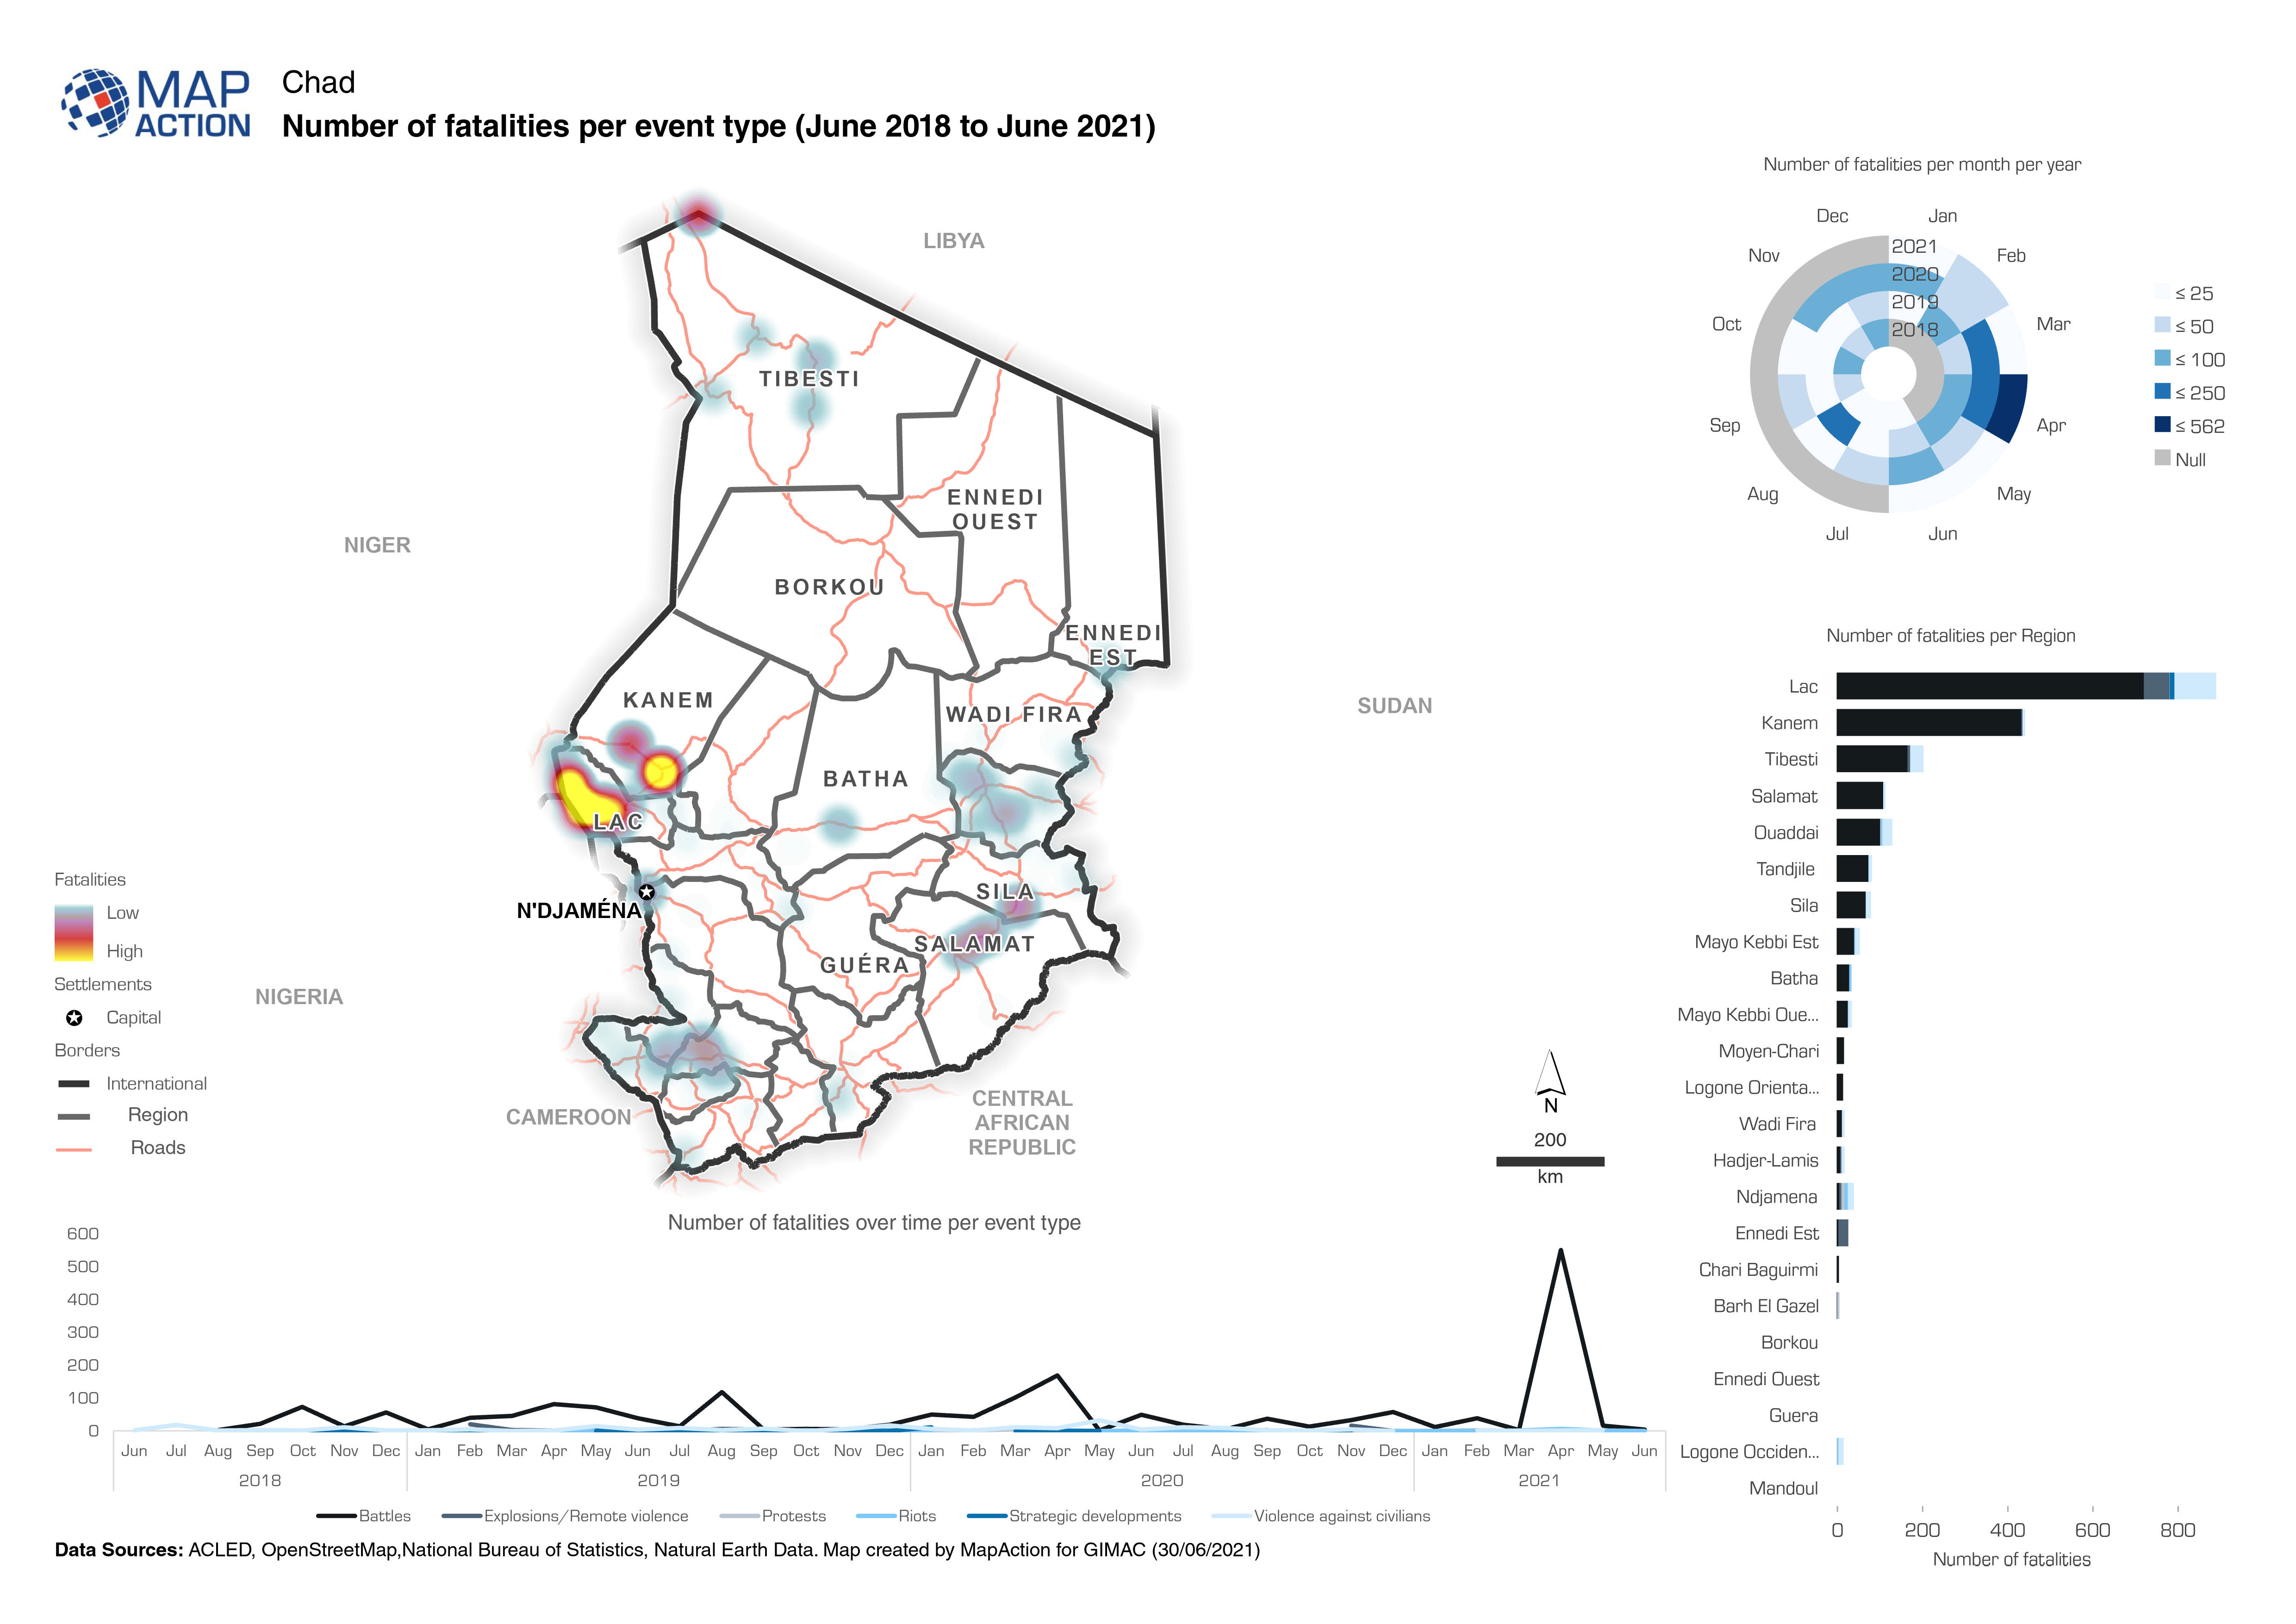
Chad: Number of fatalities per event type (June 2018 to June 2021)
The map provides an overview of different security related incidents and fatalities. -
-
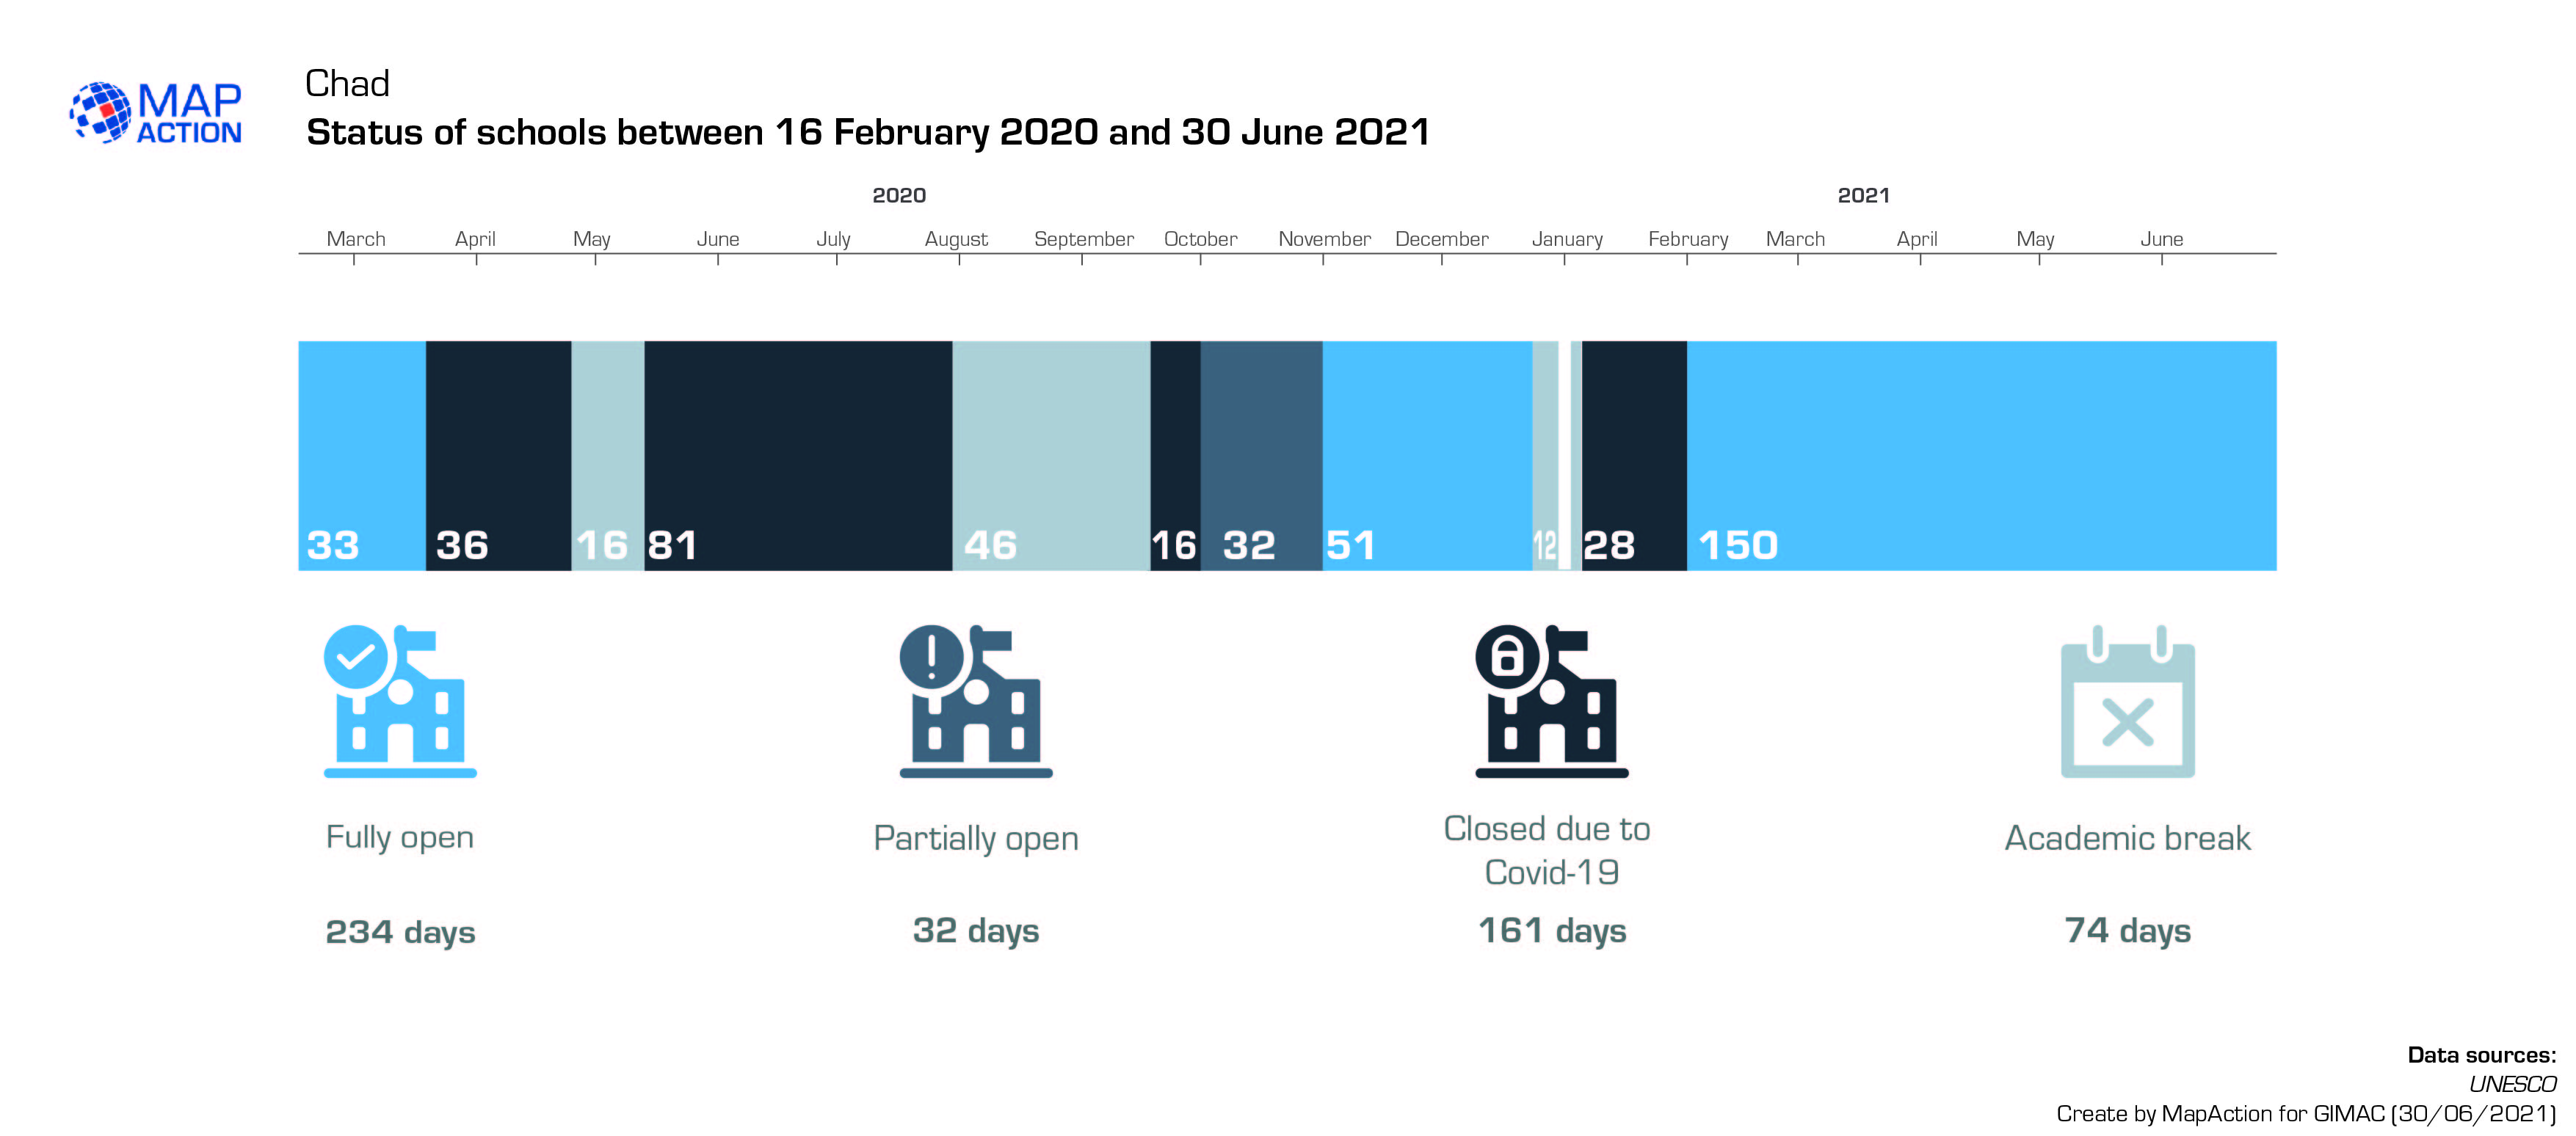
Chad: Status of schools between 16 Februray 2020 and 30 June 2021
Infographic shows when schools have been open and closed and for how many days in total. -

Chad: Food insecurity(June to August 2021)
Map and charts show the projected IPC phases per region. -

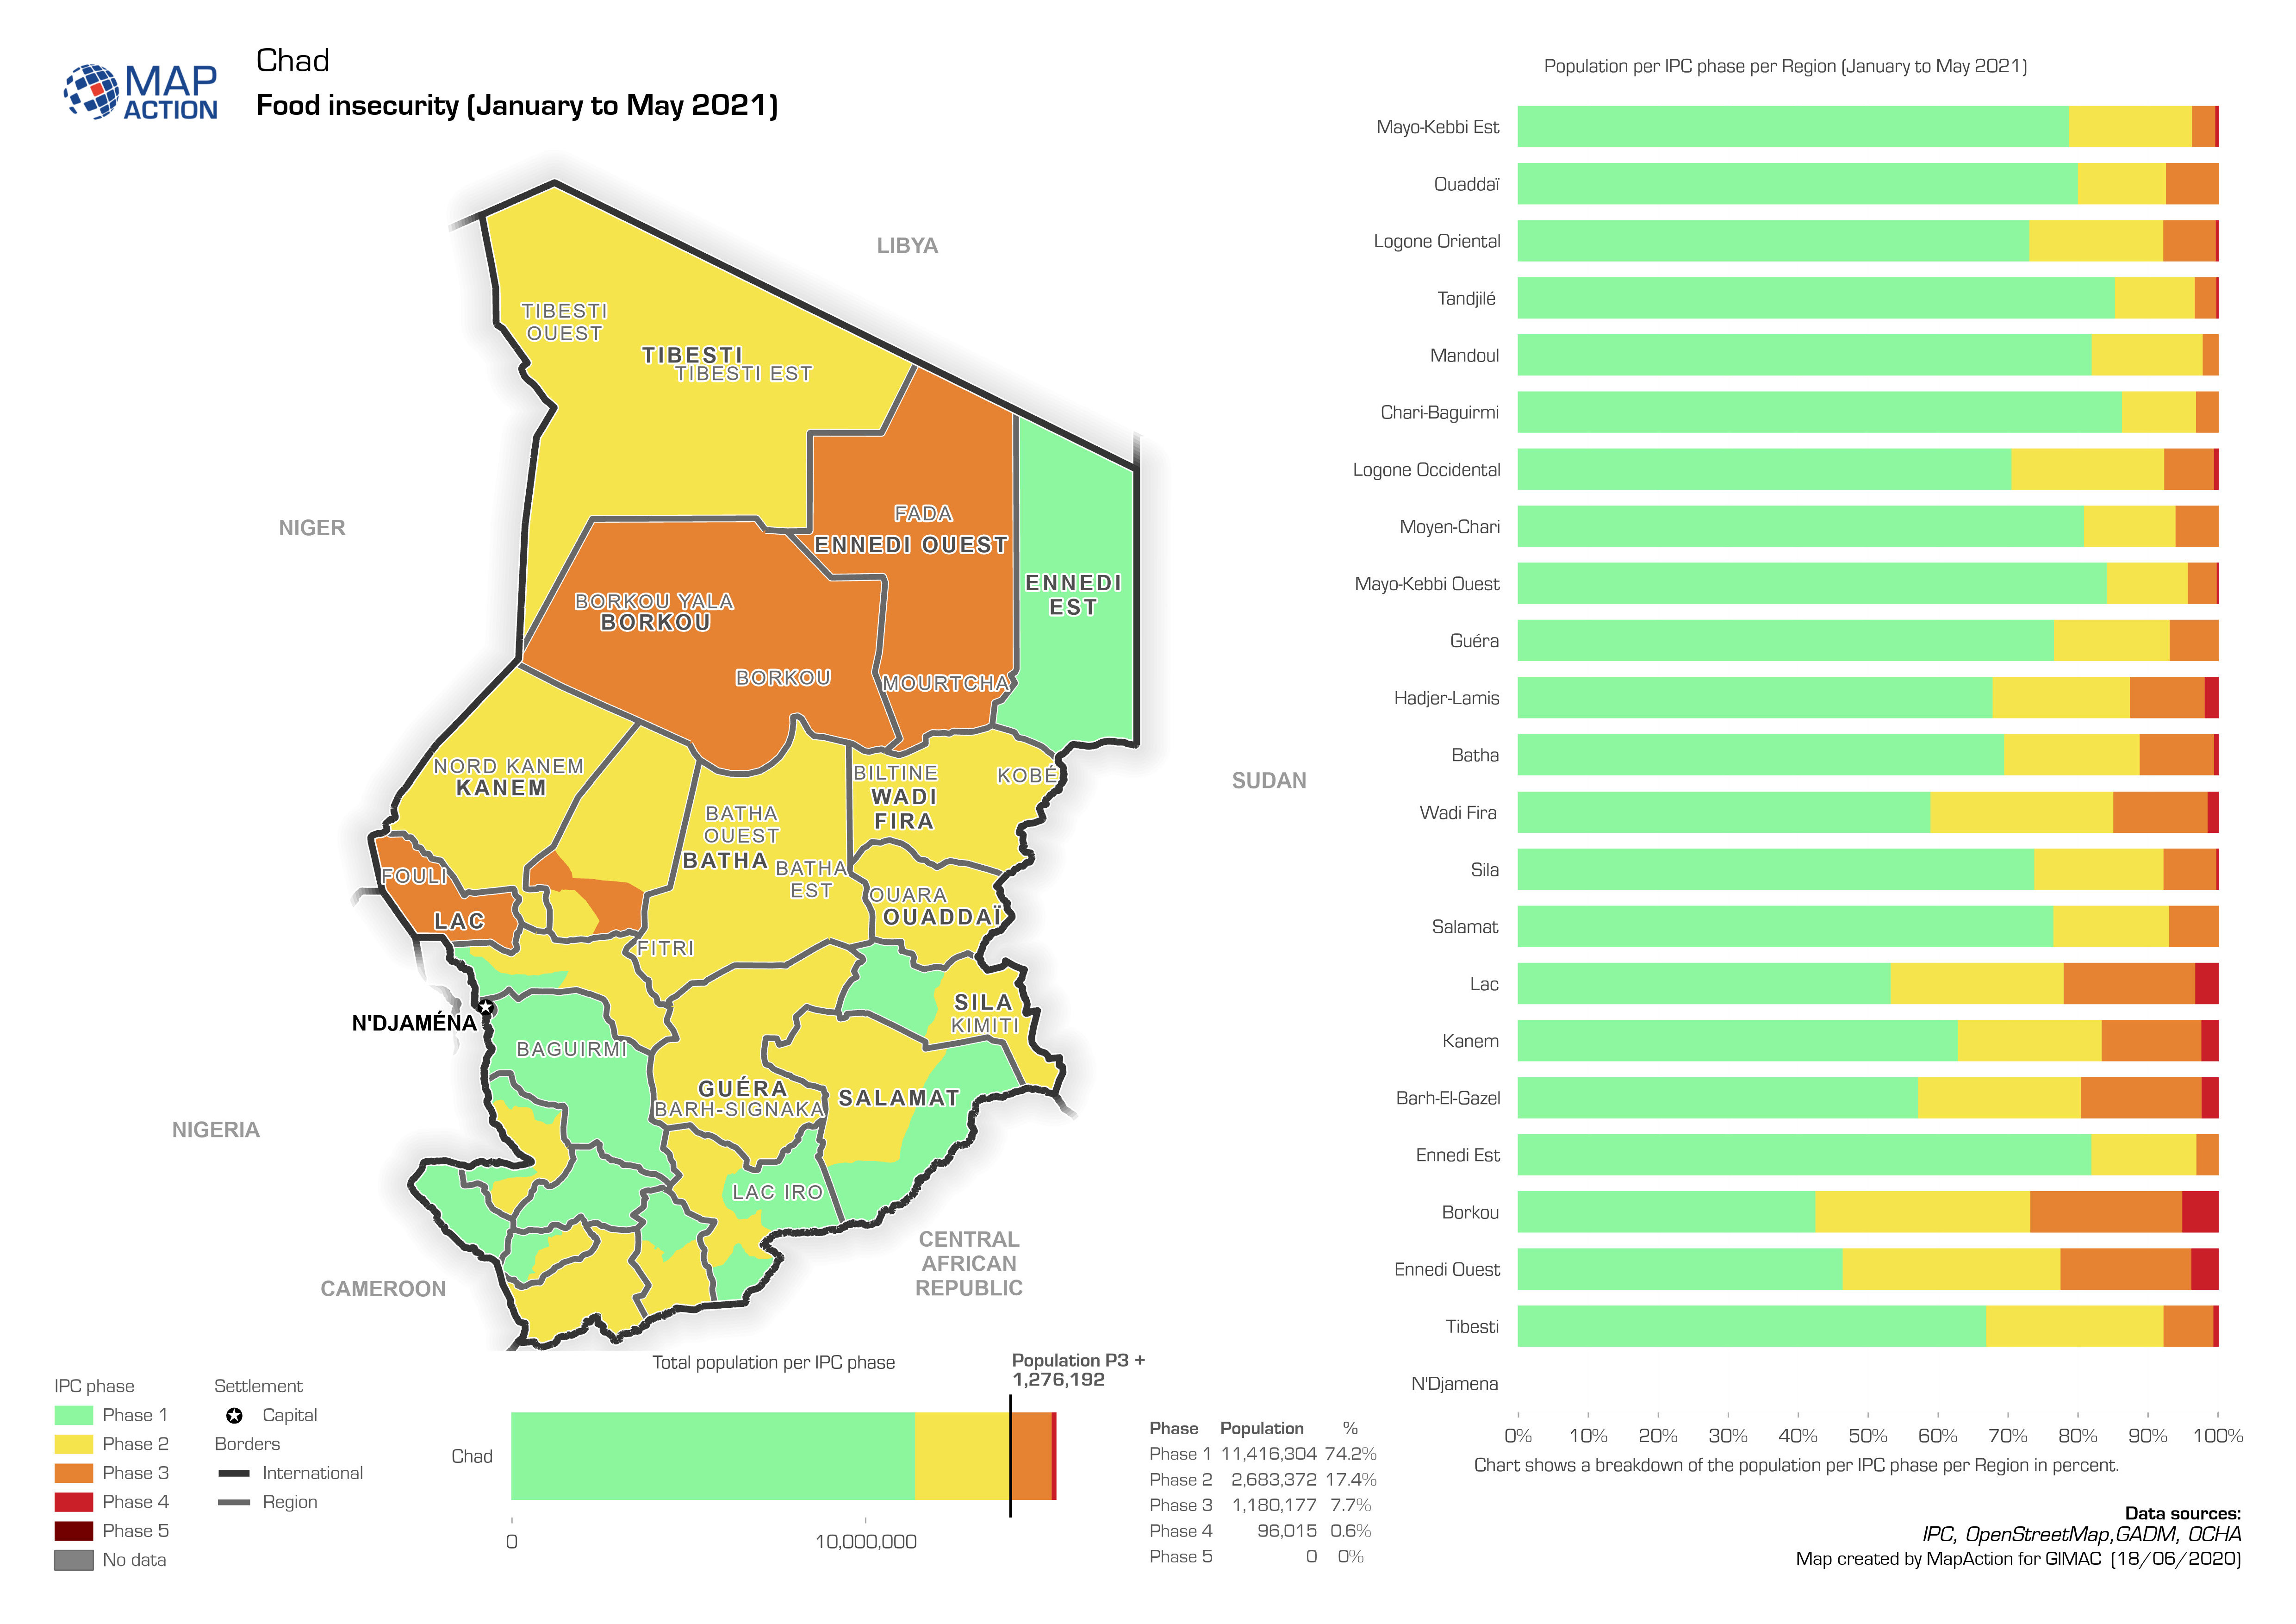
Chad: Food insecuirty (January to May 2021)
Map and charts shows the IPC phases per region. -
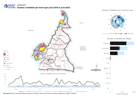
Cameroon: Number of fatalities per event type (June 2018 to June 2021)
The map provides an overview of different security related incidents and fatalities. -

-
Cameroon: Status of schools between 16 Februray 2020 and 30 June 2021
Infographic shows when schools have been open and closed and for how many days in total. -
-
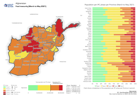
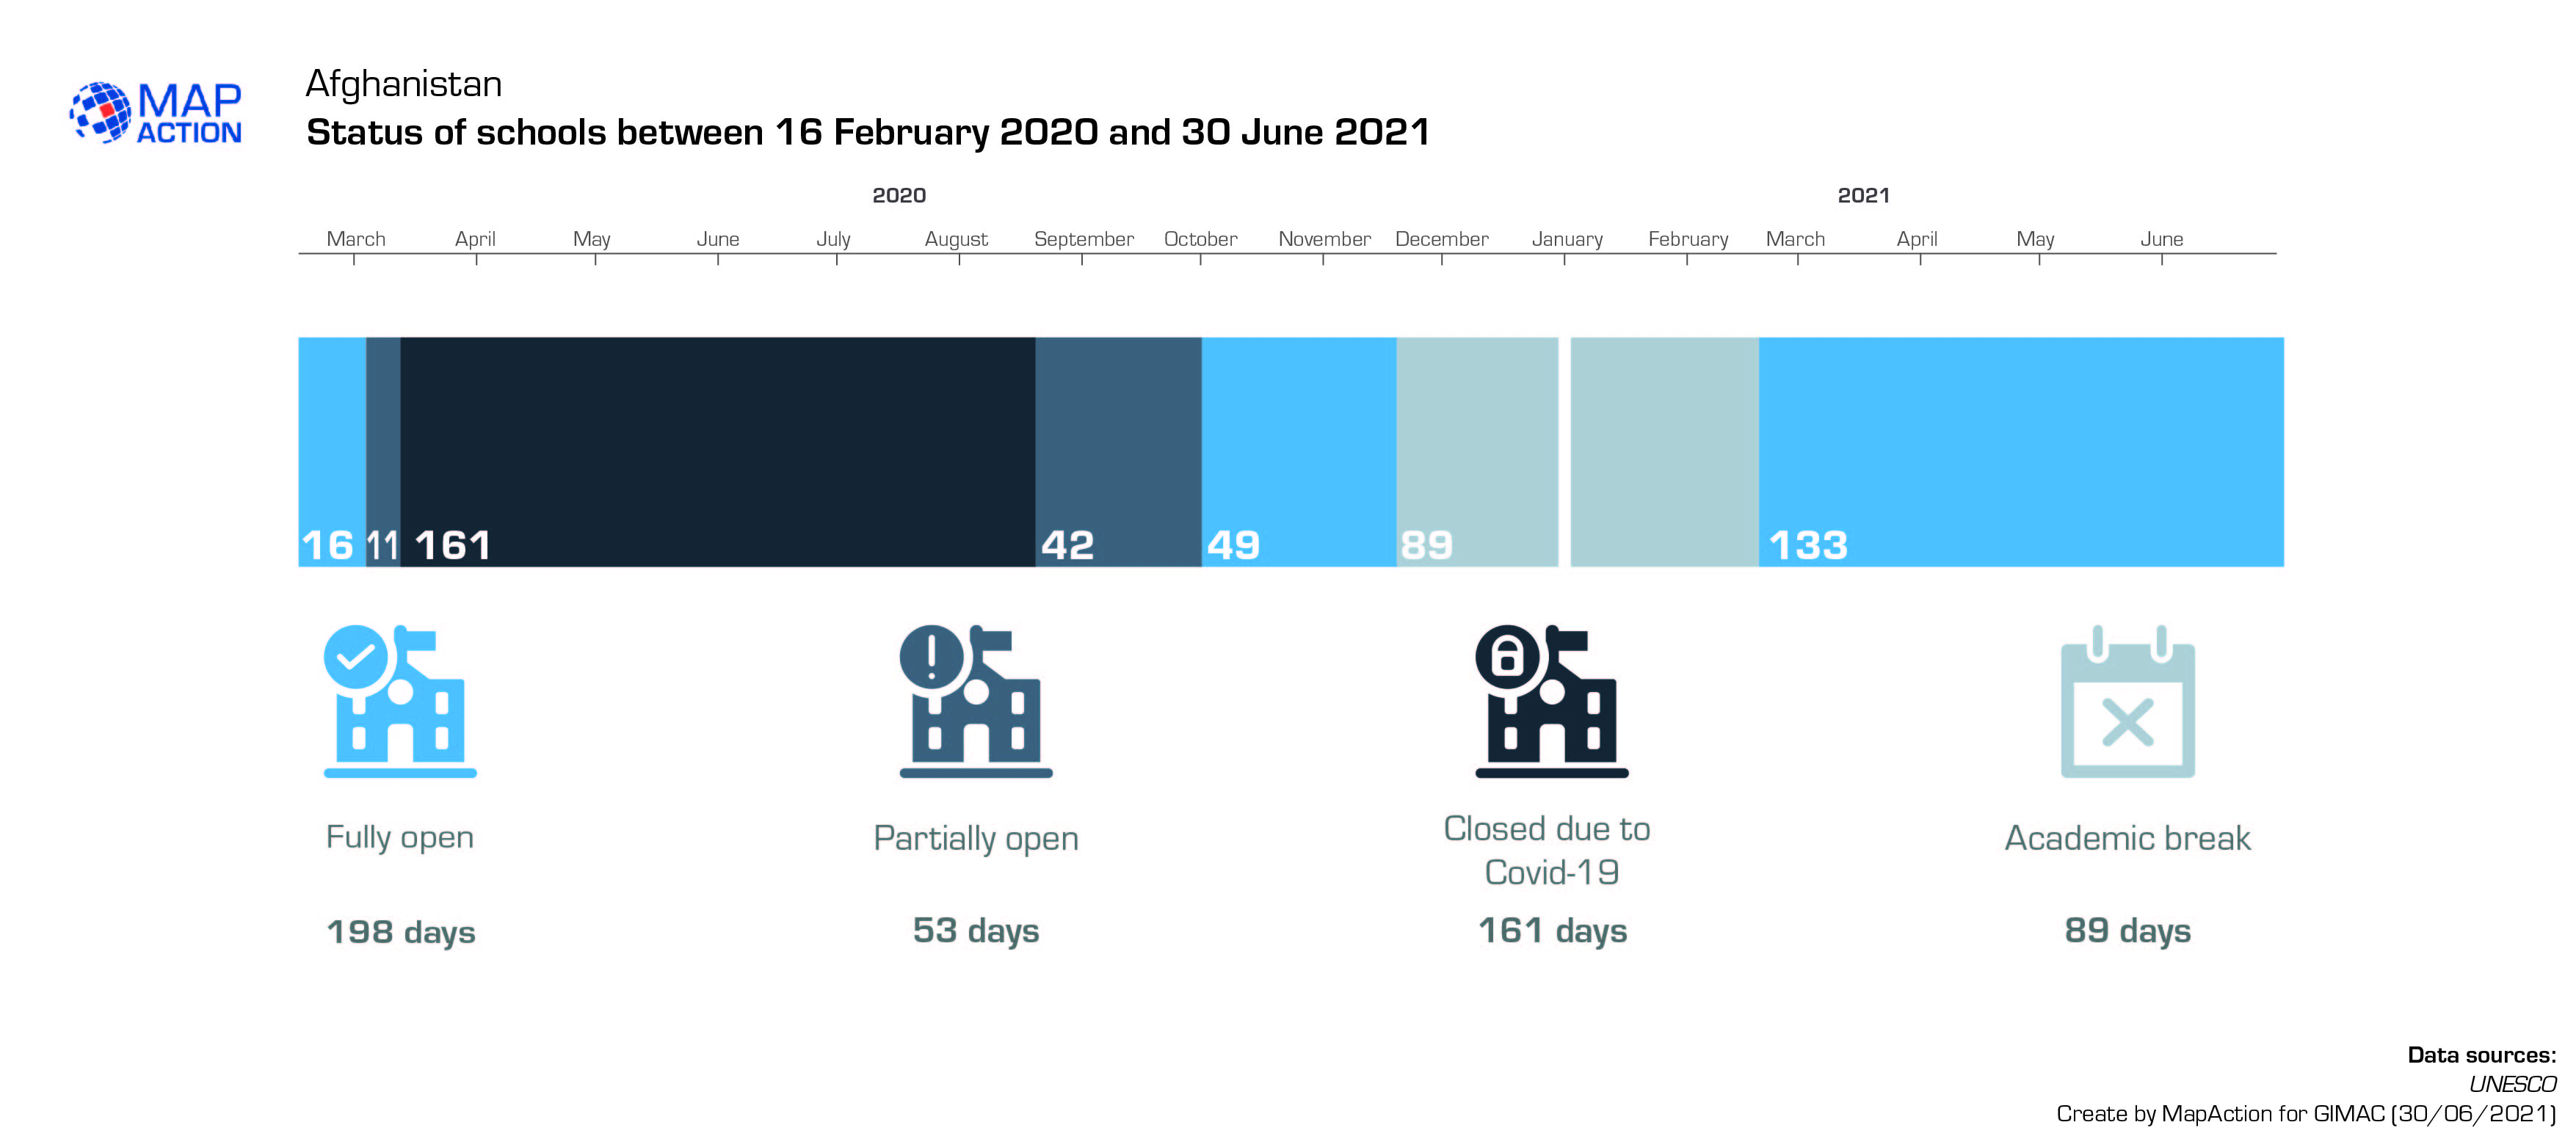
Afghanistan: Status of schools between 16 Februray 2020 and 30 June 2021
Infographic shows when schools have been open and closed and for how many days in total. -
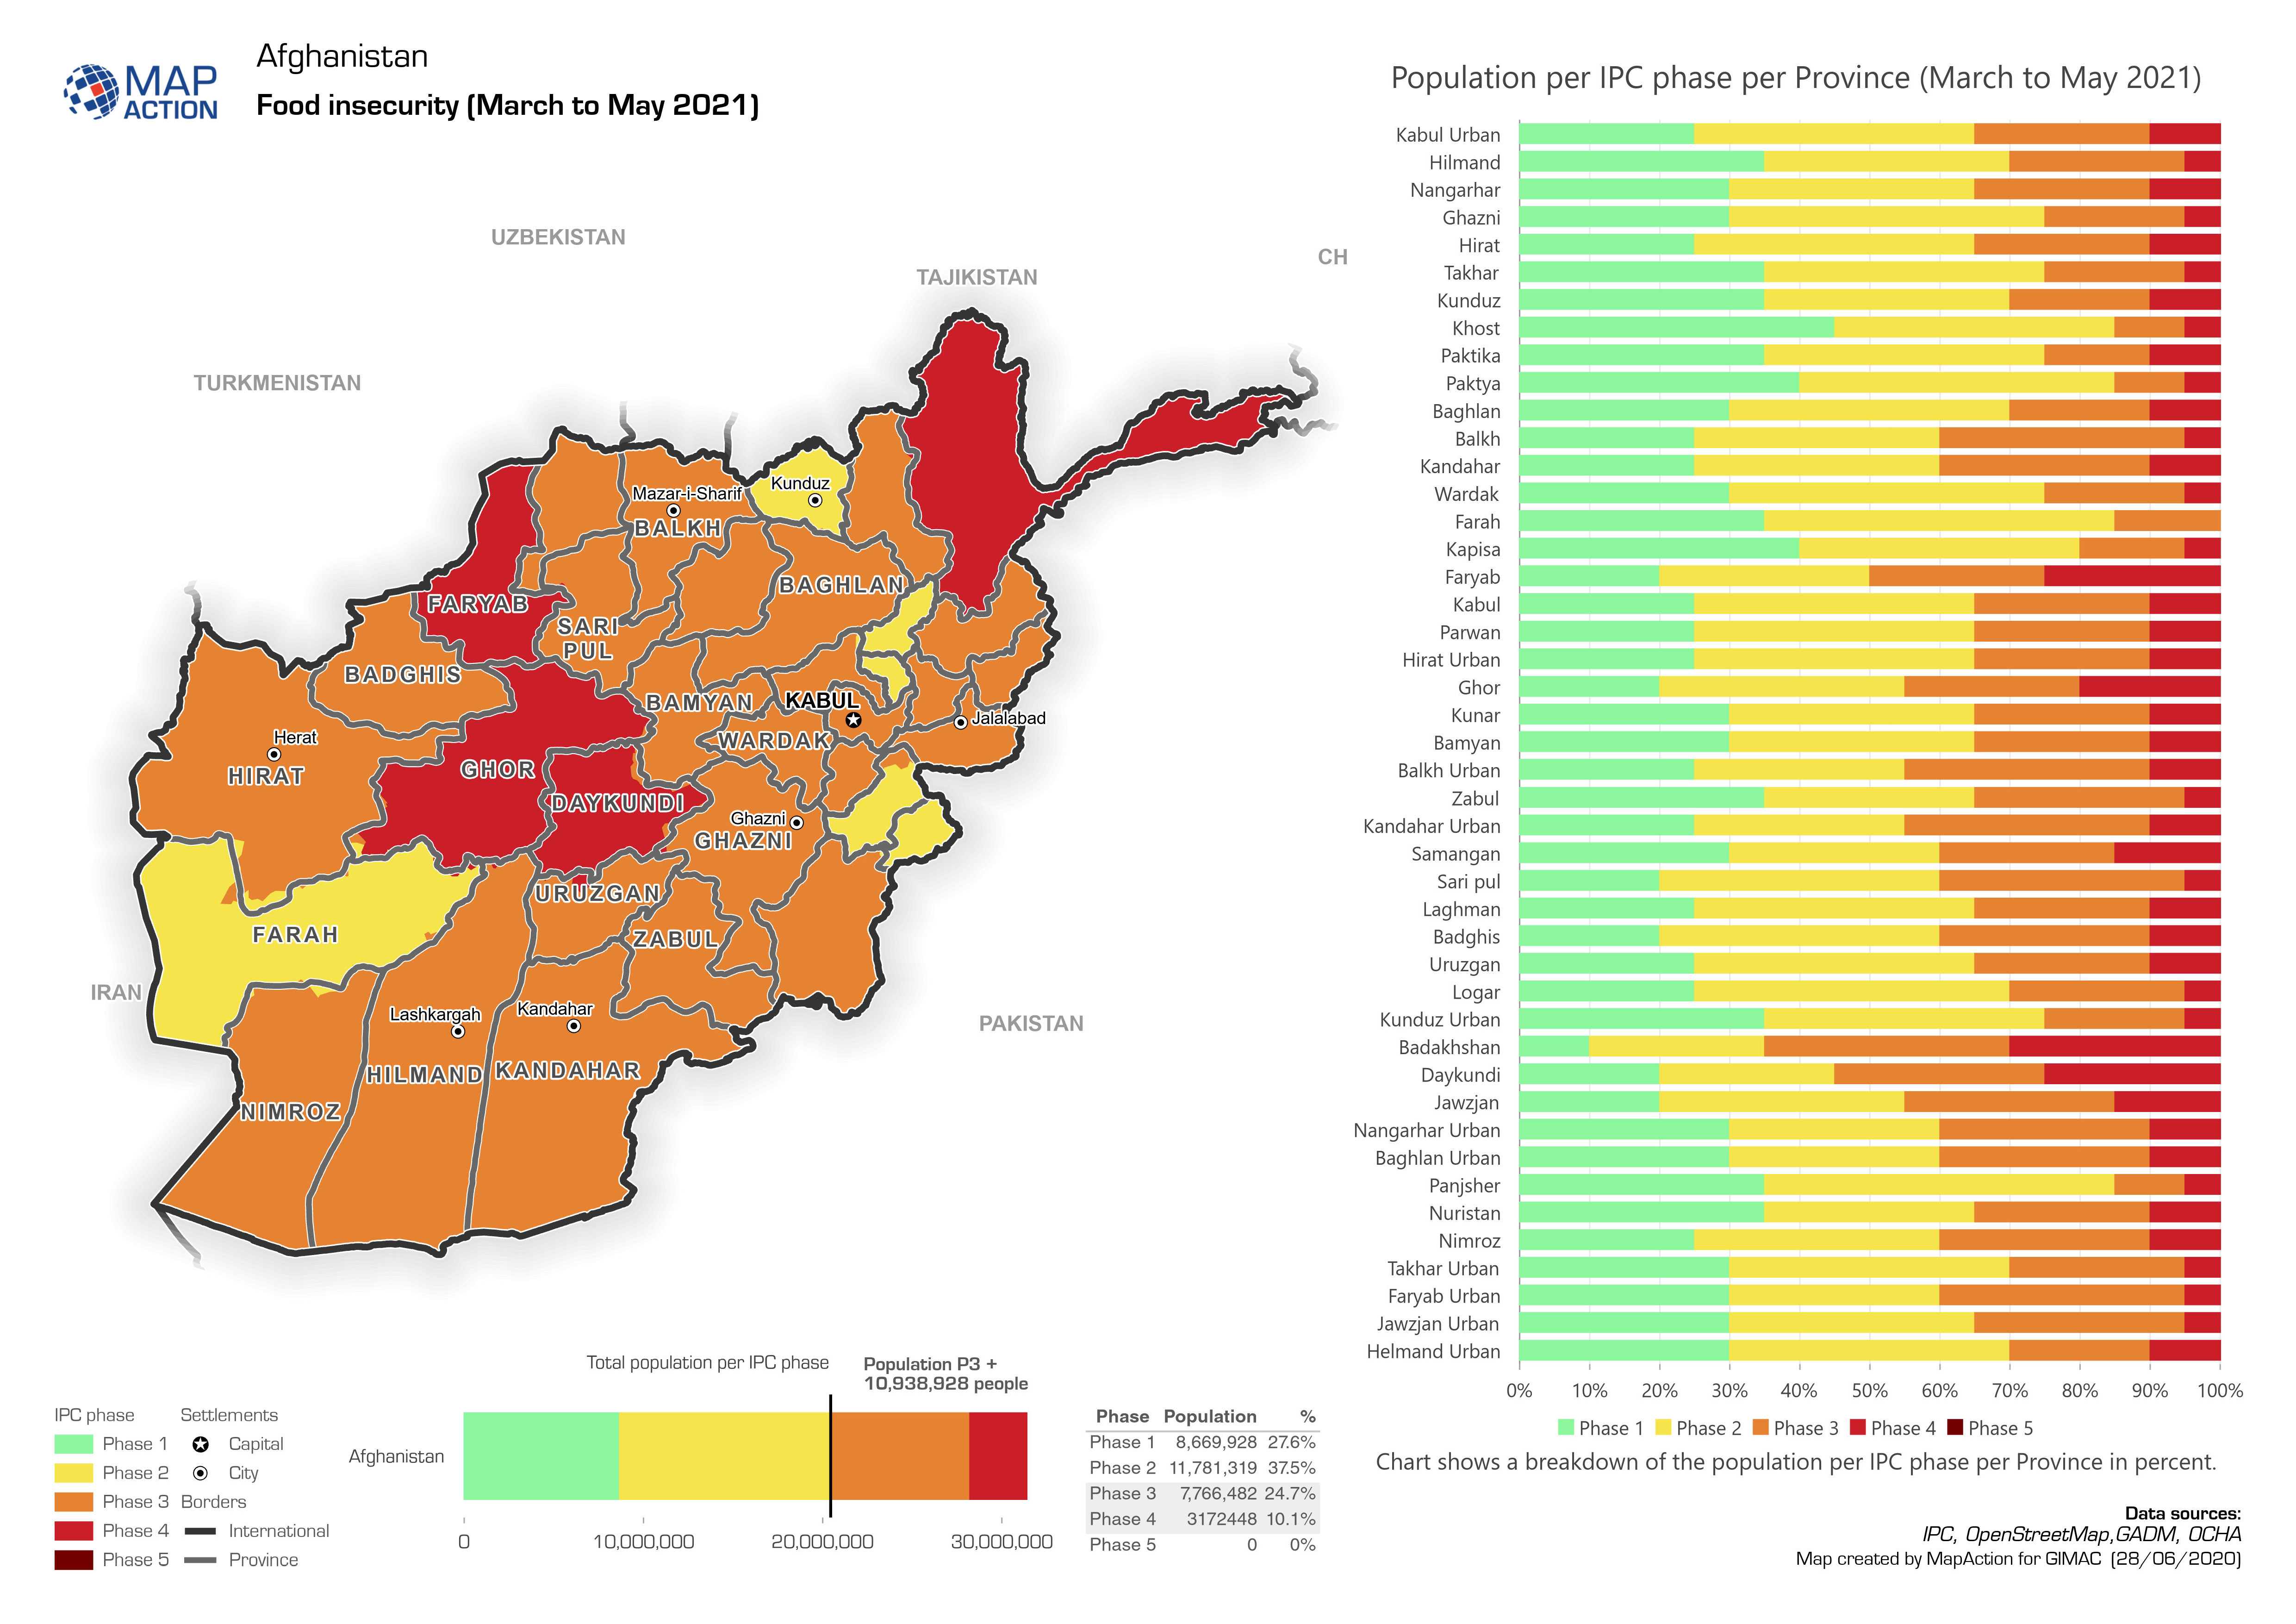
Afghanistan: Food insecurity (March to May 2021)
Map and charts shows the IPC phases per province. -

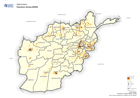
Afghanistan: Number of fatalities per event type (June 2018 to June 2021)
The map provides an overview of different security related incidents and fatalities. -

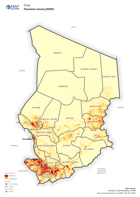
Baseline Population Demographics of Most Affected Communes
Baseline population data (Worldpop 2020) presented in gender specific age demographic charts (in order of total population) for seven of the most affected communes based on... -
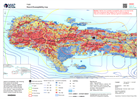
Hazard Susceptibility map
Hazard susceptibility map, showing flood zones and landslide susceptibility mapping, together with earthquake shake intensity information and rainfall isohyets from the last 7...