-

Presencia humanitaria: quién hace qué, dónde en cada municipio, departmento: ...
Mapbook shows the number of reported activities per Sector, and who is delivering them, per Municipality in Honduras. Critical and High priority response areas are also shown,... -
Presencia humanitaria: quién hace qué, dónde en cada municipio, departmento: ...
Mapbook shows who is delivering Sector activities, per Municipality in Honduras. Population density, number of shelters and occupants per Municipality -

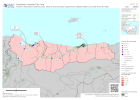
Honduras: Presencia humanitaria: quién hace qué, dónde en cada municipio, dep...
Mapbook shows who is delivering Sector activities, per Municipality in Honduras. Critical and High priority response areas with population density, number of shelters and... -
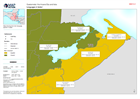
Honduras: Presencia humanitaria: quién hace qué, dónde en cada municipio, dep...
Mapbook shows the number of reported activities per Sector, and who is delivering them, per Municipality in Honduras. Critical and High priority response areas and satellite... -
-

-

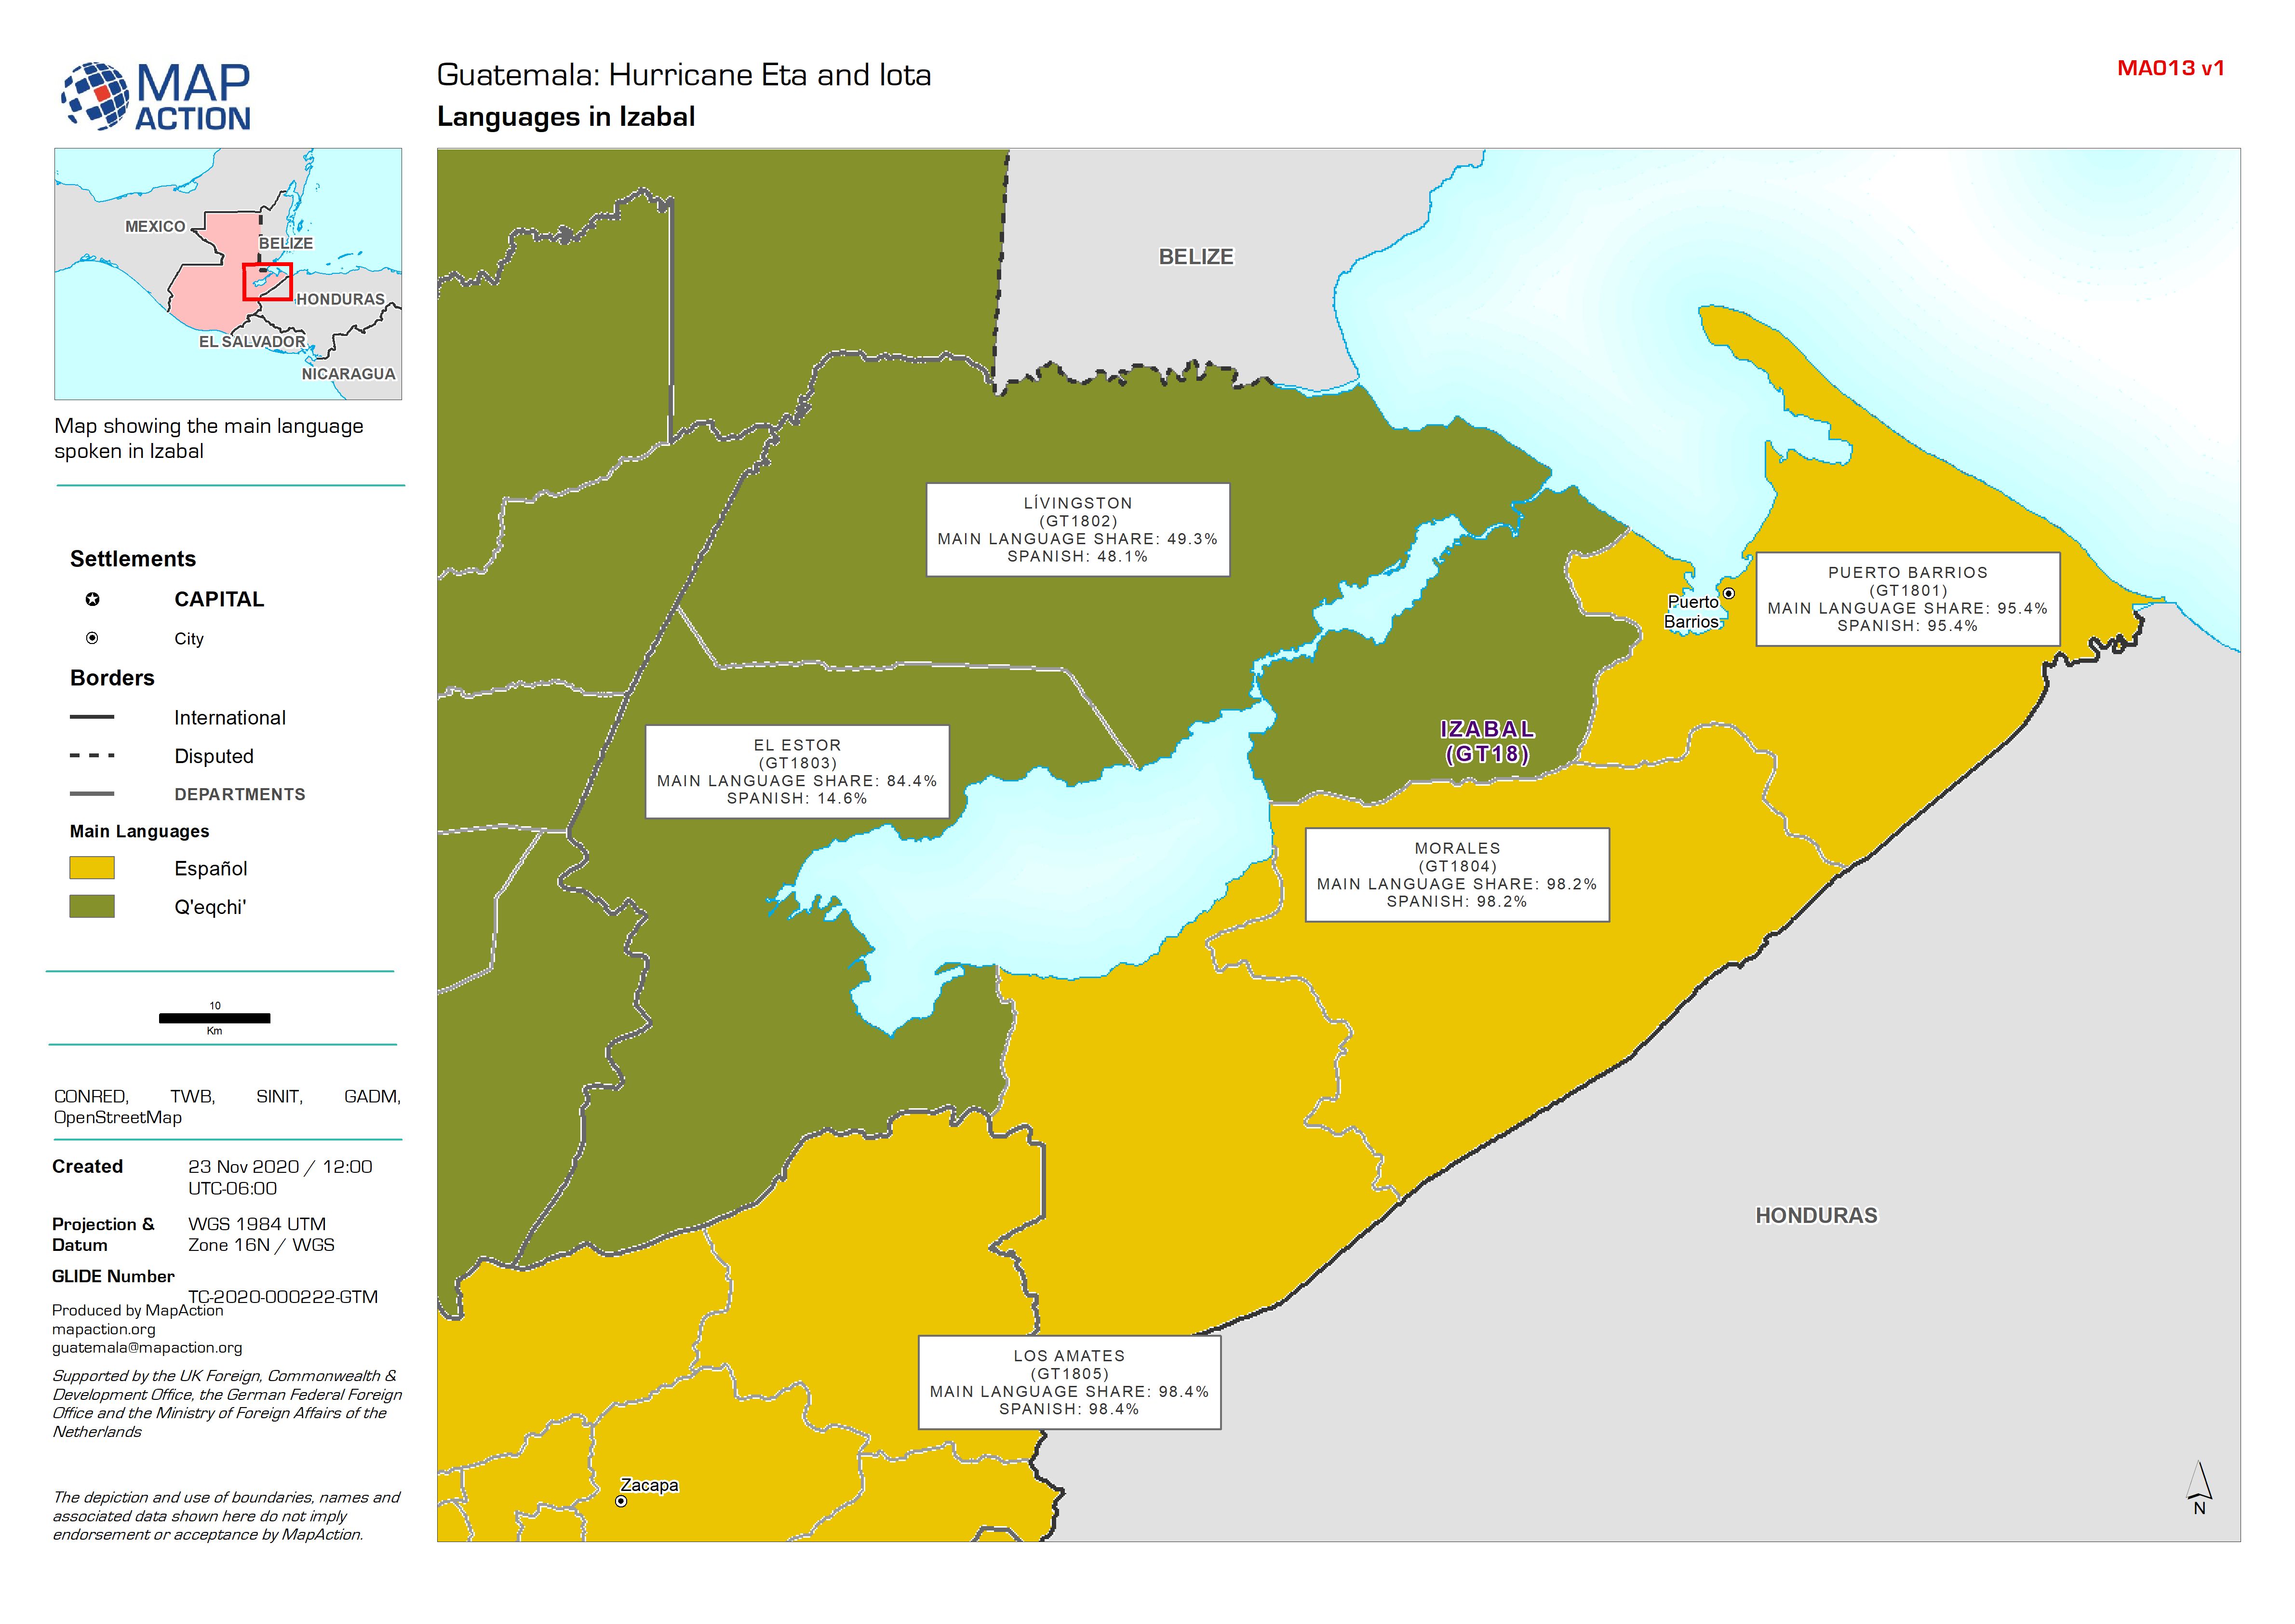
Guatemala: Population Figures (2018) by Municipality in Izabal
Map showing population figures (2018), Department (Admin 1) and Municipality (Admin 2) boundaries, and Pcodes. -

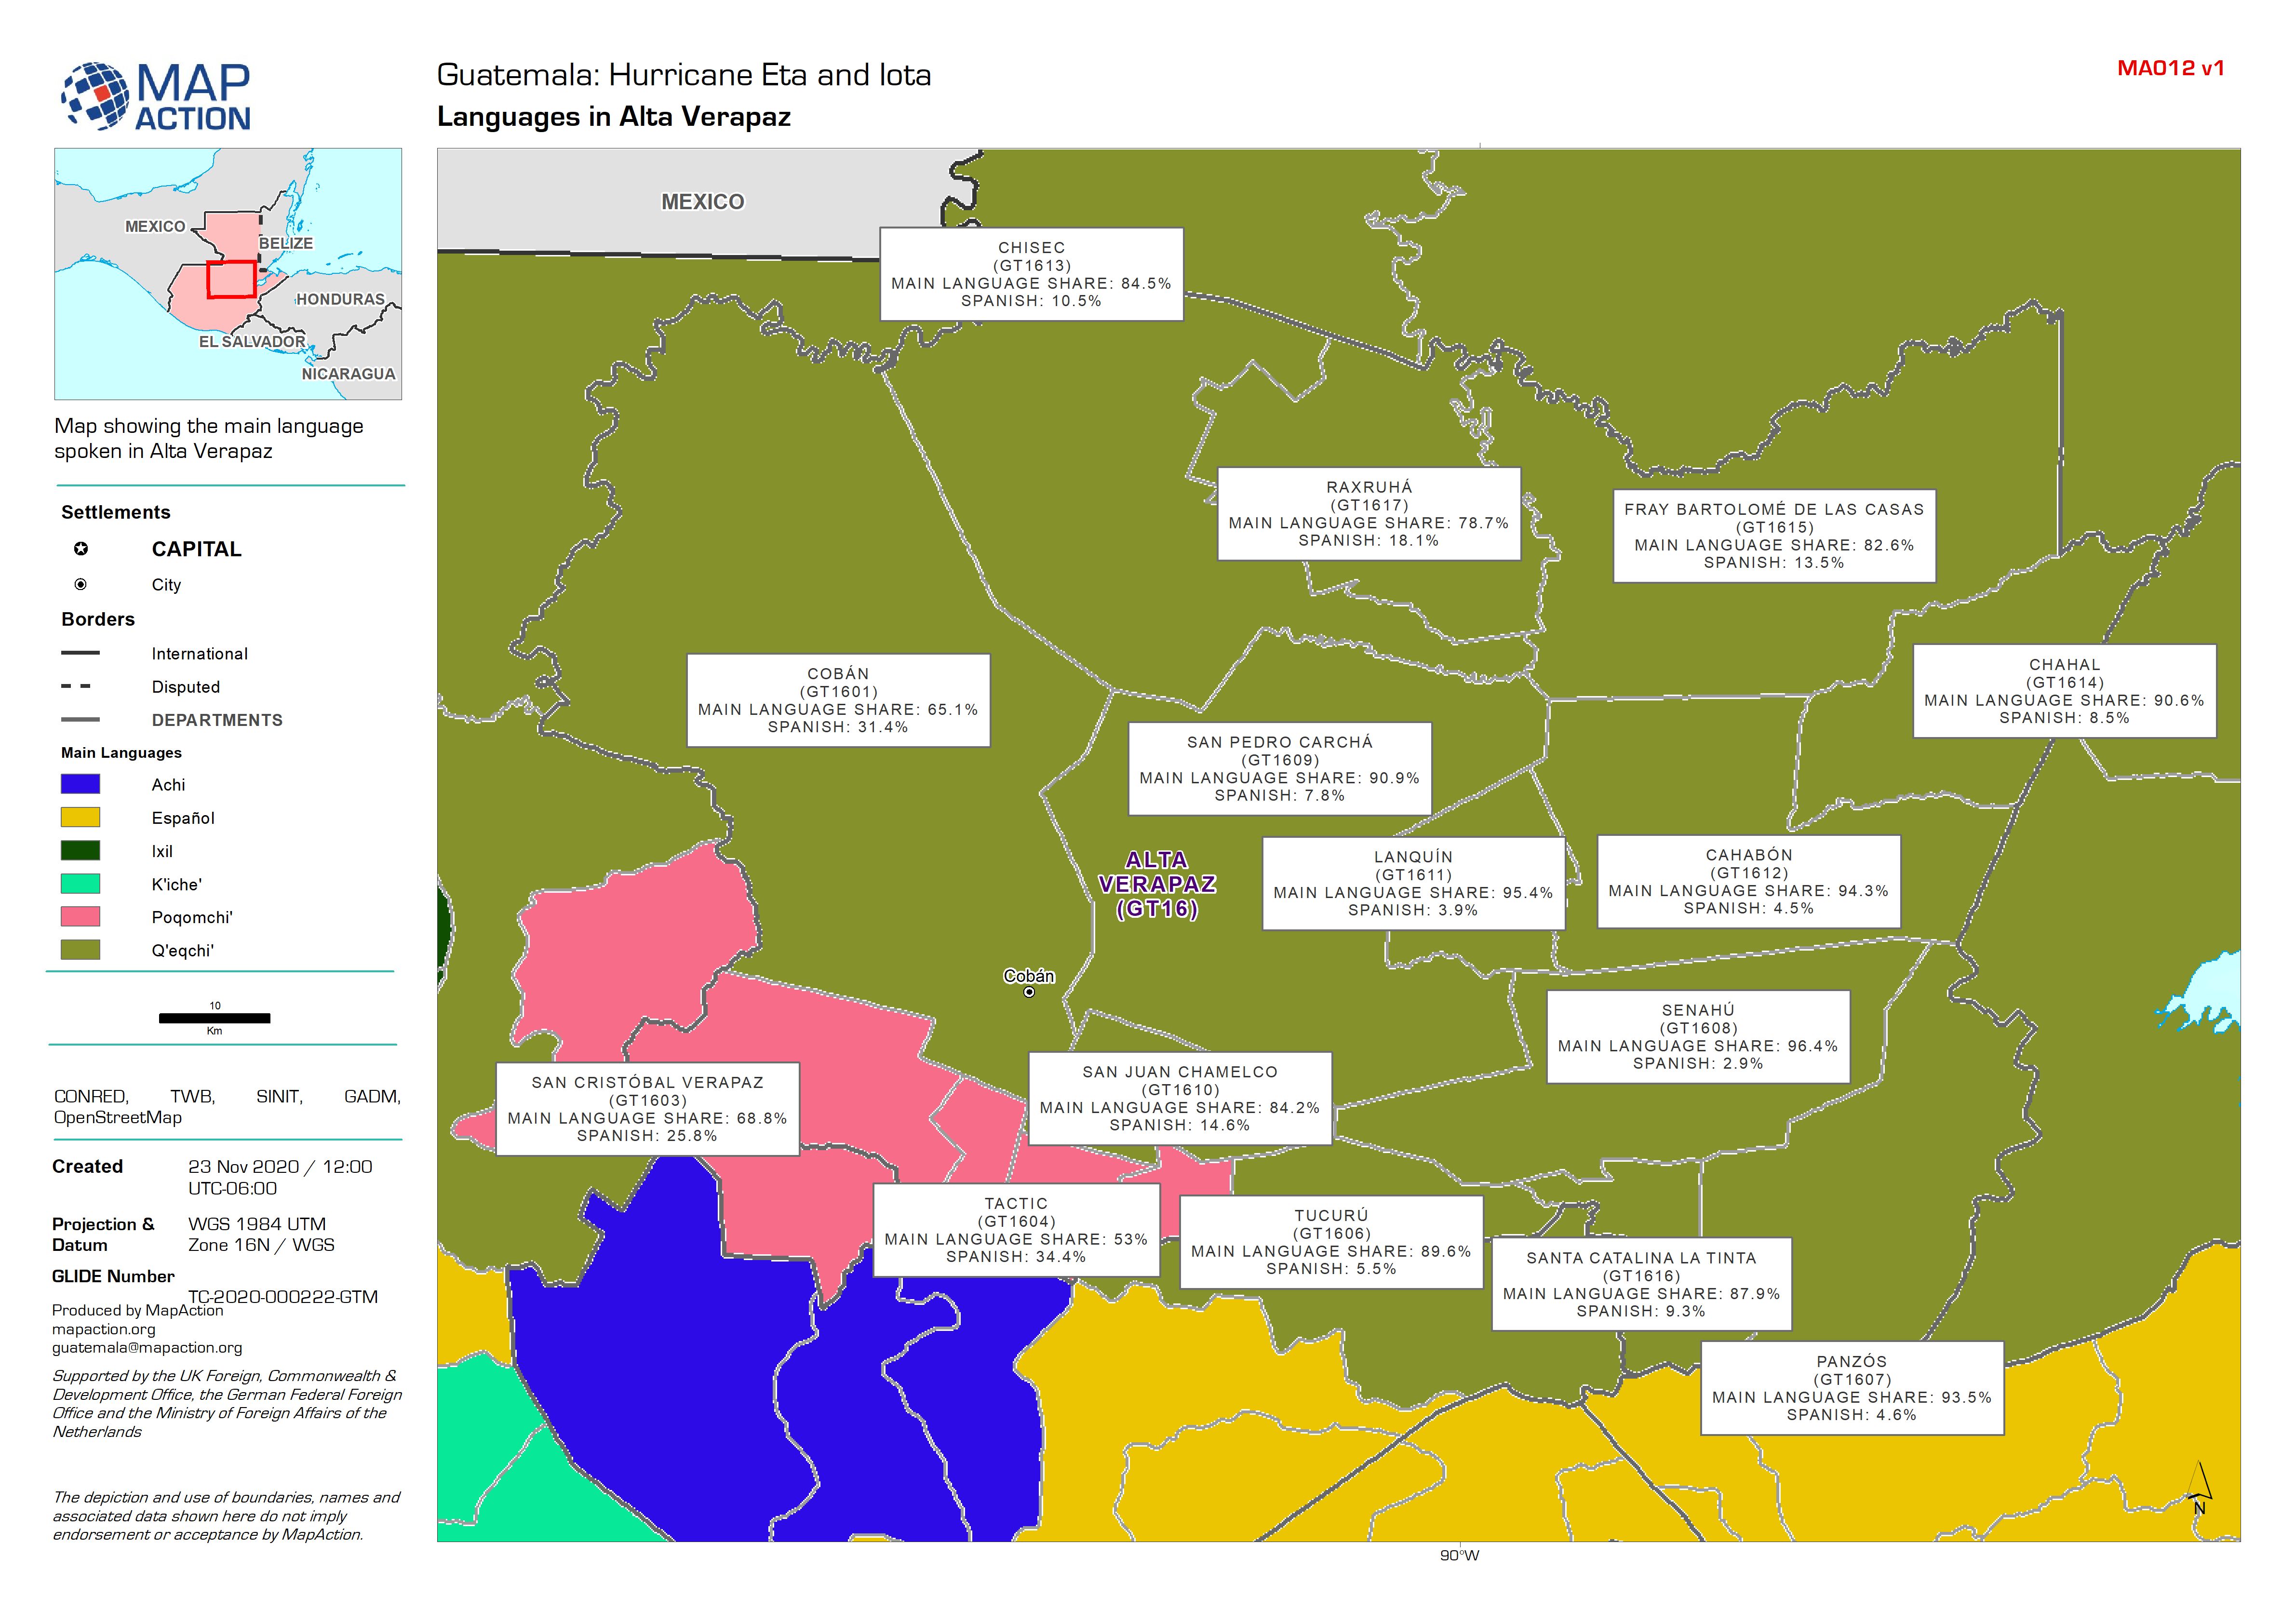
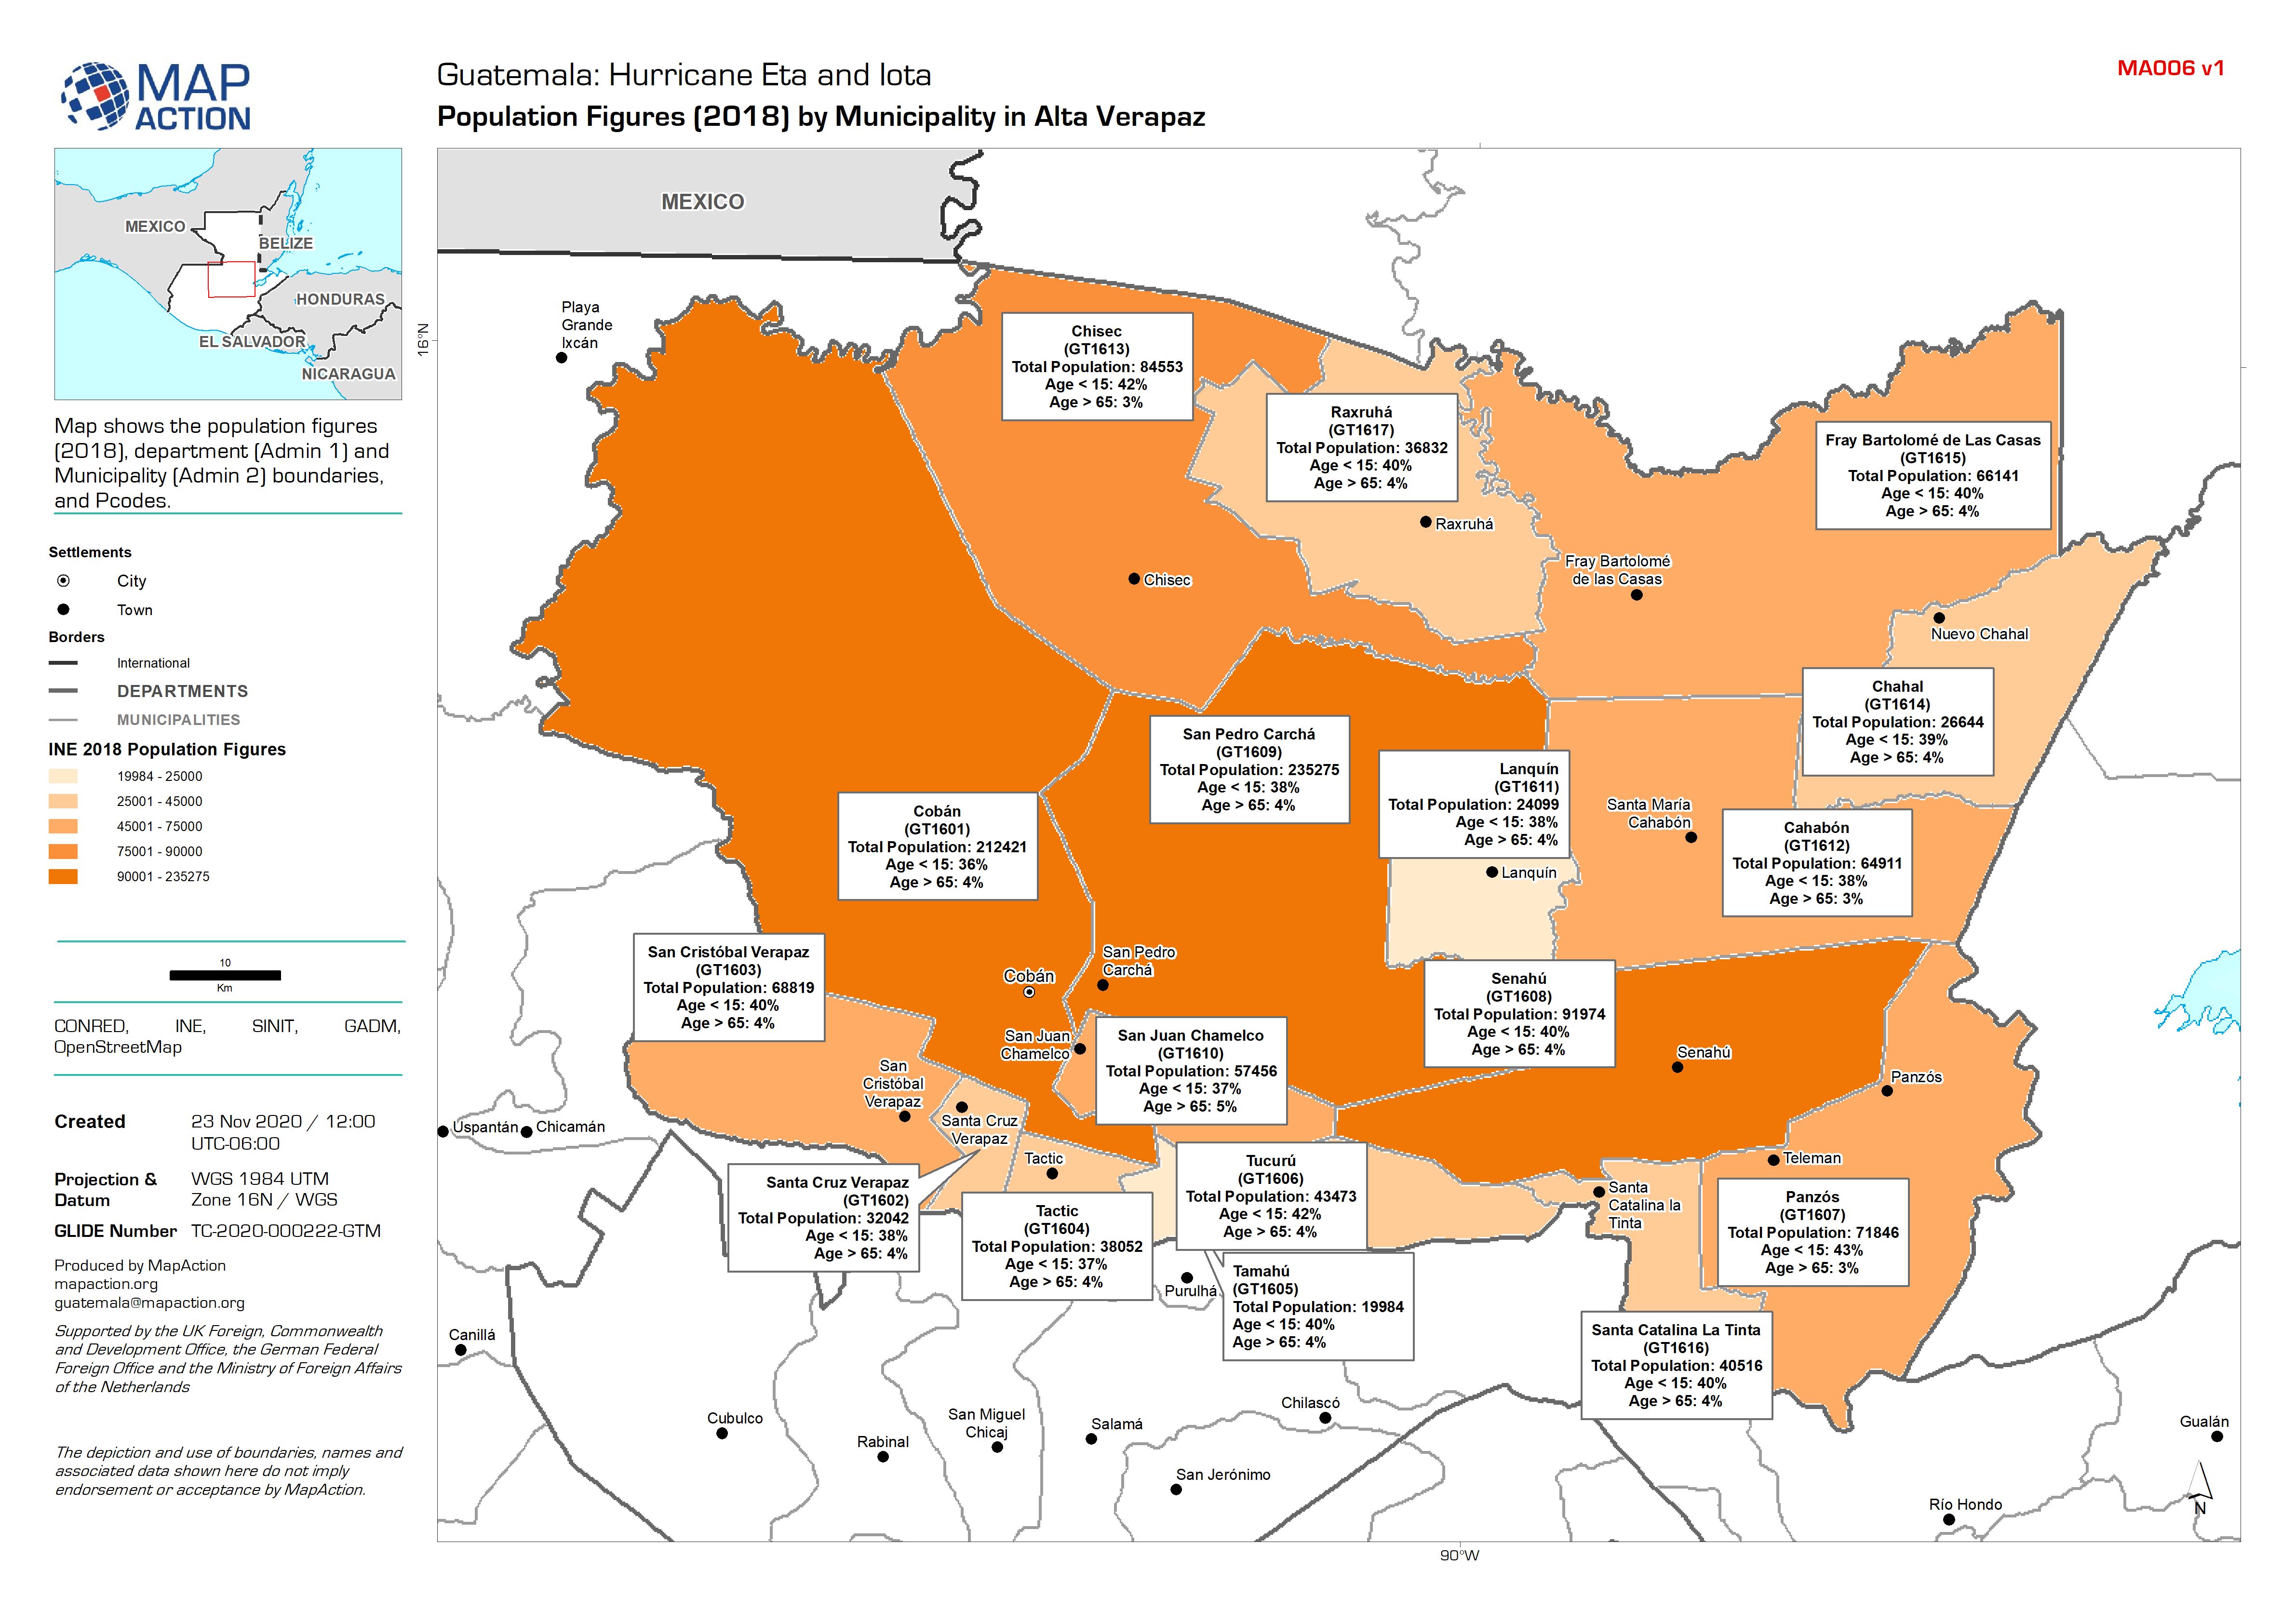
Guatemala: Population Figures (2018) by Municipality in Alta Verapaz
Map shows the population figures (2018), department (Admin 1) and Municipality (Admin 2) boundaries, and Pcodes. -

Guatemala: Administrative level 2 (Municipality) 2018 population statistics
Baseline population for Guatemala -

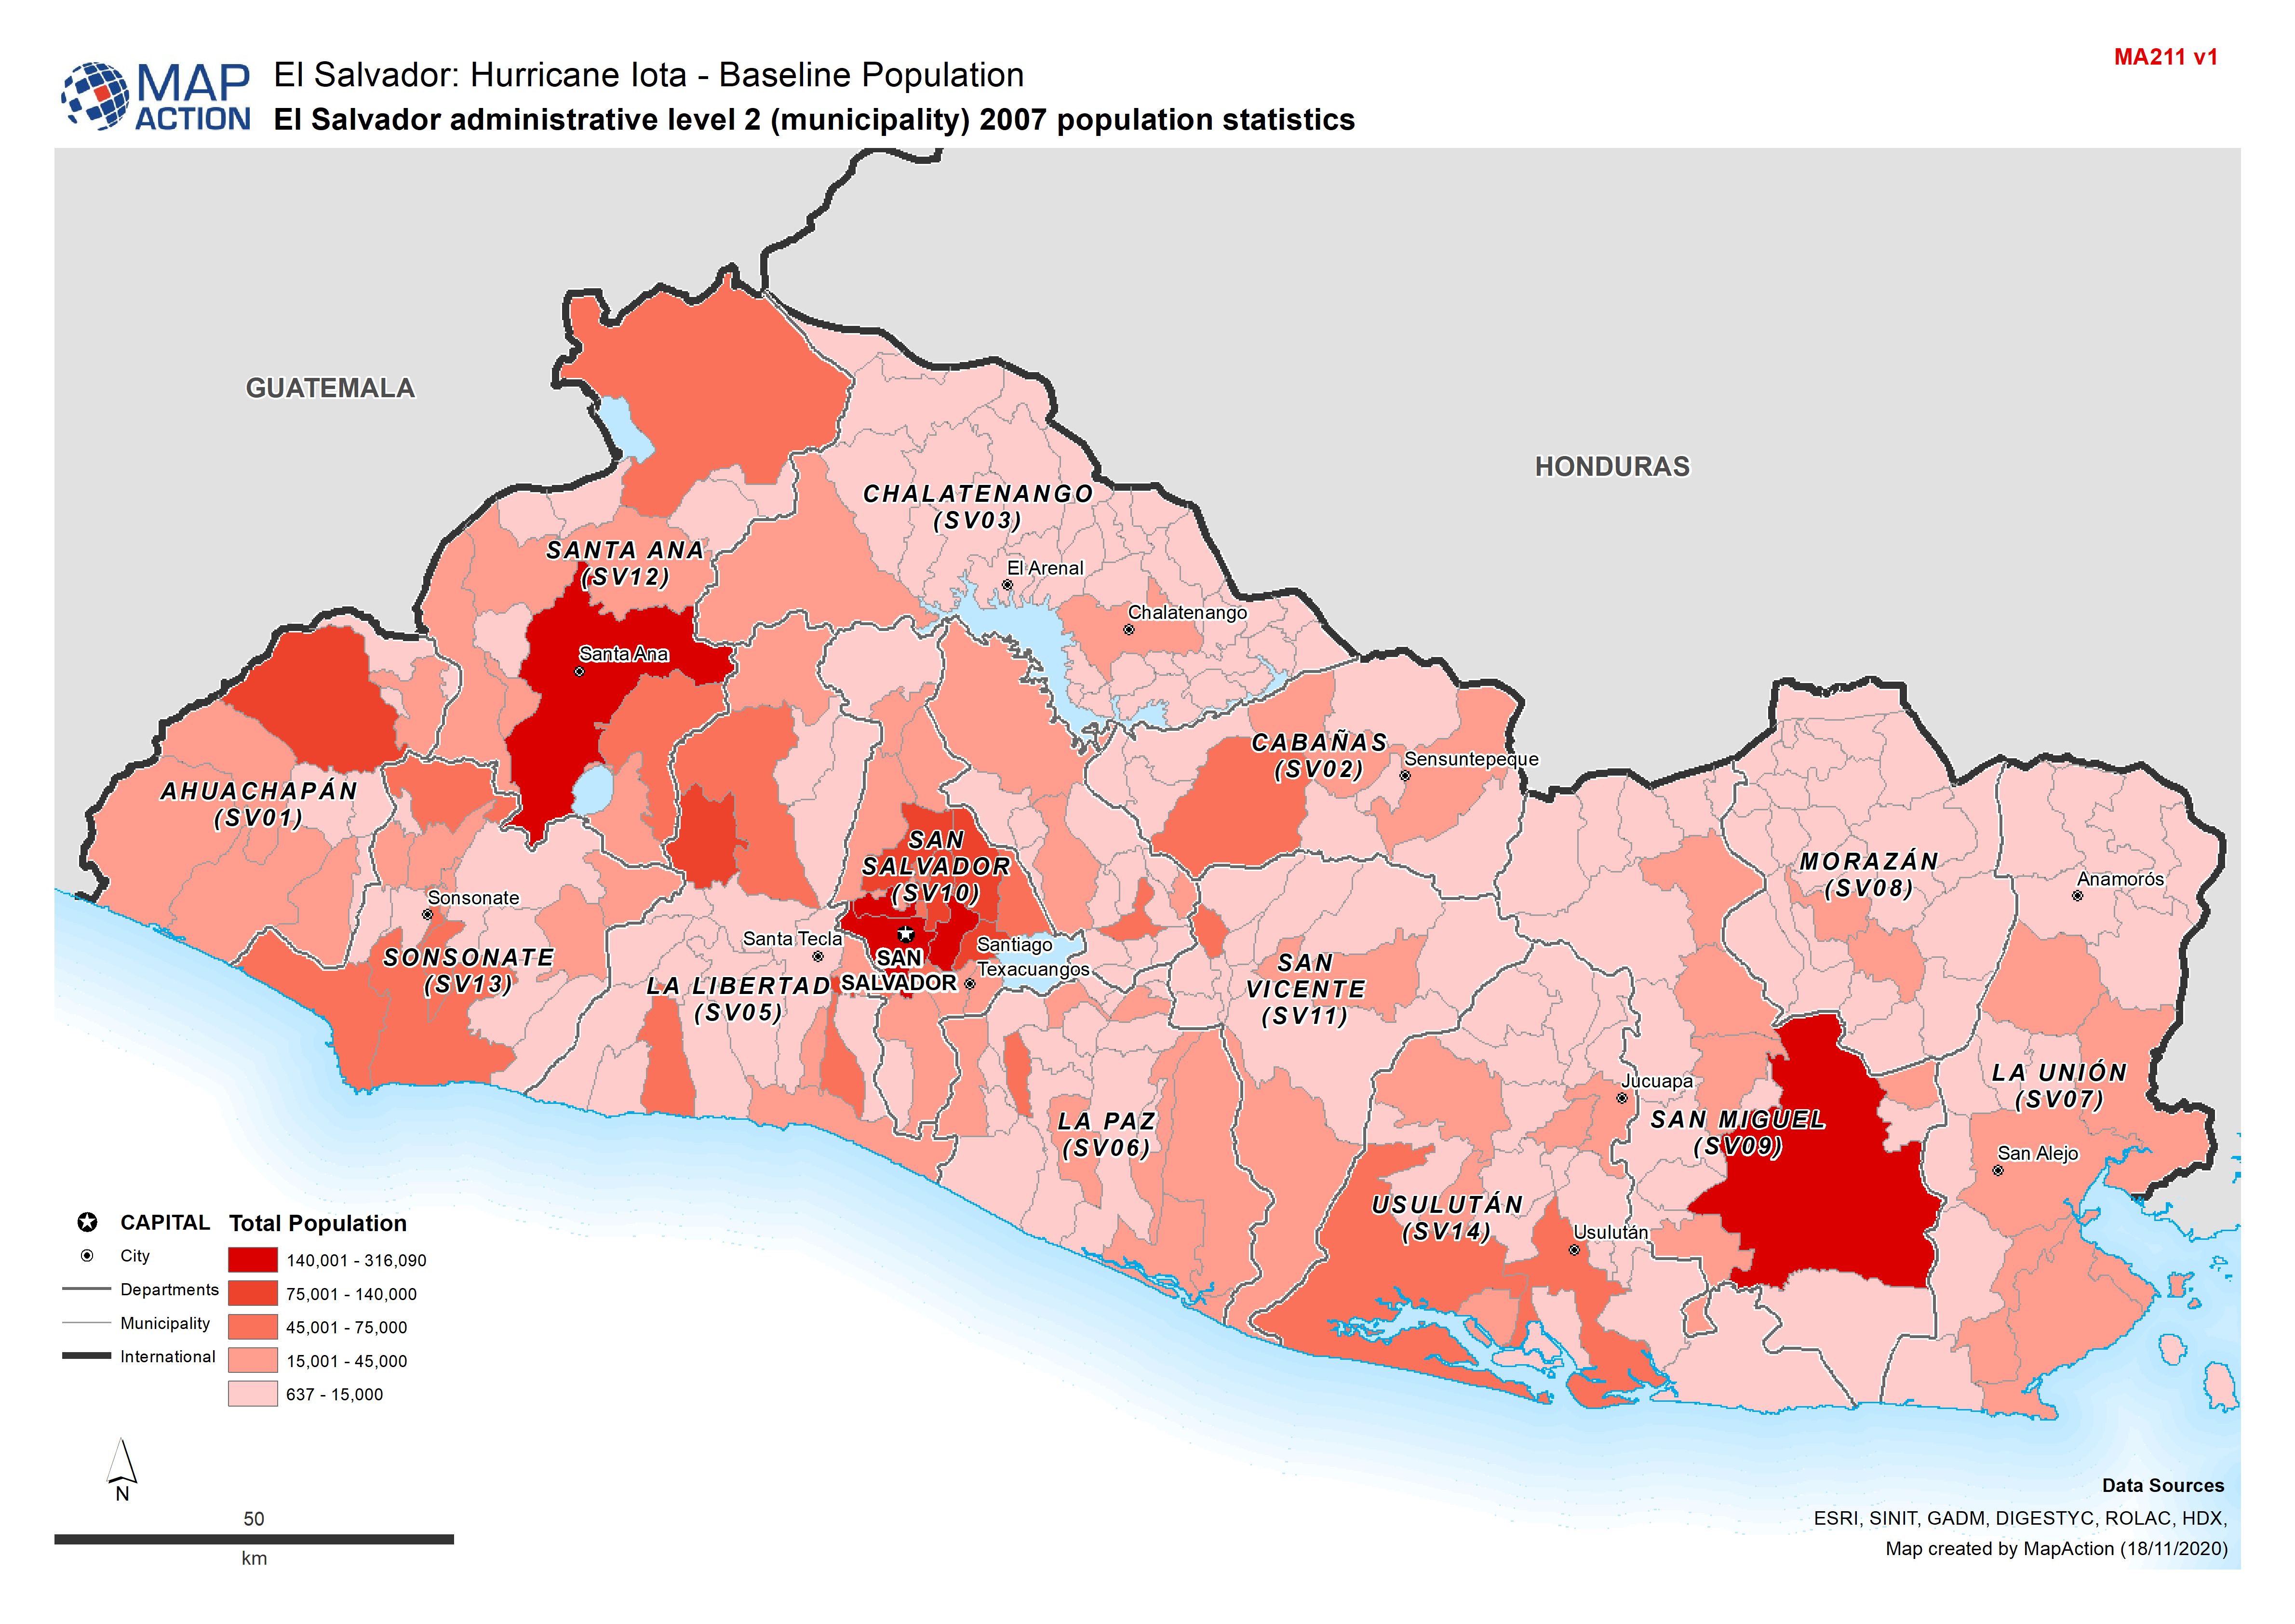
El Salvador: Administrative level 2 (Municipality) 2007 population statistics
Baseline population for El Salvador -

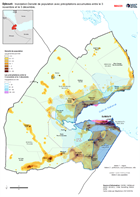
Nicaragua and Honduras: Potential storm track, population and municipalities:...
This map shows the potentially affected administration level 2 municipalities for Nicaragua, with departmental population for Nicaragua and Honduras, and predicted wind speed... -
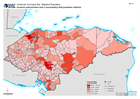
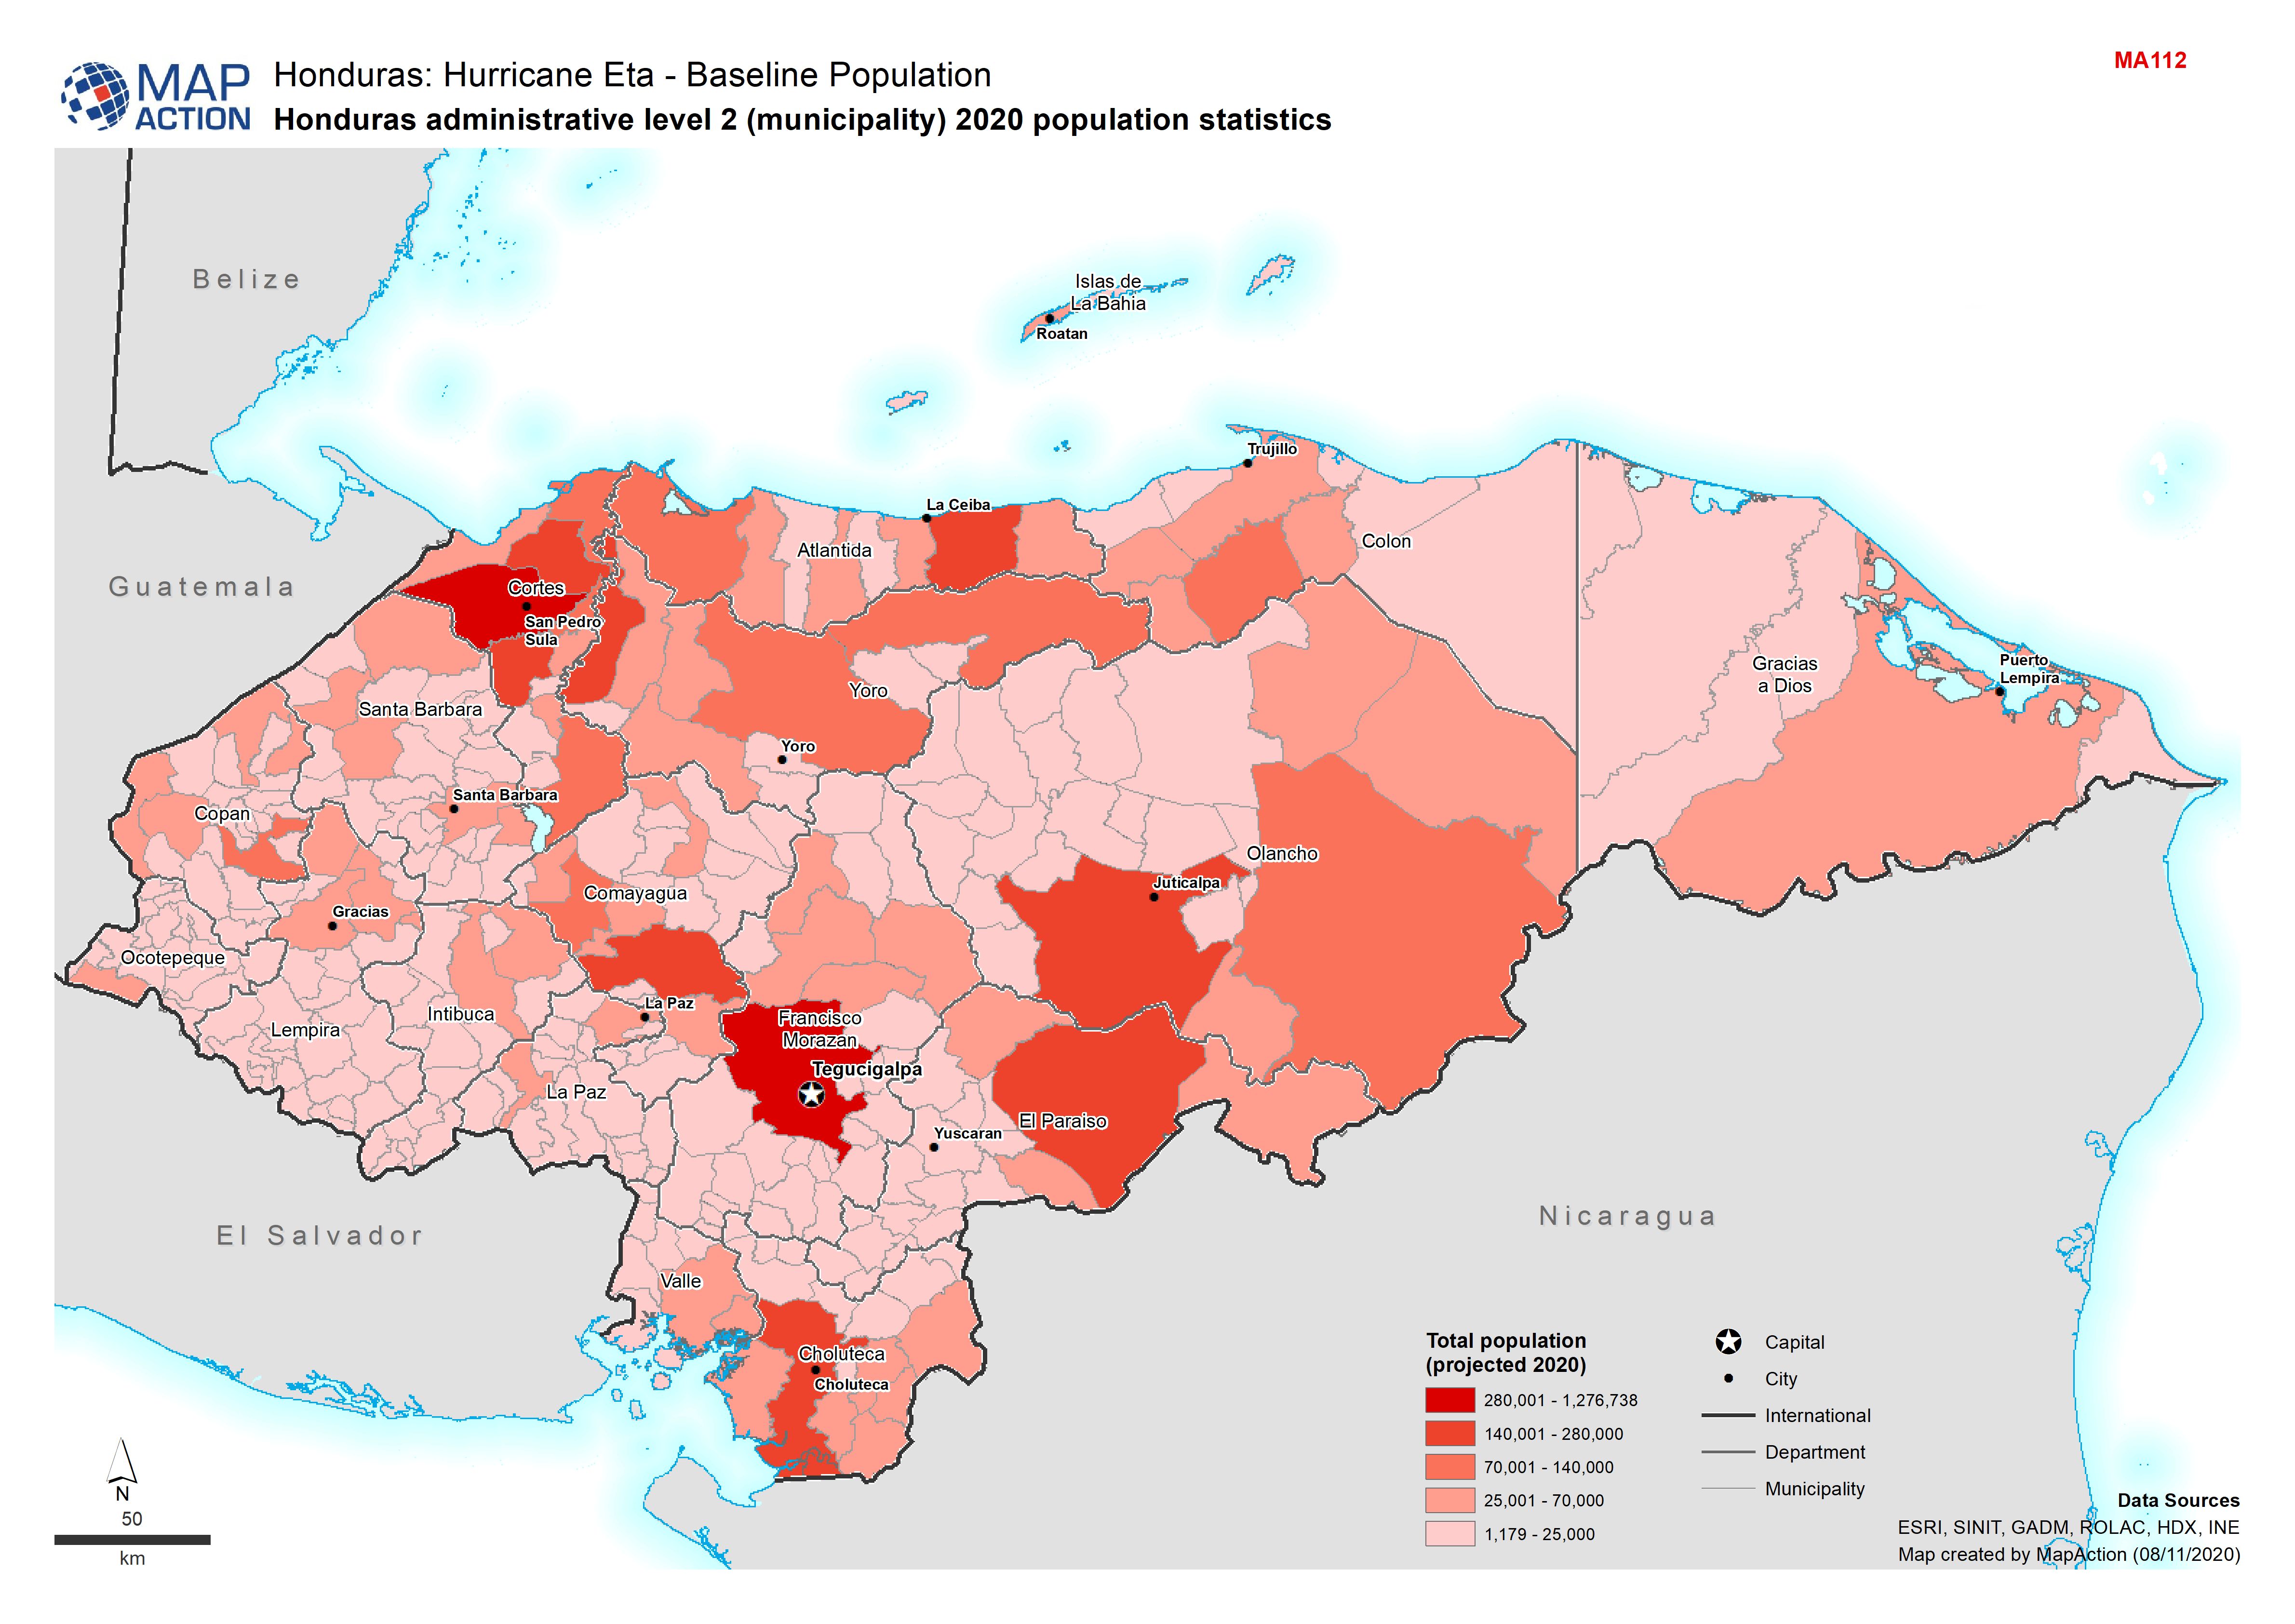
Honduras: administrative level 2 (municipality) 2020 population statistics
Baseline population for Honduras -

The Philippines: Typhoon Goni - Baseline population (2020 estimate) in storm ...
Map shows the path of the storm and the population density. -

Baseline population density and reported flood extents (as at 23 Oct 2020)
Map shows the population density (people per pixel) and the known flood extents. -

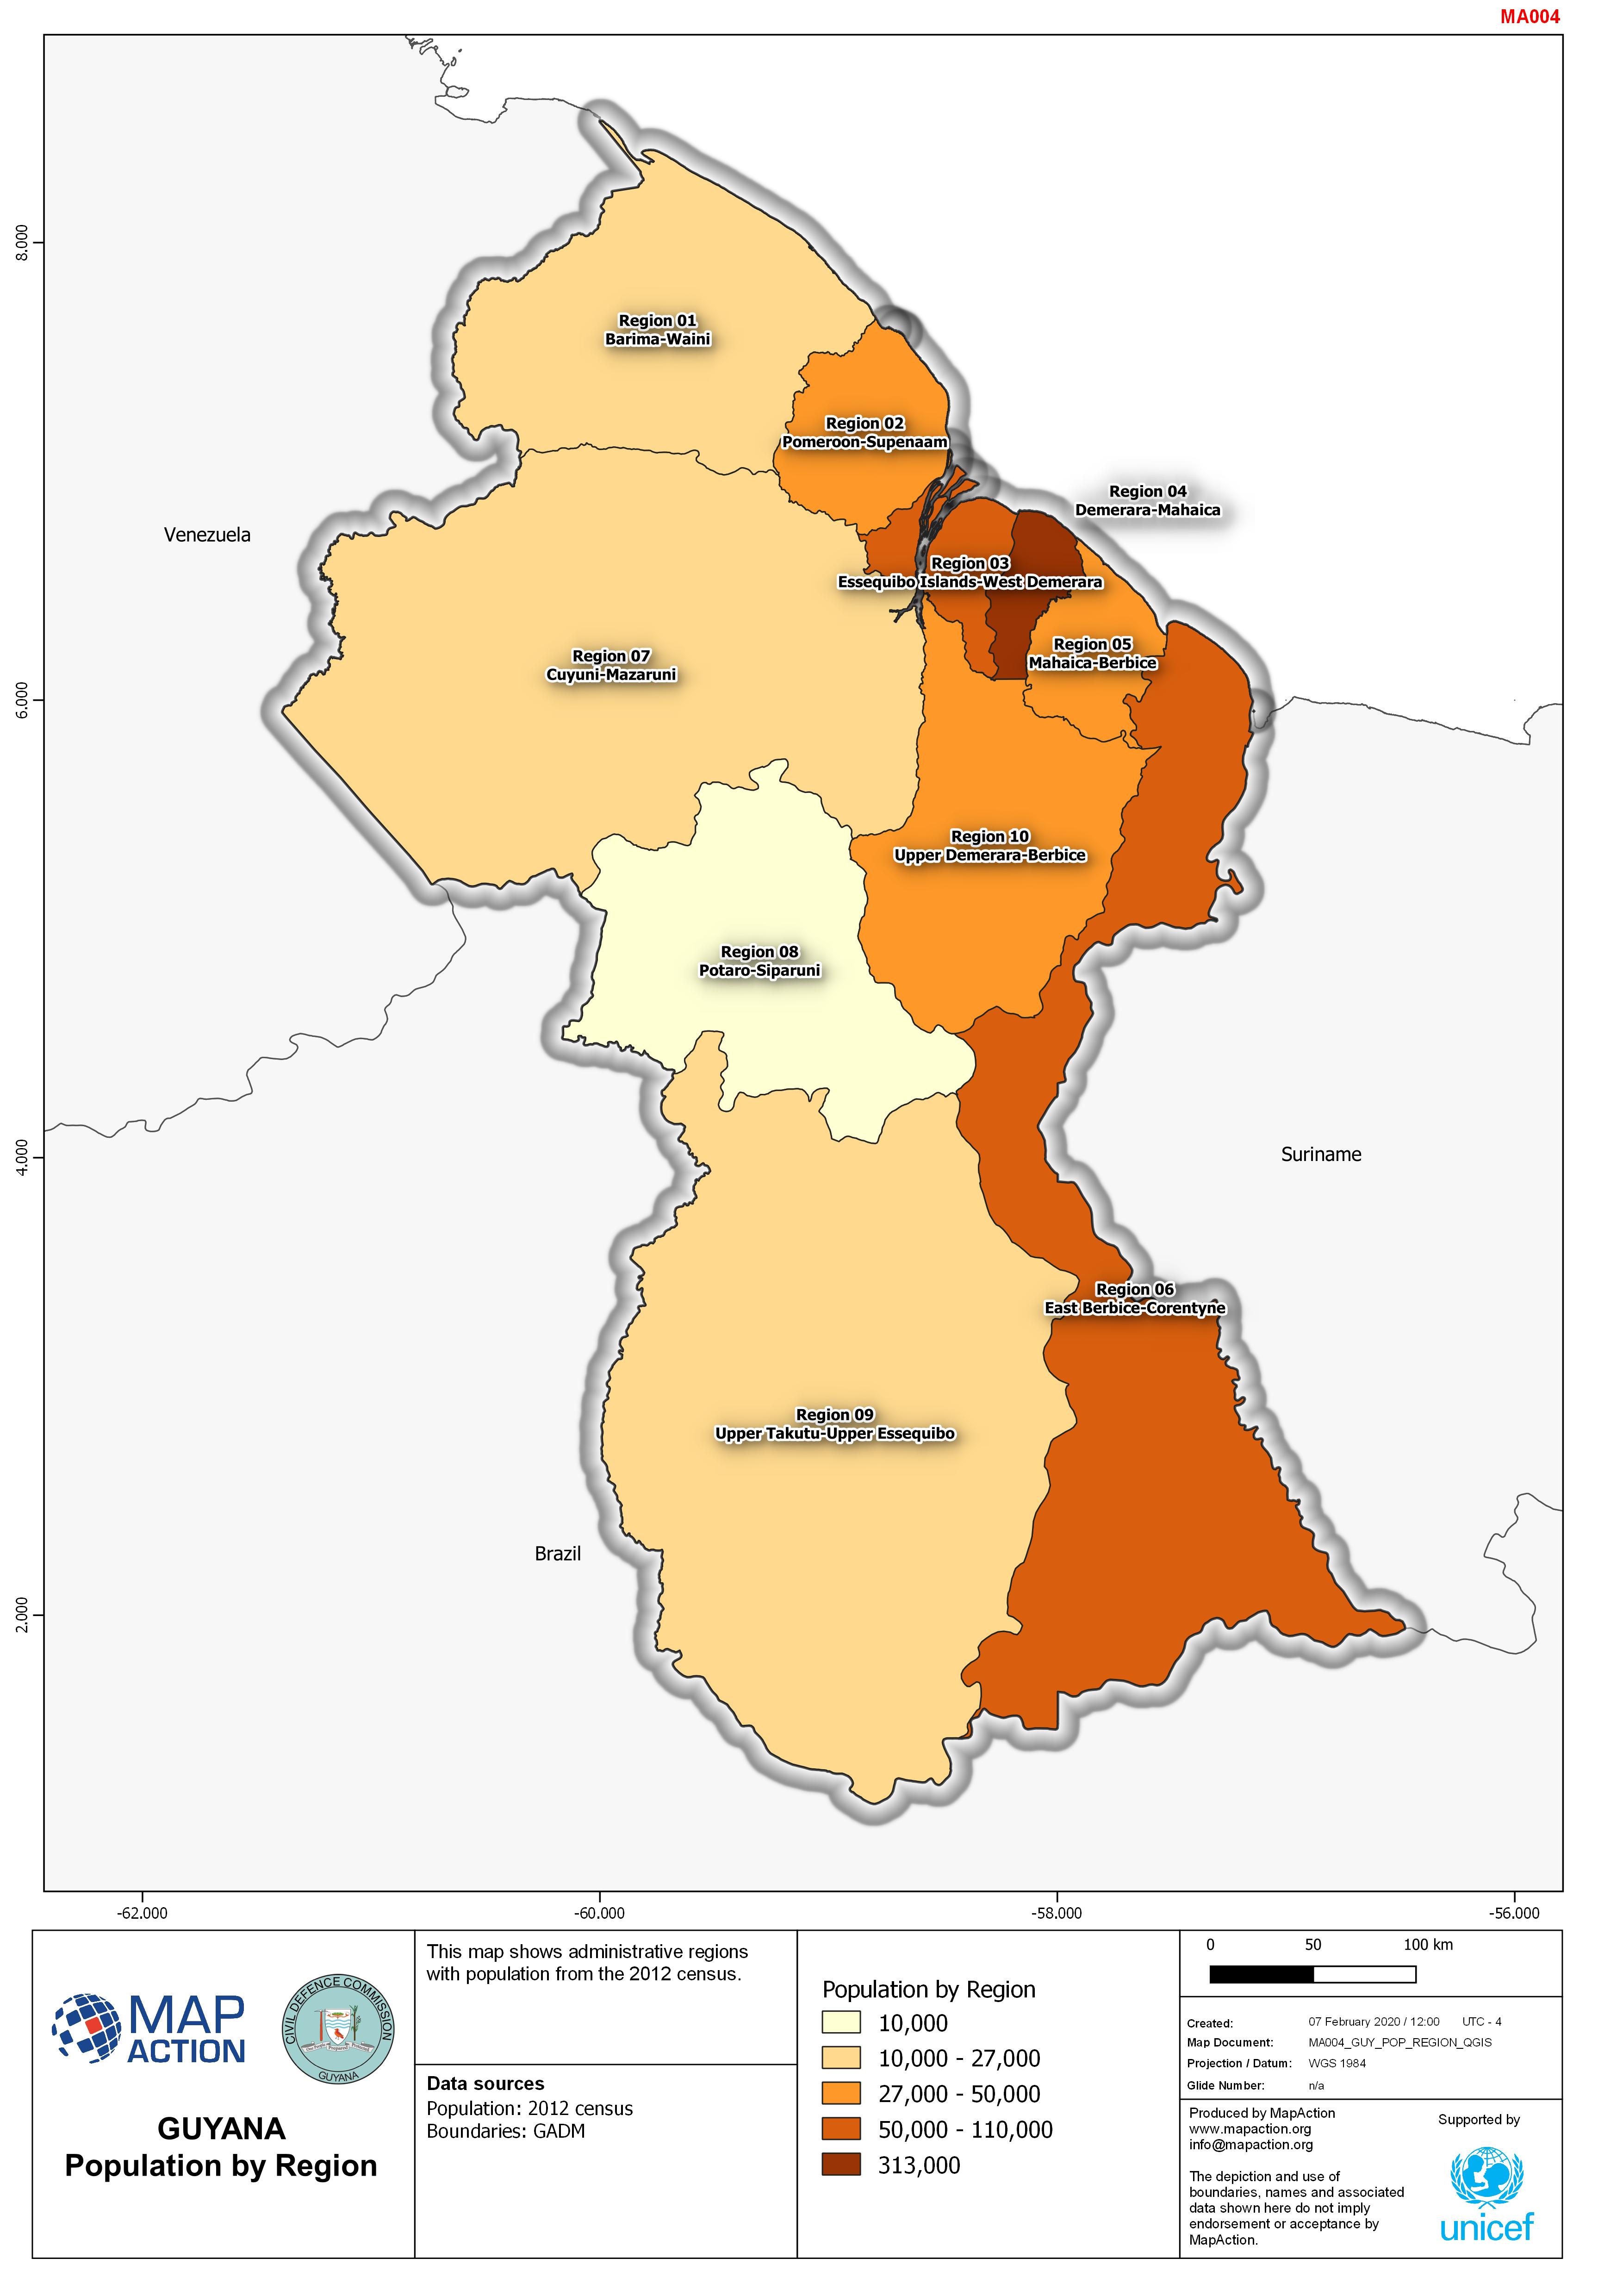
Guyana: Population by Region
This map shows administrative regions with population from the 2012 census. -
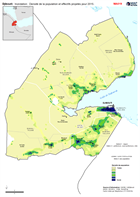
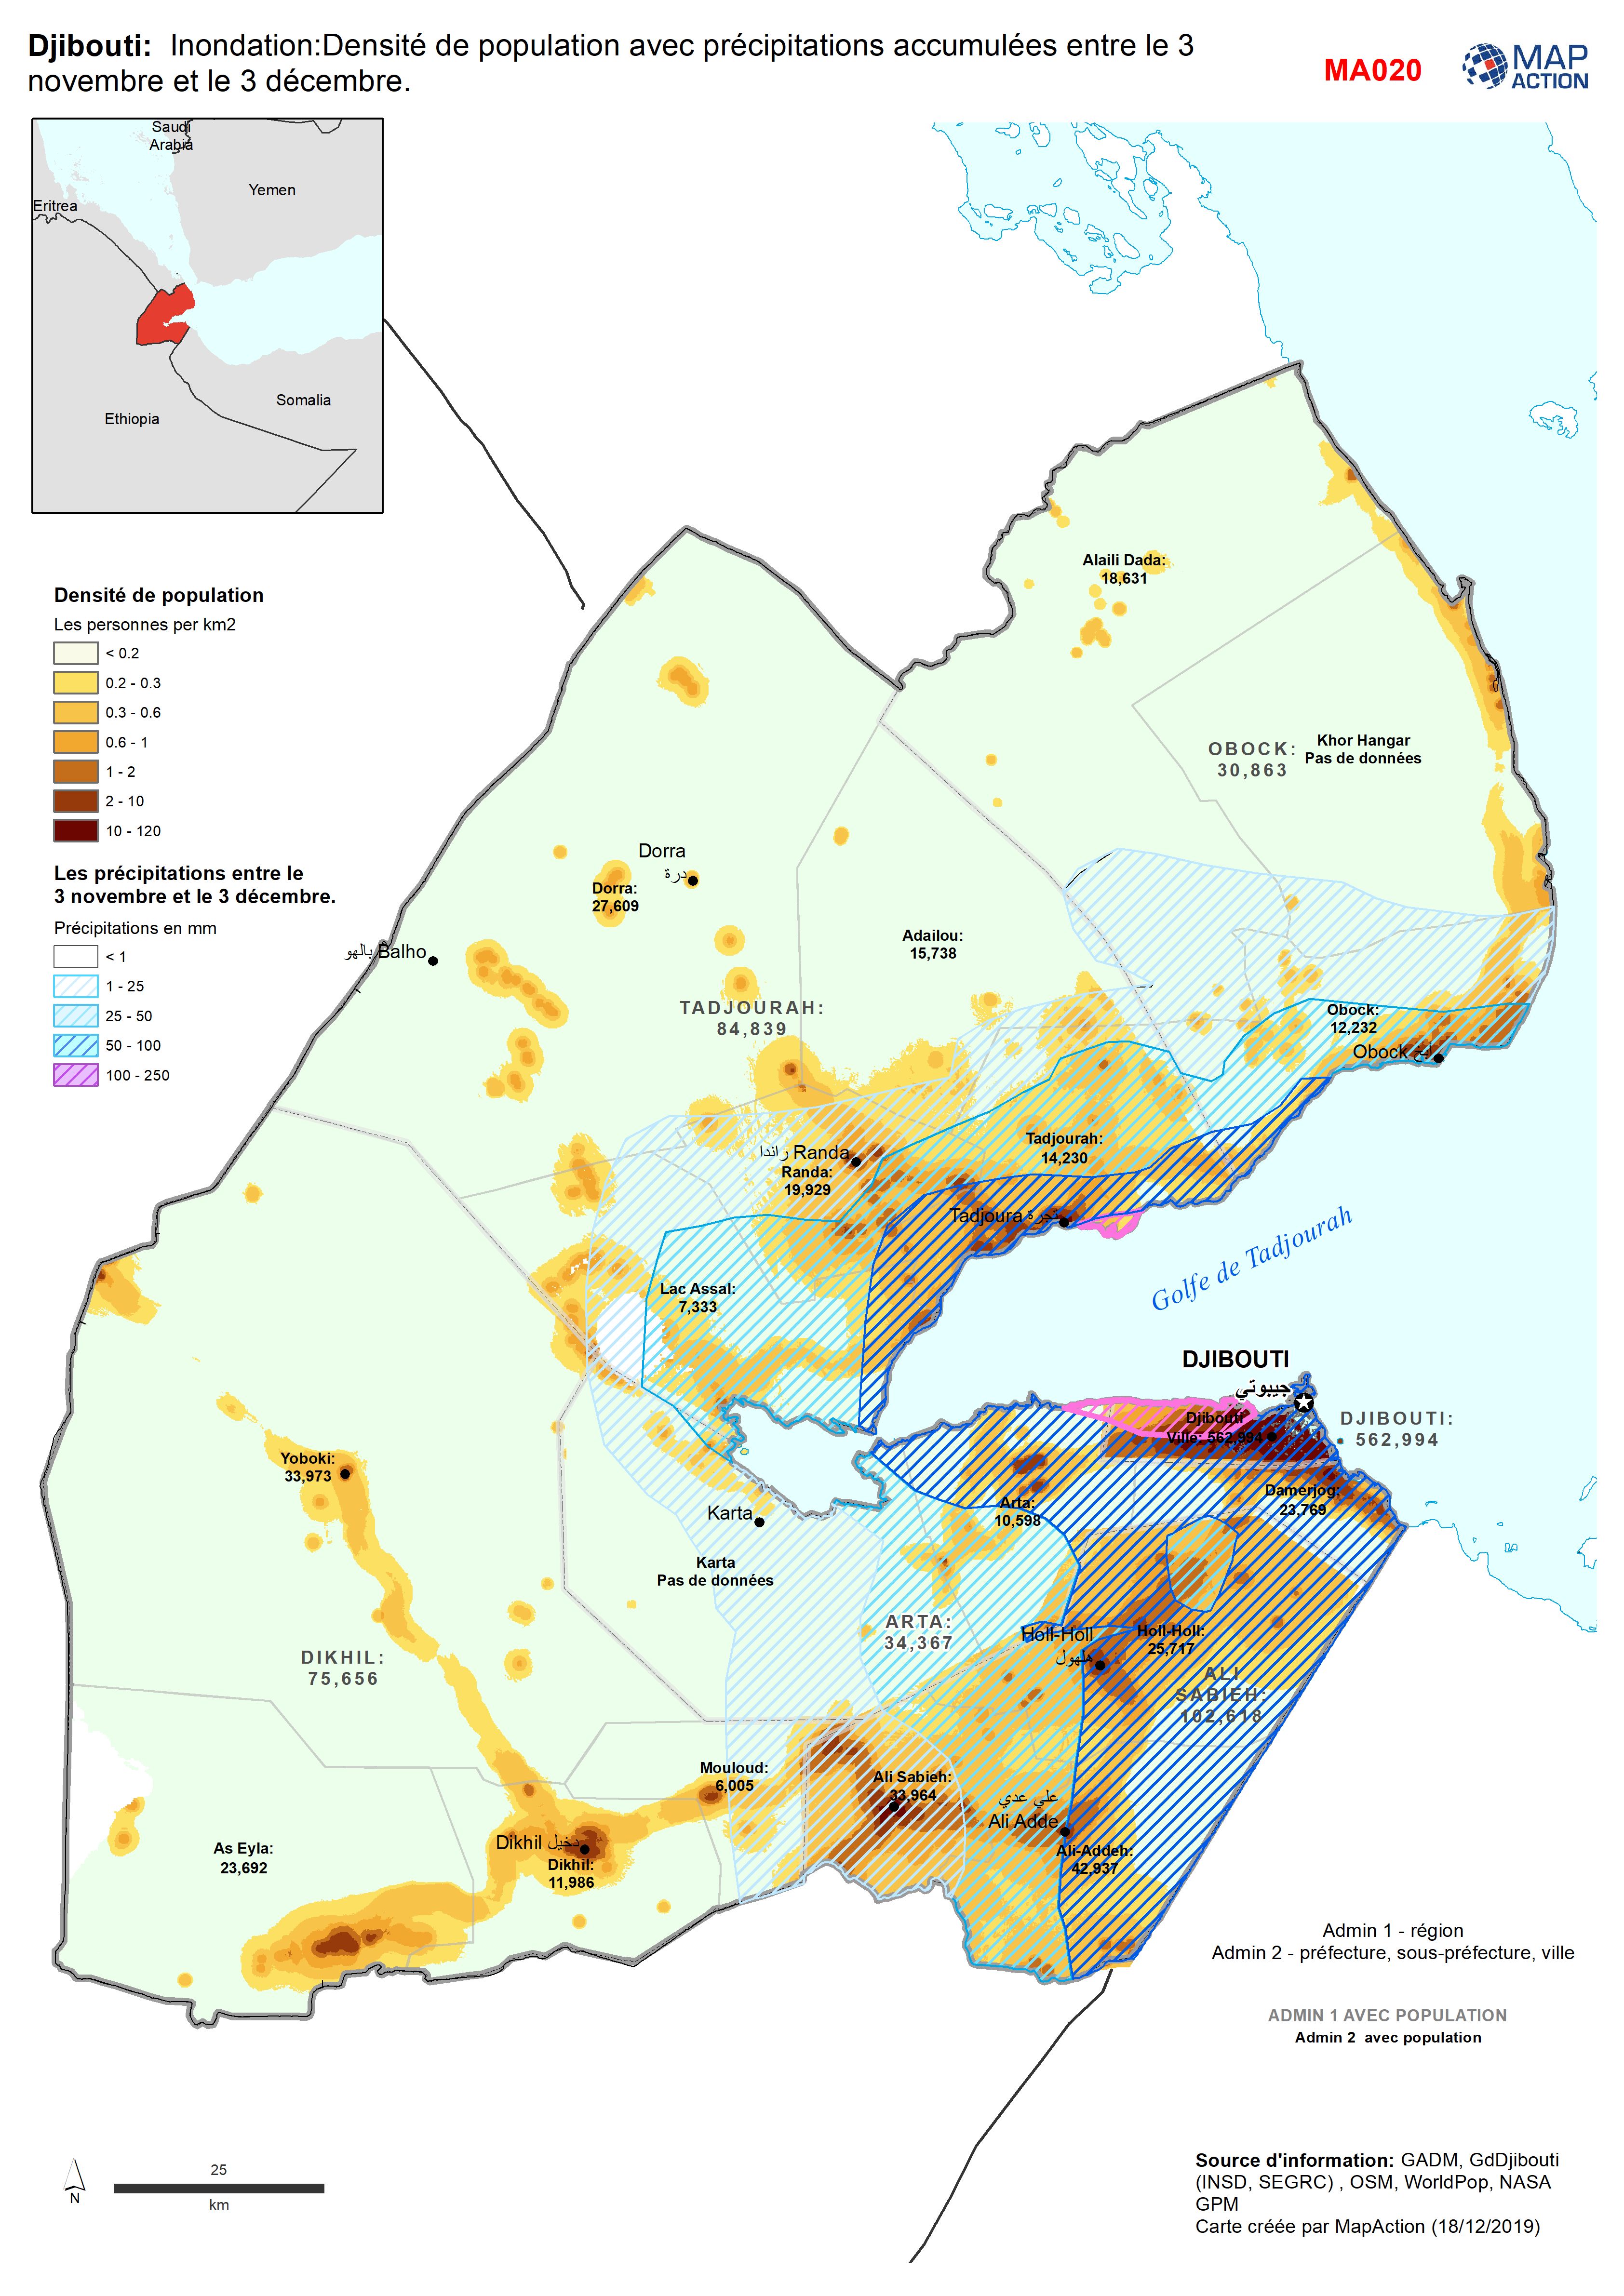
Djibouti: Inondation:Densité de population avec précipitations accumulées ent...
Population Density for 2018 with accumulated rainfall between 3 Nov - 3 Dec. -
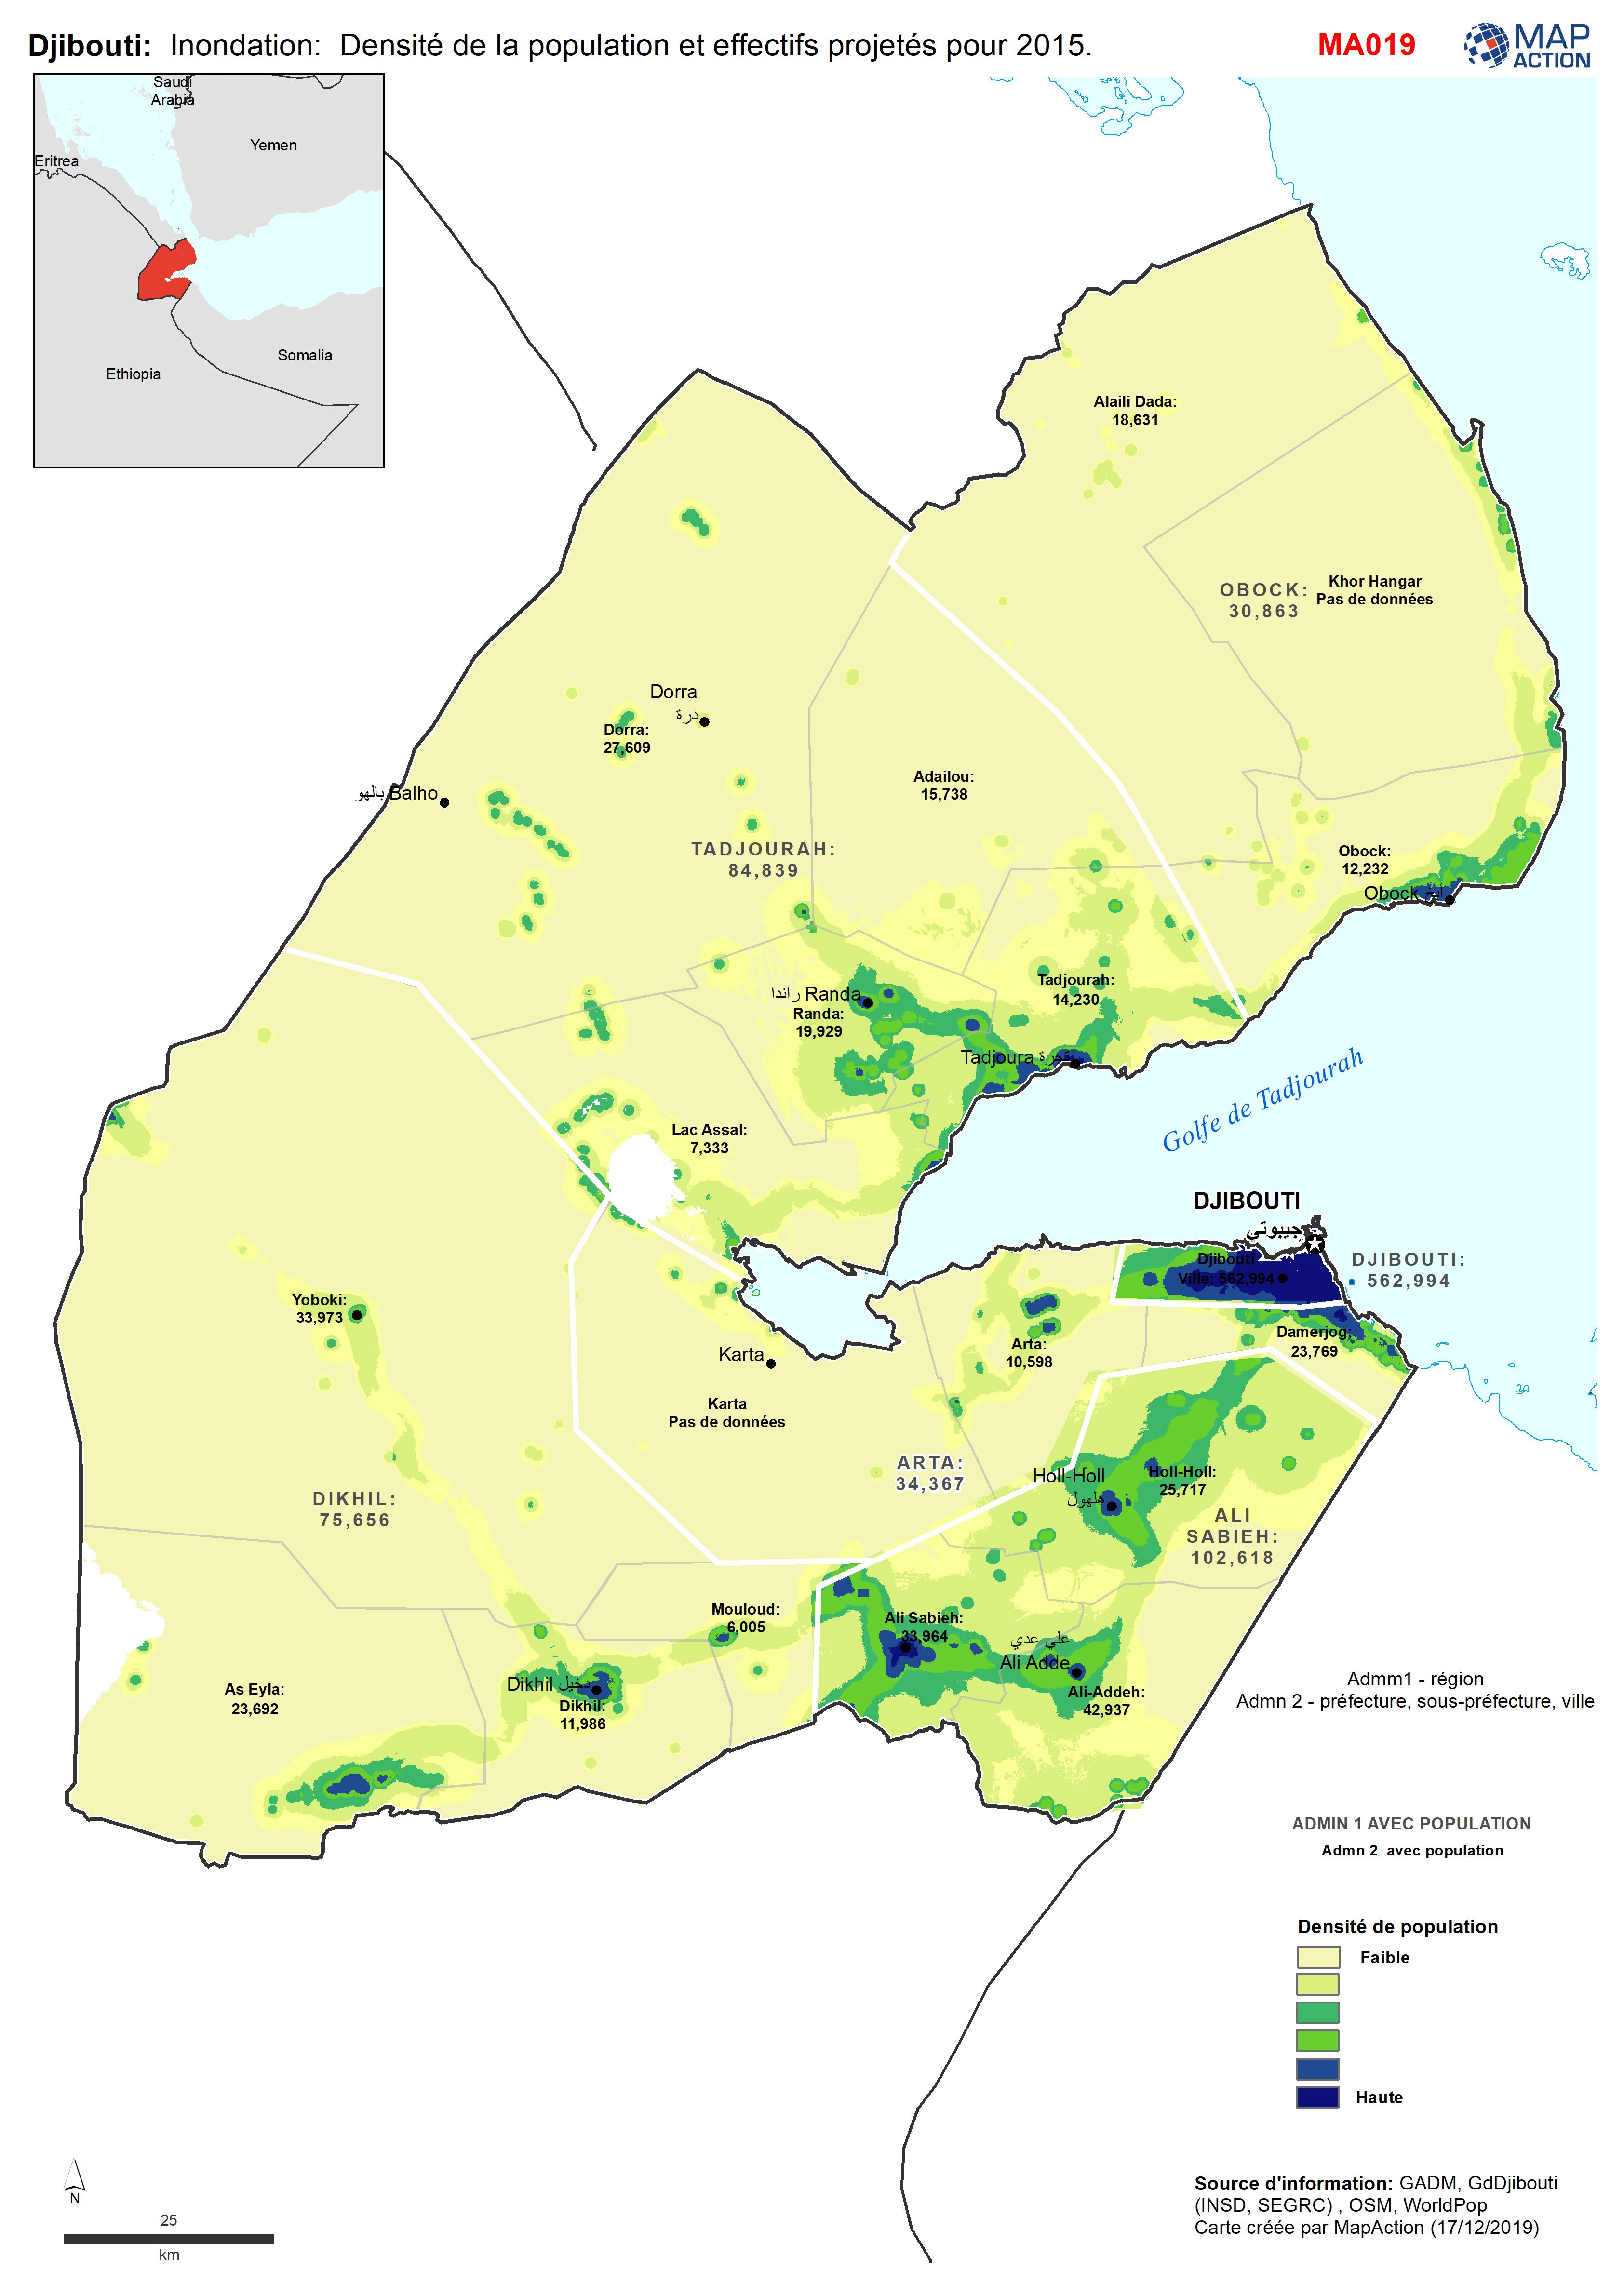
Djibouti: Inondation: Densité de la population et effectifs projetés pour 2015.
Population Density for 2018 with population totals projected forward from 2009 census to 2015 for Admin Level 1 (District/Region) and Admin Level 2 (Prefecture, Sous Prefecture... -
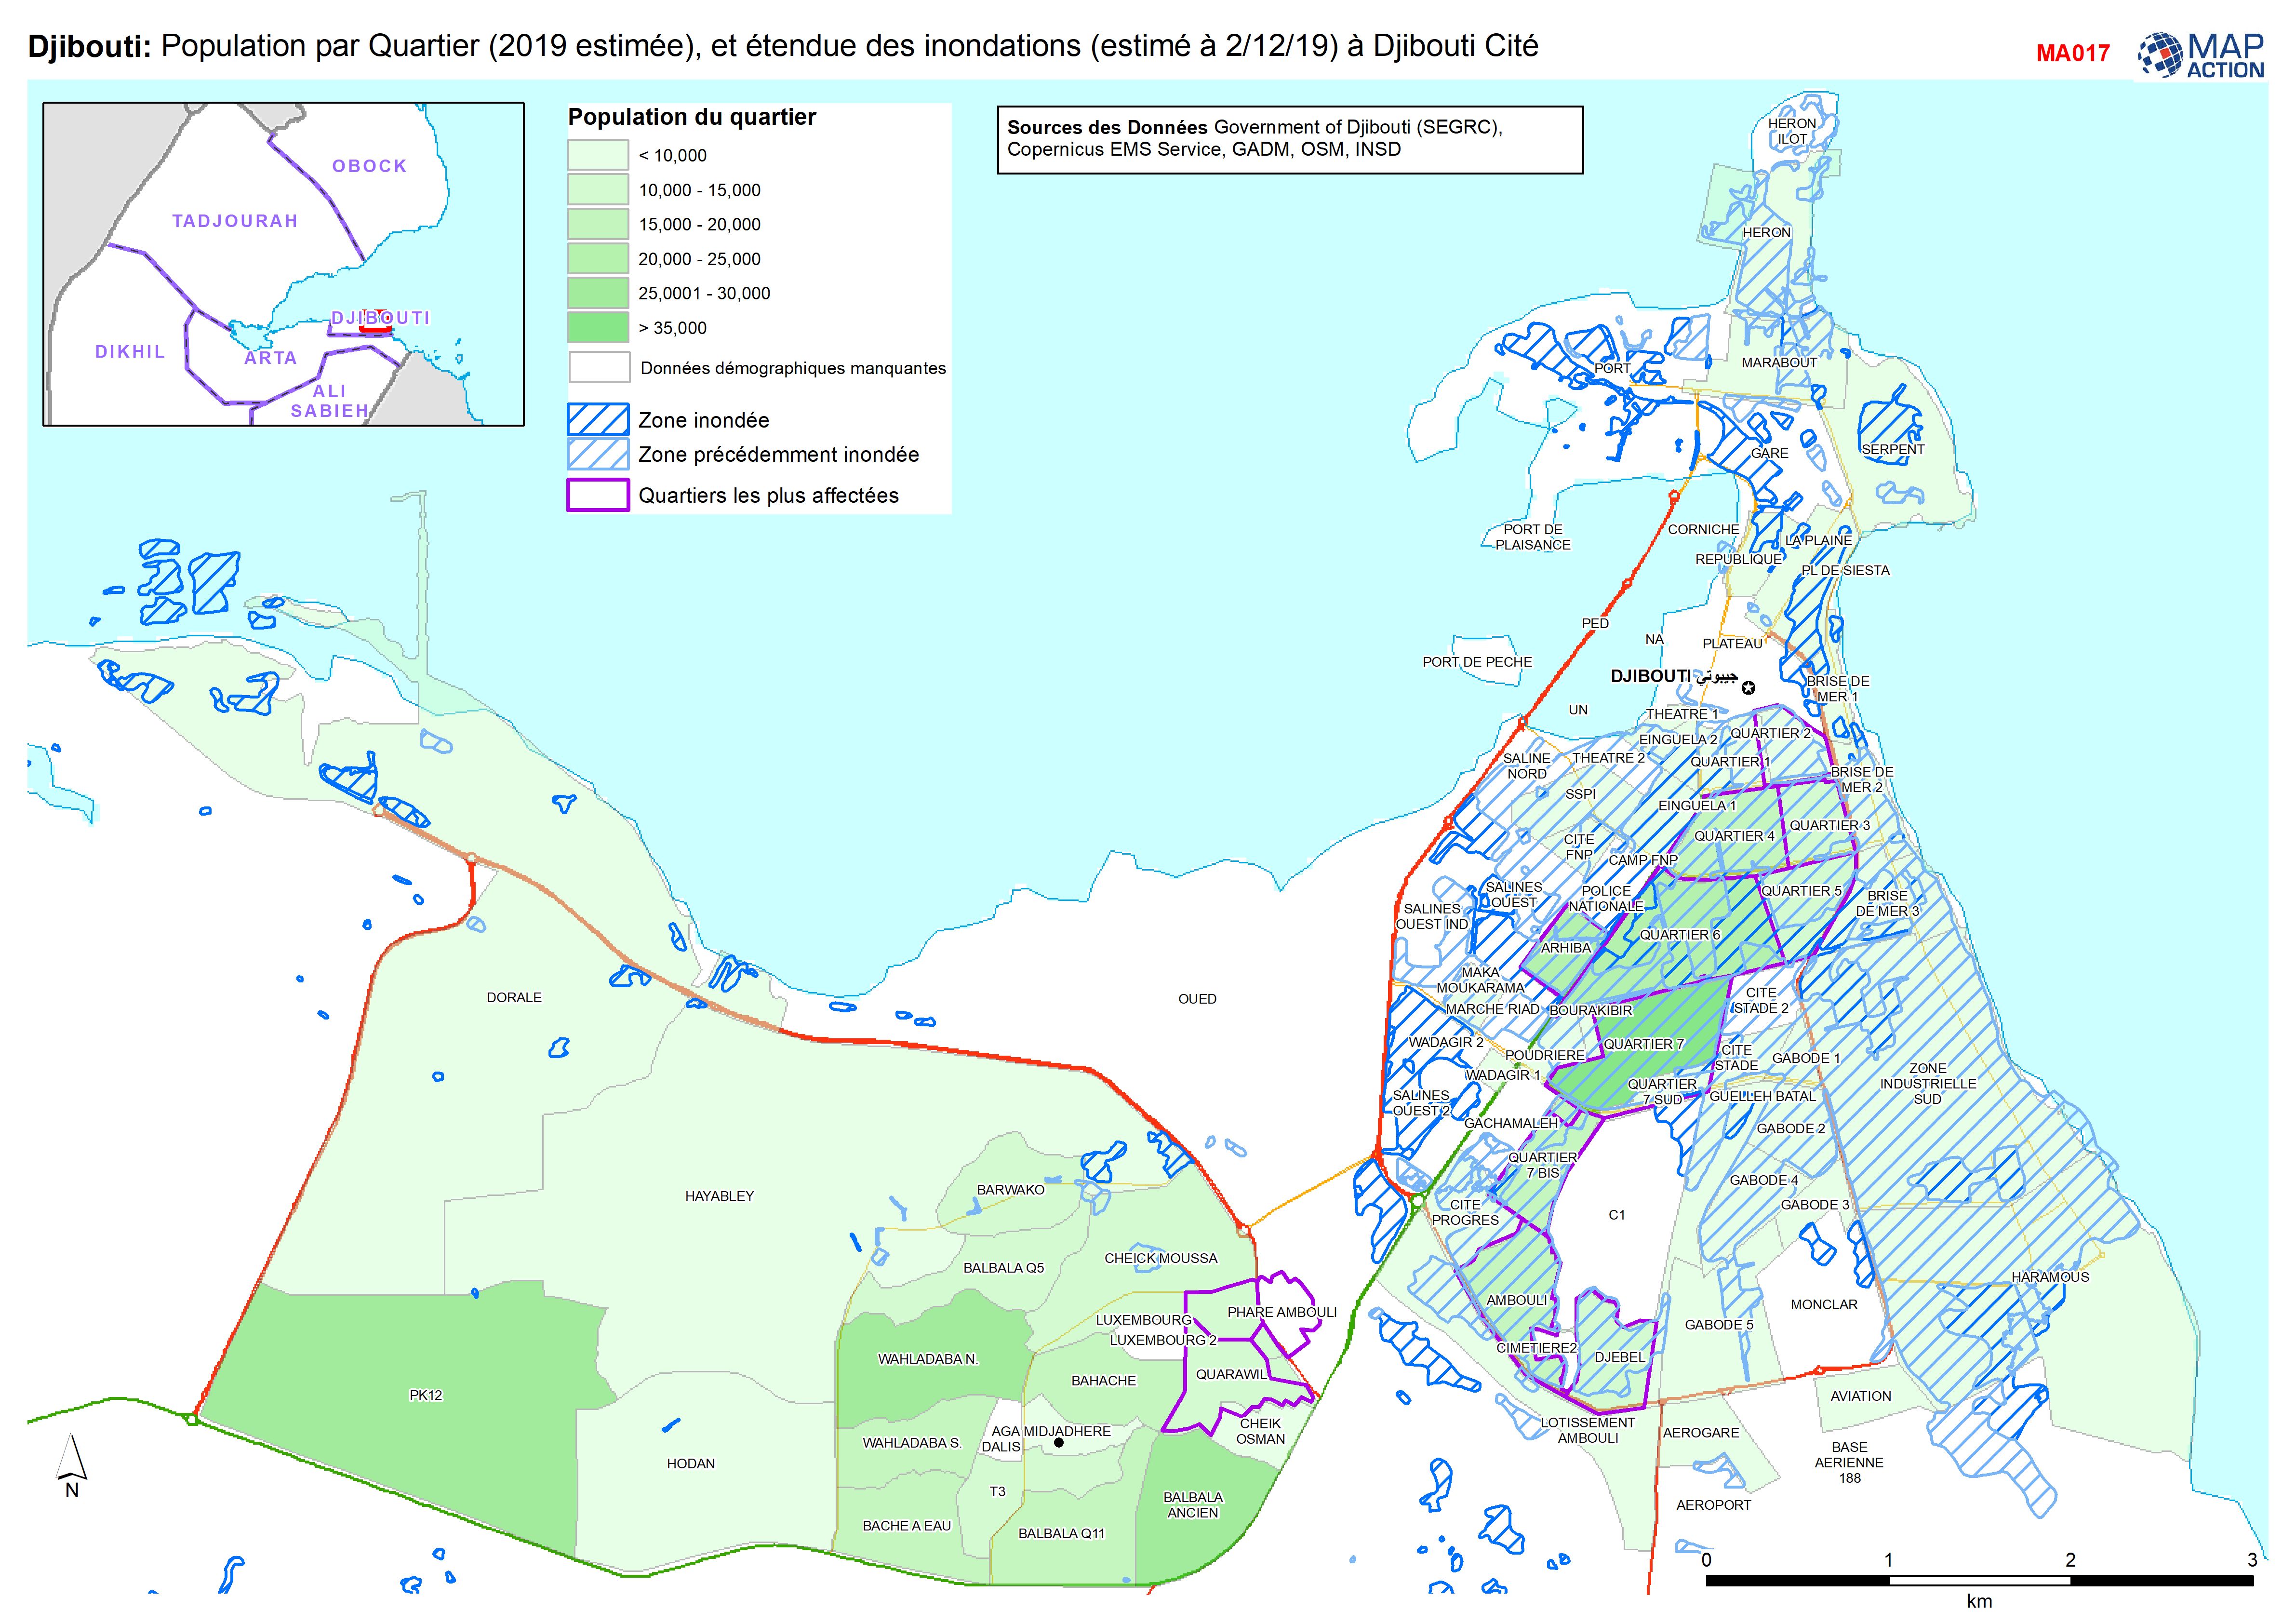
Djibouti: Population par Quartier (2019 estimée), et étendue des inondations ...
Population par Quartier (2019, estimée), et étendue des inondations (estimé à 2/12/19) à Djibouti Cité -

Djibouti: Inondation: Projection de la population pour 2015 par niveaux Admin...
Population totals projected forward from 2009 census to 2015 for Admin Level 1 (District/Region) and Admin Level 2 (Prefecture, Sous Prefecture and Ville). Note Admin 1 totals... -
The Bahamas: Population of settlements based on 2010 Census and Geonames
Population of Abaco and Grand Bahama based on 2010 census