-

Storm path tropical cyclone Mocha (as of 15 May 2023) with baseline populatio...
Storm path as reported by Joint Typhoon Warning Centre. Population totals in table are 2022 estimates by UNFPA and US Census Bureau (USCB). Baseline population distribution... -

Cumulative Rainfall (1st - 13th March 2023), and affected population. MA019
Southern Region: Total Rainfall (1st - 15th March 2023), and affected population per Traditional Authority -

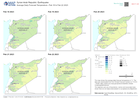
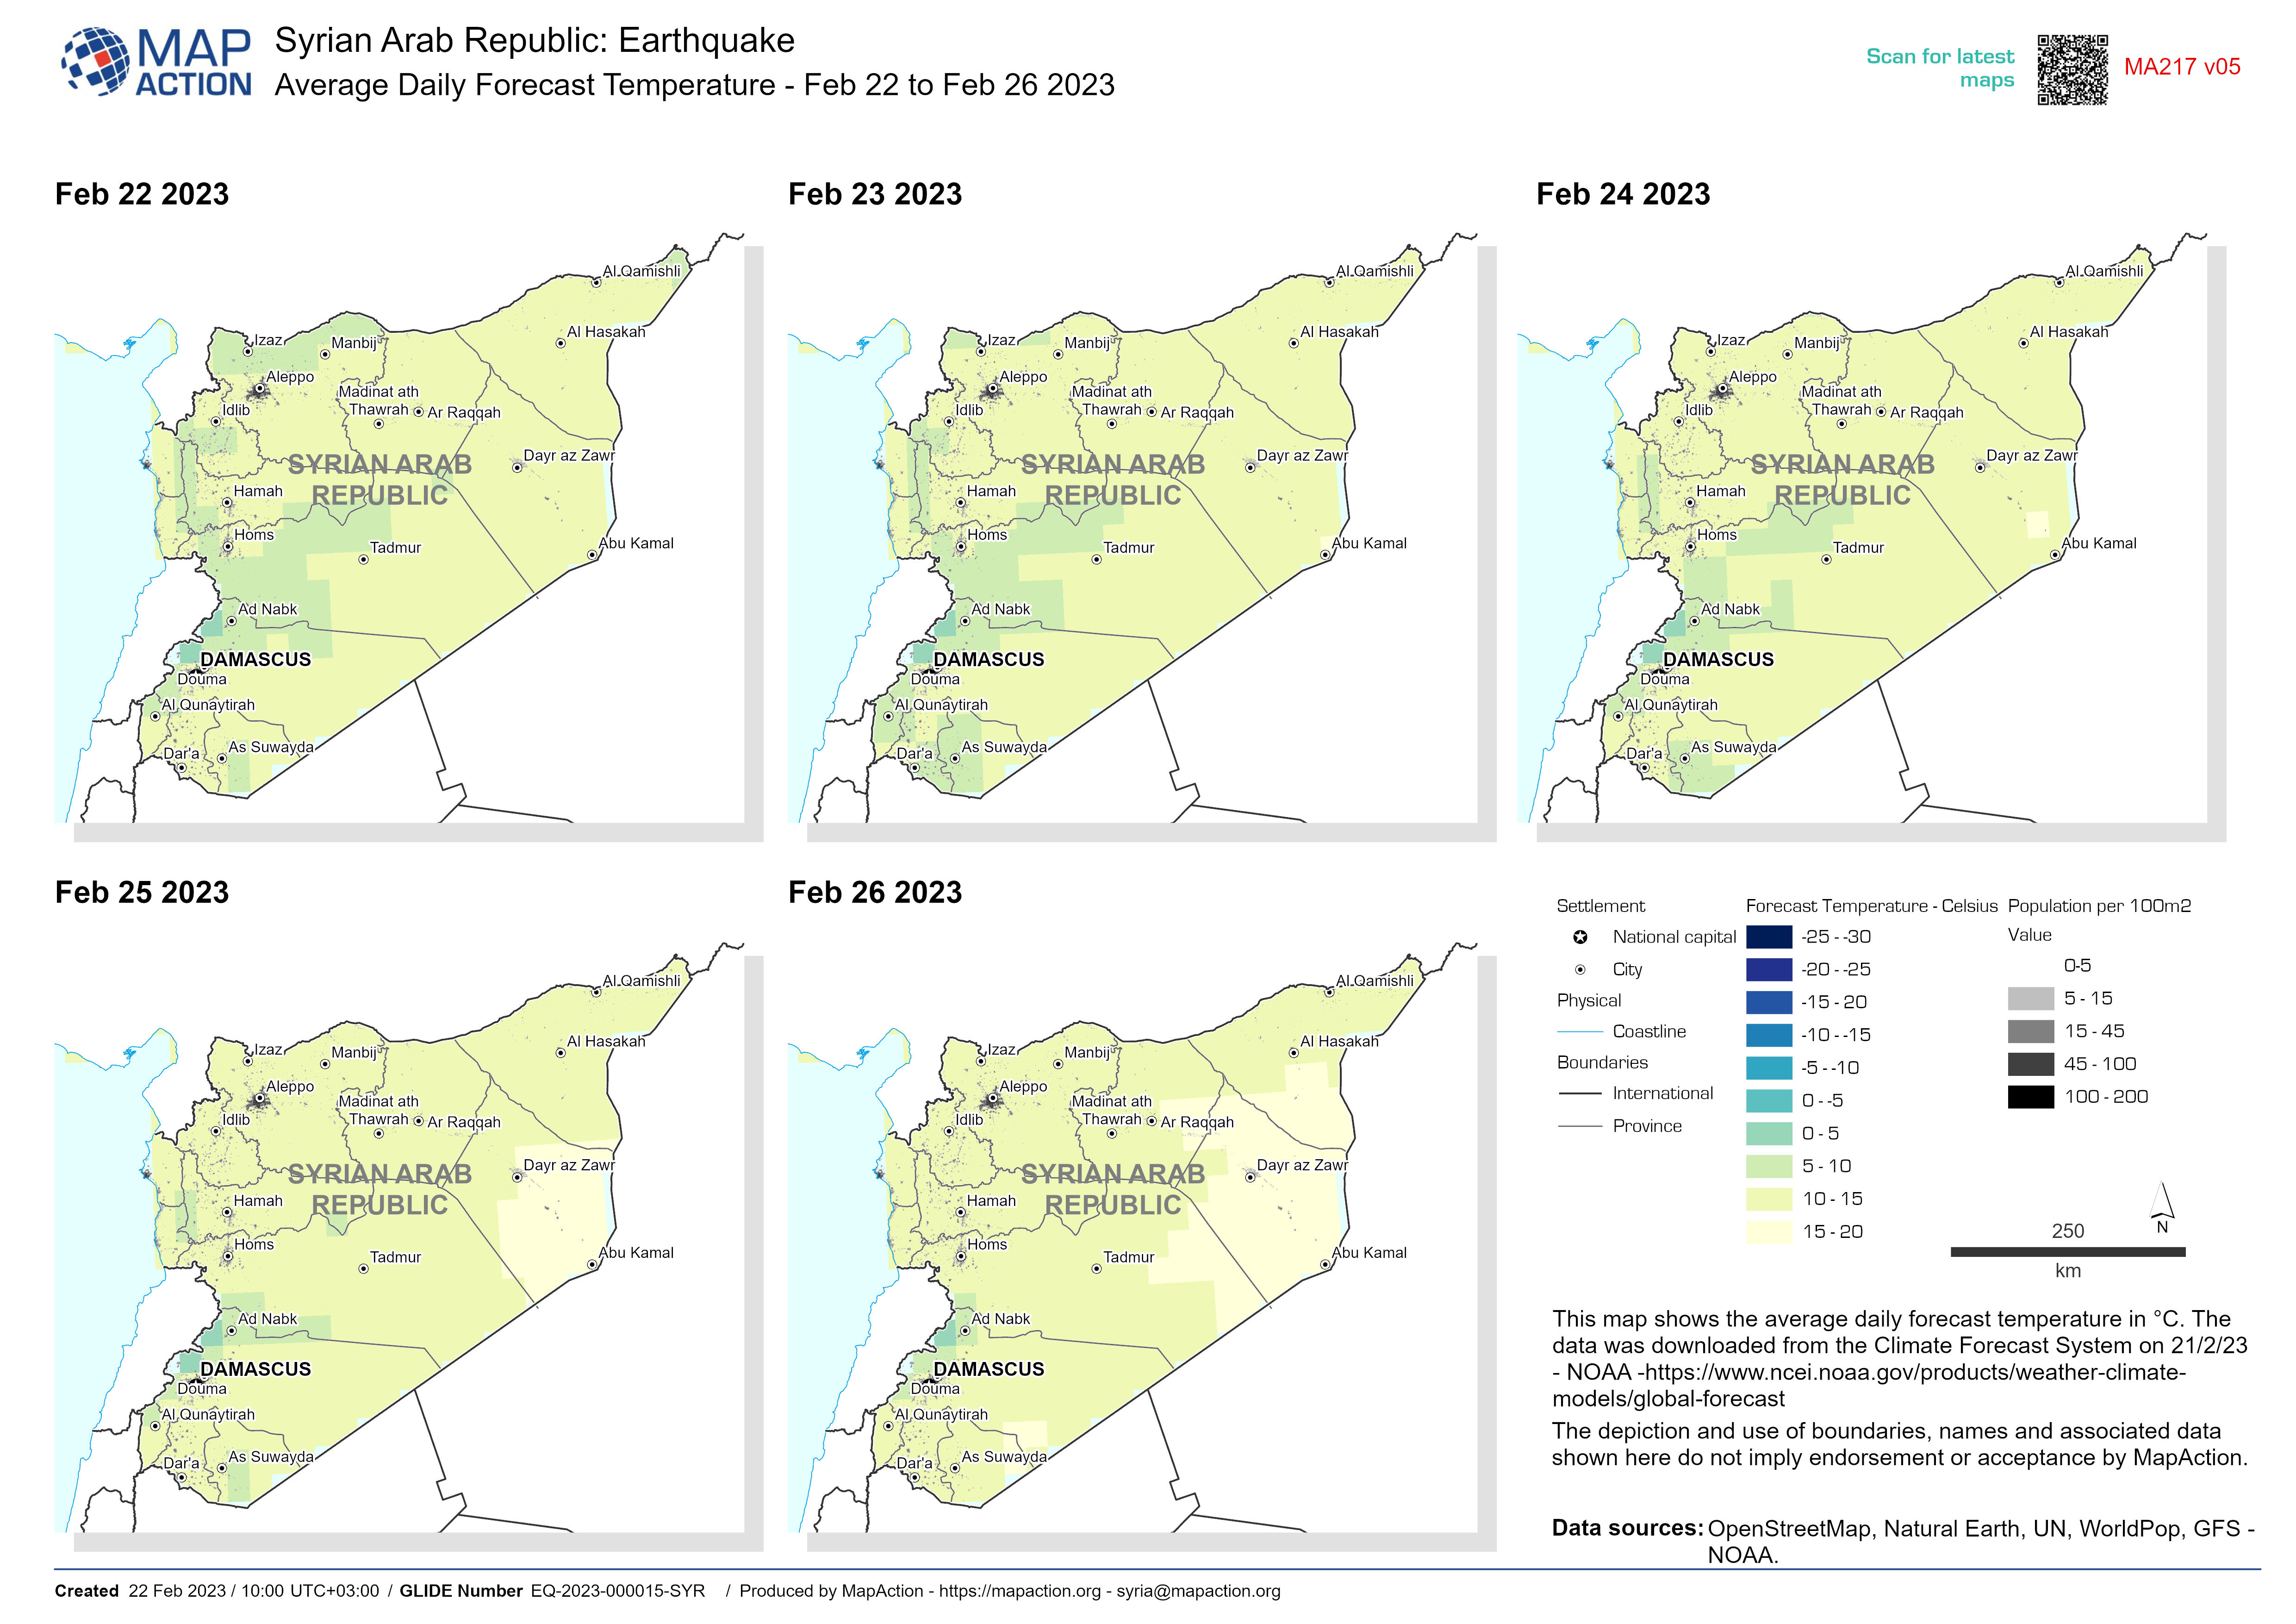
Average Daily Forecast Temperature - Feb 22 to Feb 26 2023
This map shows the average daily forecast temperature in °C. The data was downloaded from the Climate Forecast System on 21/2/23 - NOAA... -

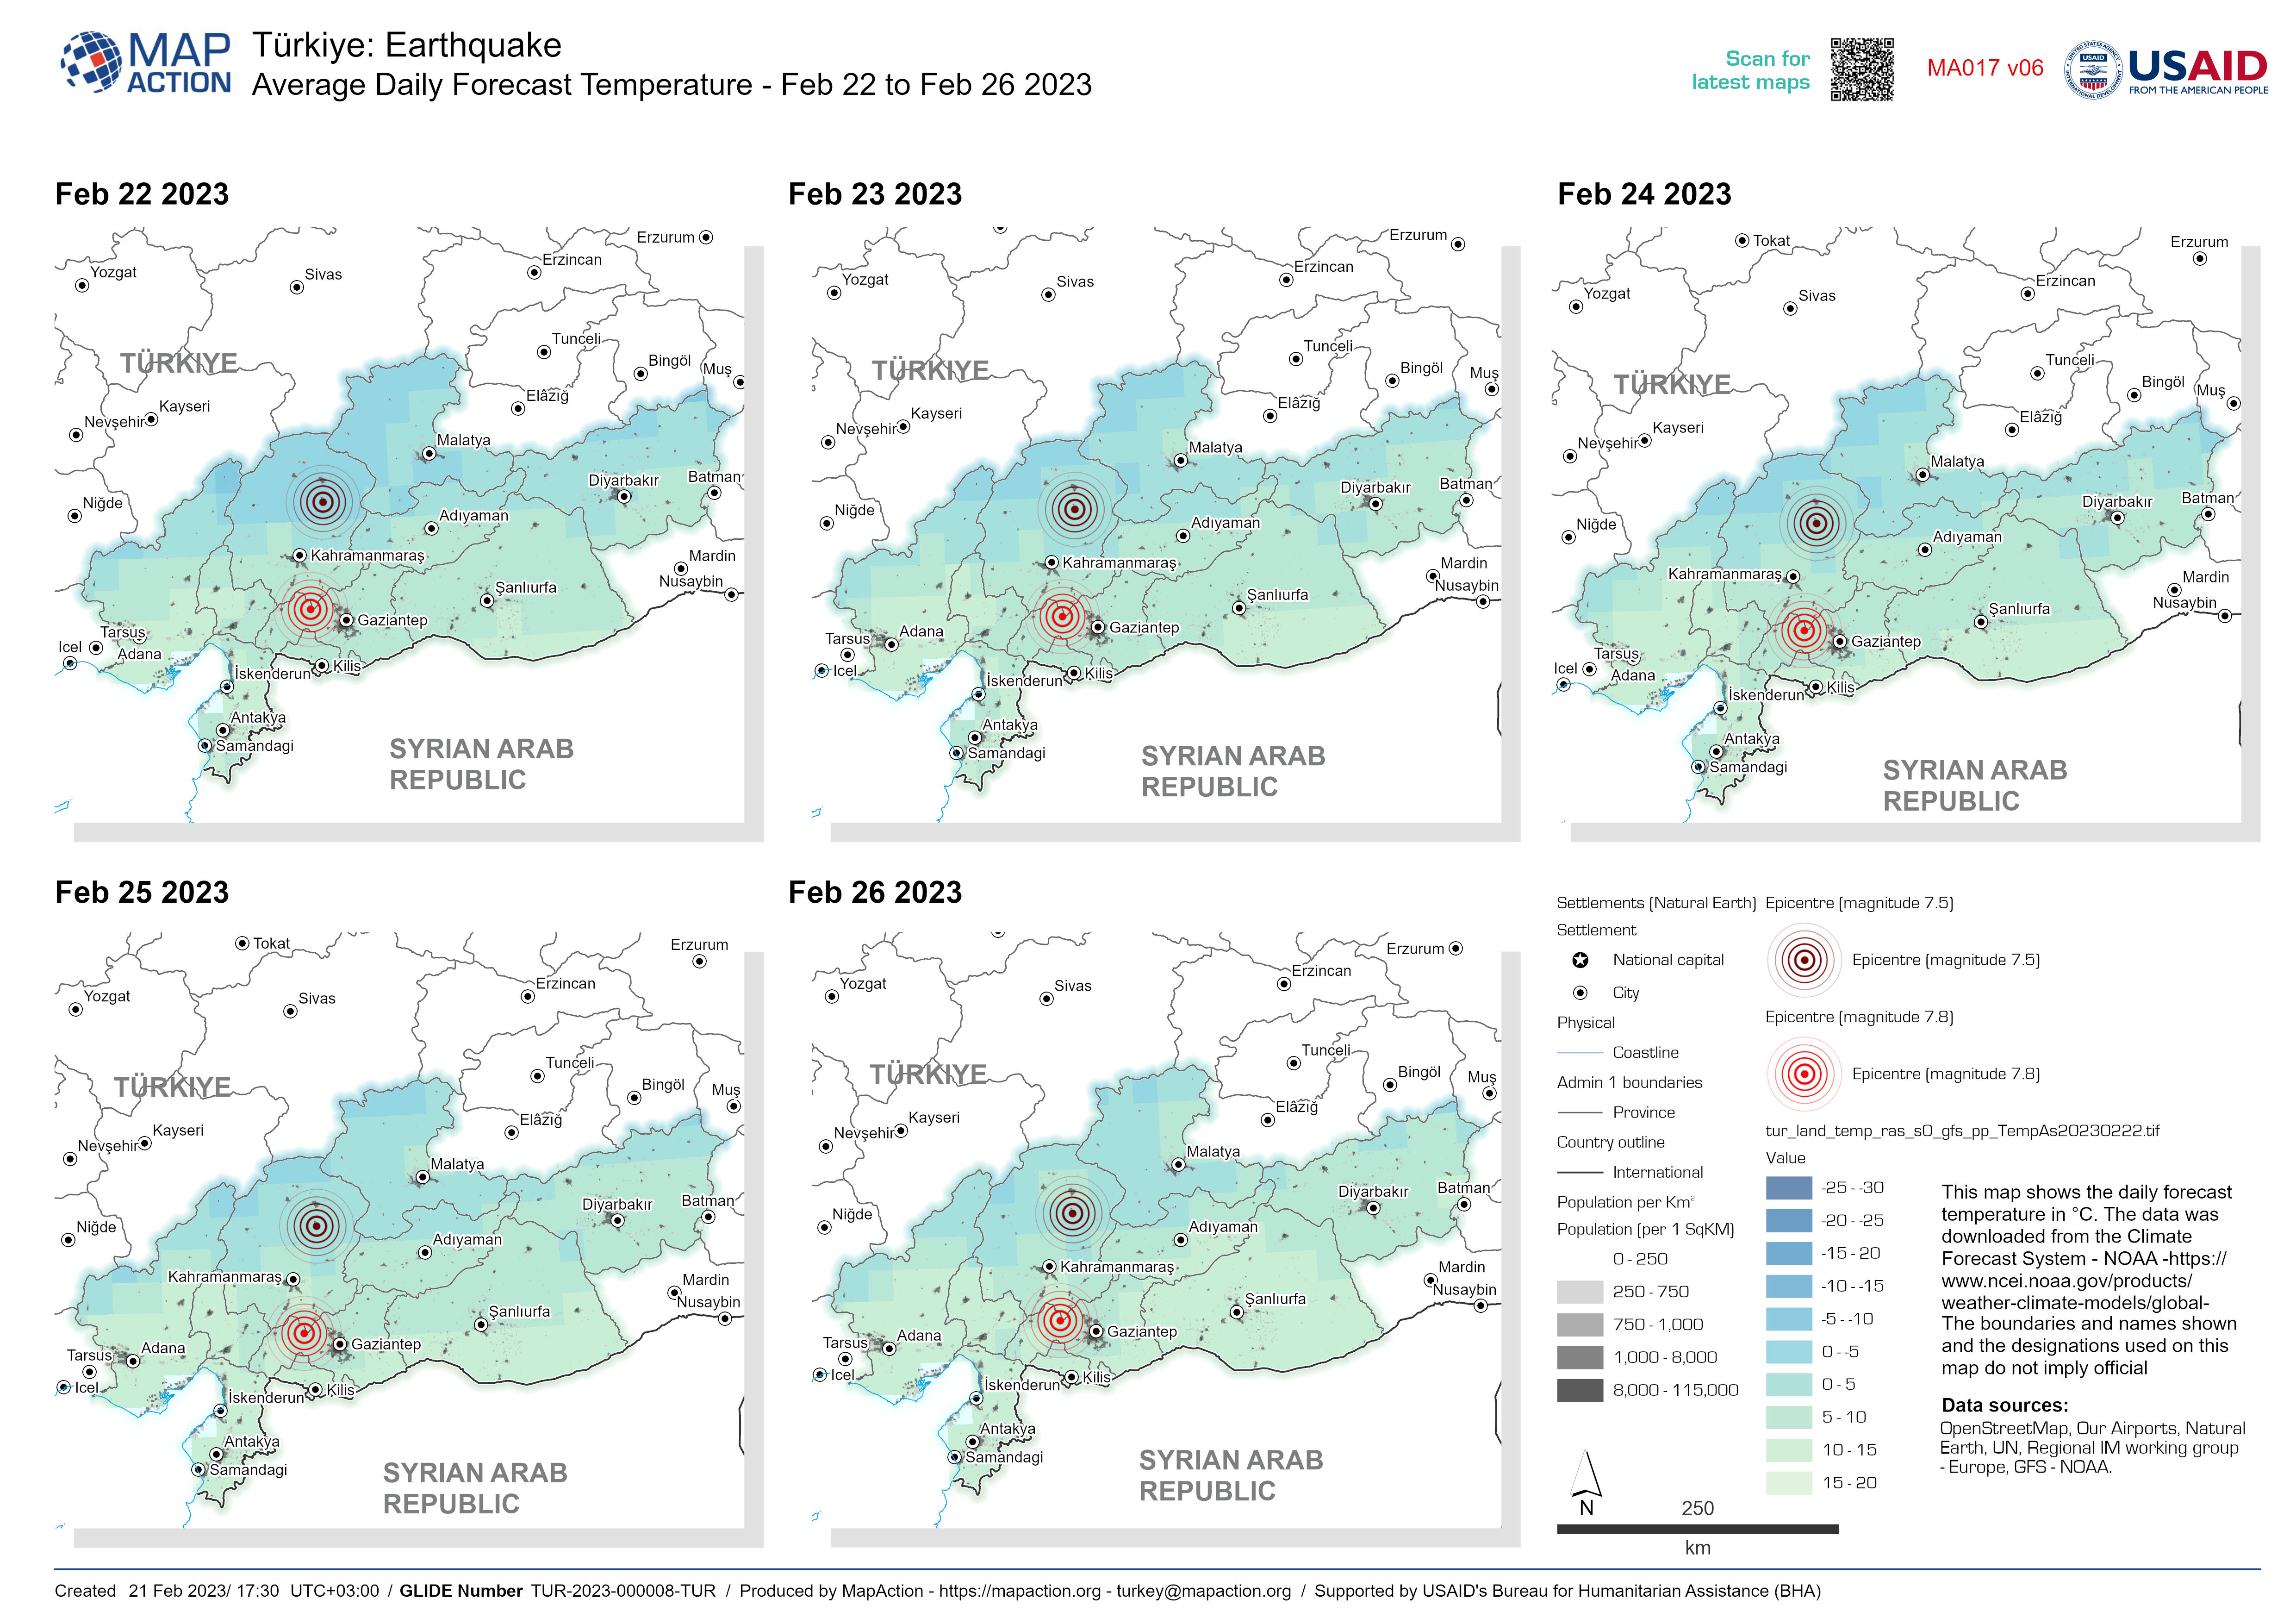
Average Daily Forecast Temperature - Feb 22 to Feb 26 2023
This map shows the daily forecast temperature in °C. The data was downloaded from the Climate Forecast System - NOAA... -
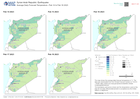
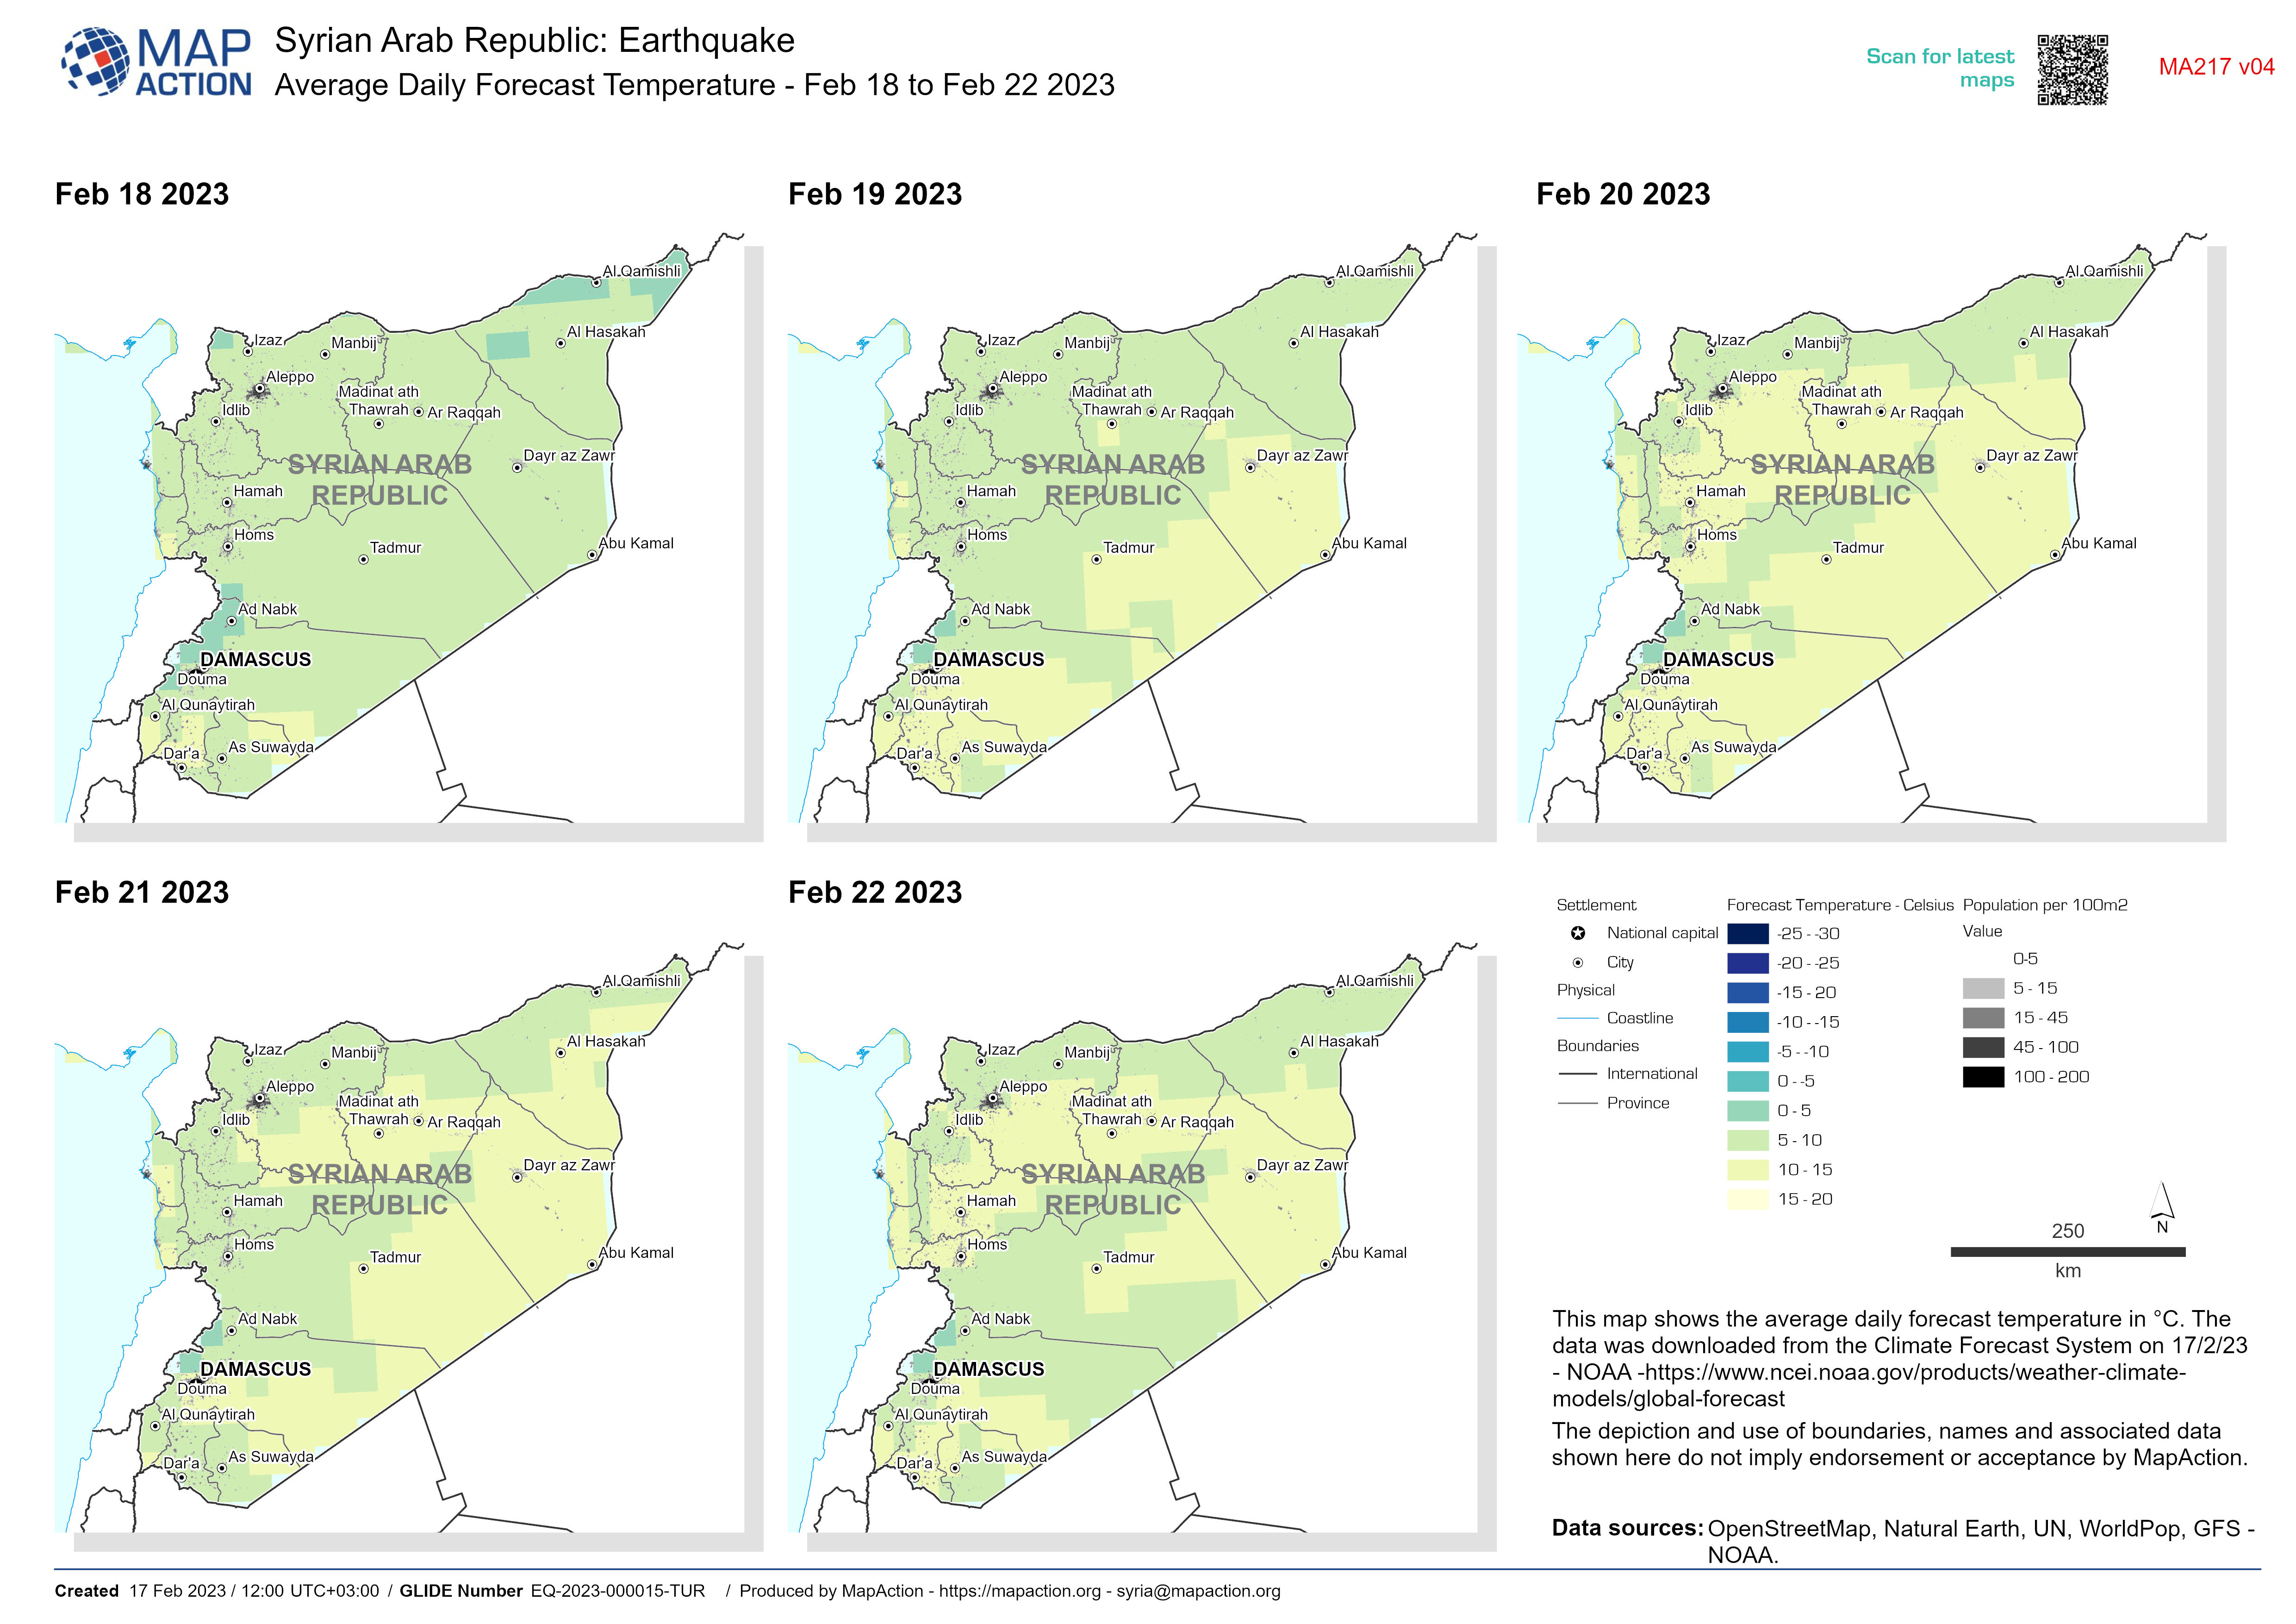
Average Daily Forecast Temperature - Feb 18 to Feb 22 2023
This map shows the average daily forecast temperature in °C. The data was downloaded from the Climate Forecast System on 17/2/23 - NOAA... -

Average Daily Forecast Temperature - Feb 18 to Feb 22 2023
This map shows the daily forecast temperature in °C. The data was downloaded from the Climate Forecast System - NOAA... -
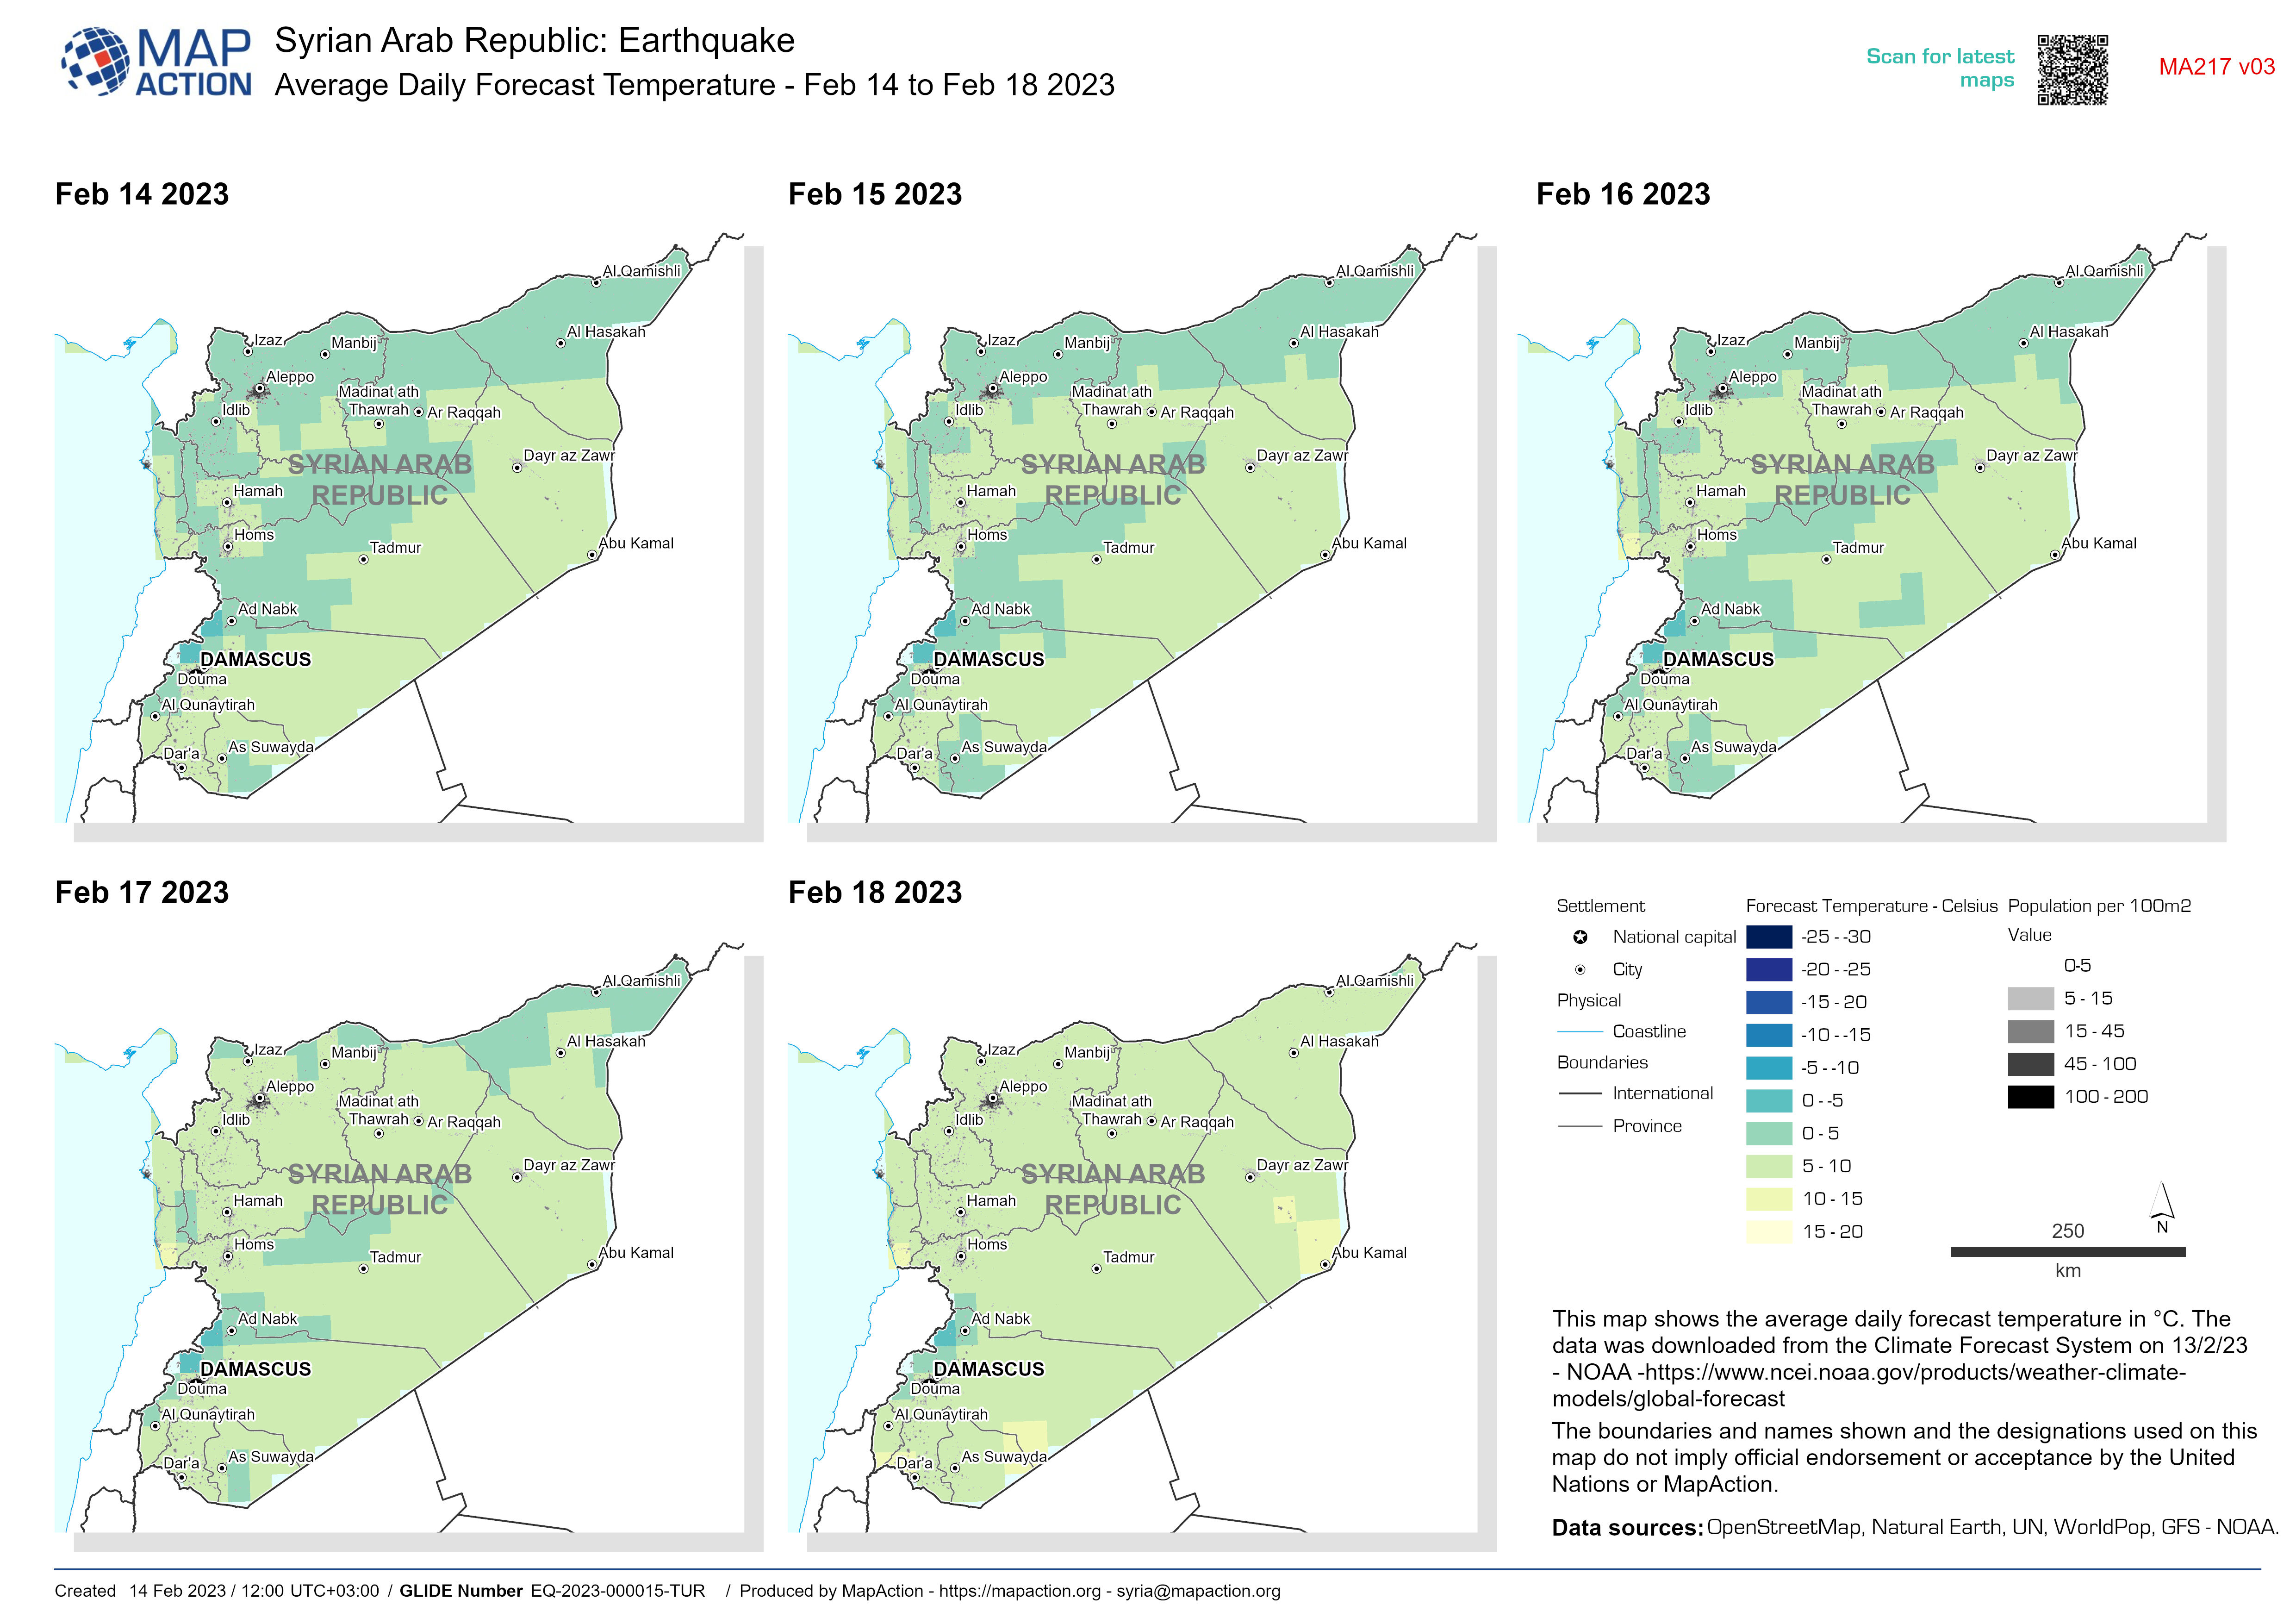
Average Daily Forecast Temperature - Feb 14 to Feb 18 2023
This map shows the average daily forecast temperature in °C. The data was downloaded from the Climate Forecast System on 13/2/23 - NOAA... -

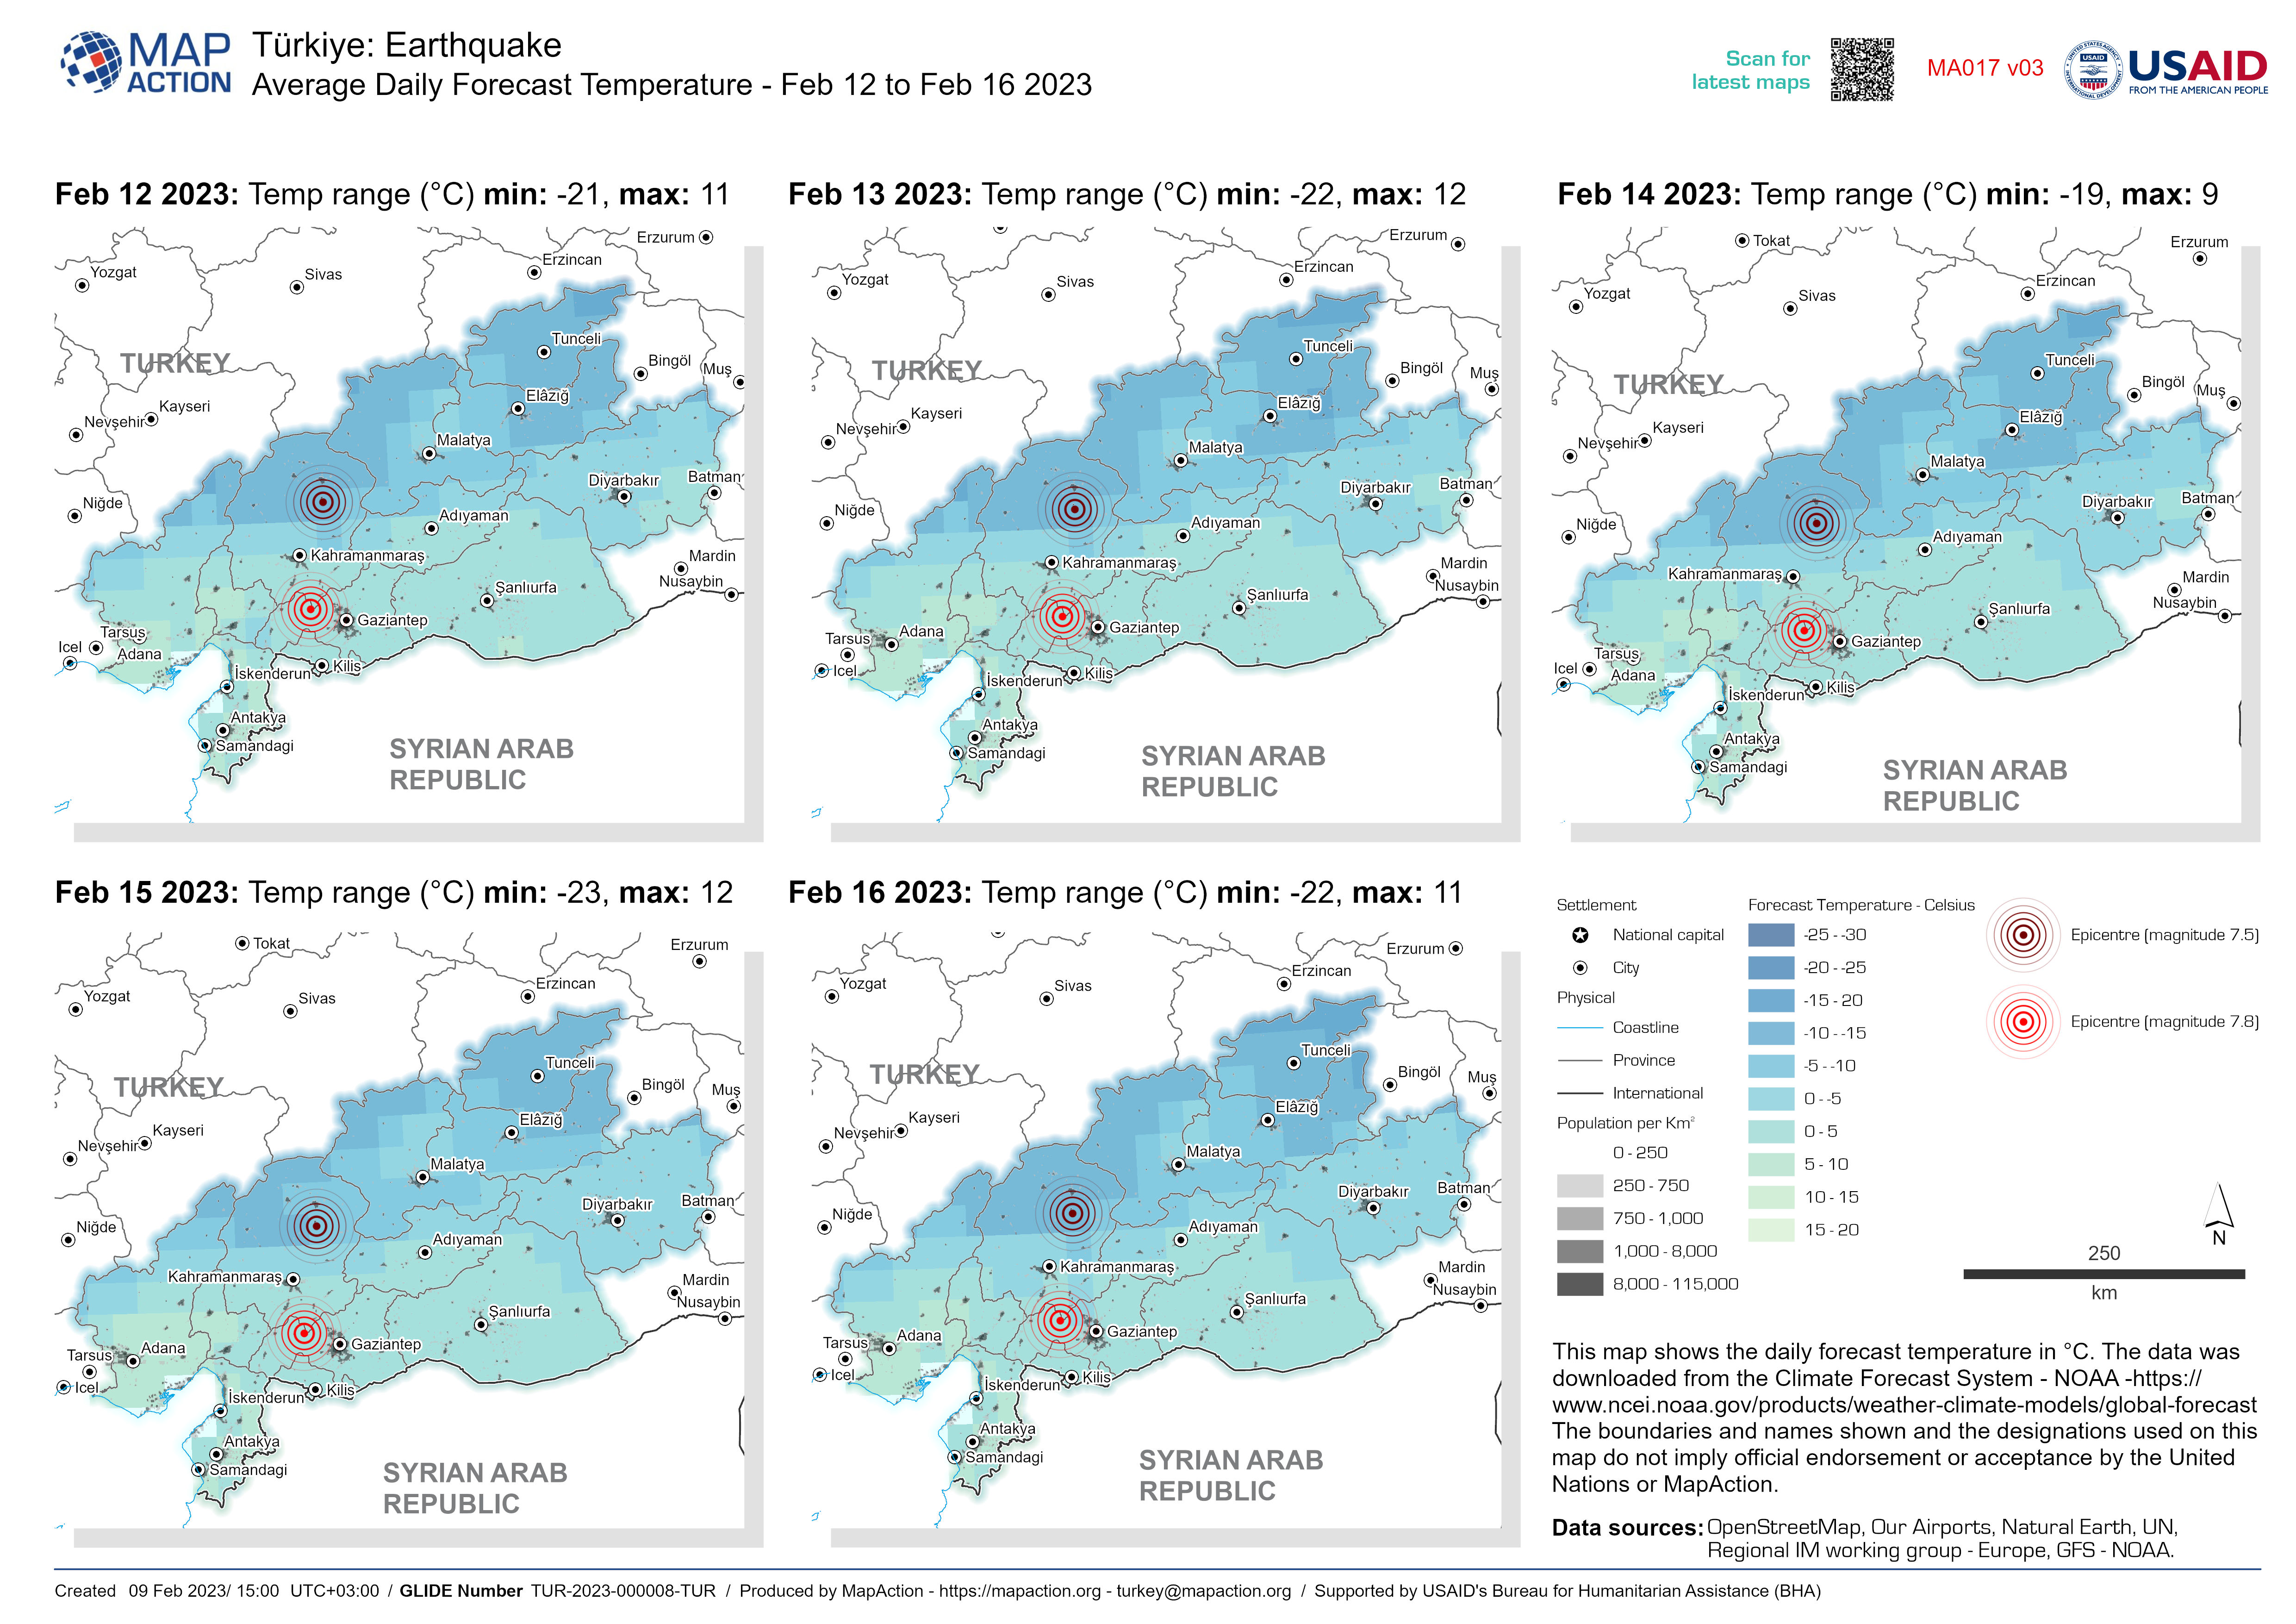
Average Daily Forecast Temperature - Feb 12 to Feb 16 2023
This map shows the daily forecast temperature in °C. The data was downloaded from the Climate Forecast System - NOAA... -

Average Daily Forecast Temperature - Feb 11 to Feb 15 2023
This map shows the daily forecast temperature in °C. The data was downloaded from the Climate Forecast System - NOAA... -
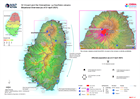
Situational Overview (as of 21 April 2021)
Map shows the situational overview of the current events and activities as a result of the ongoing eruption of the La Soufrière volcano. -

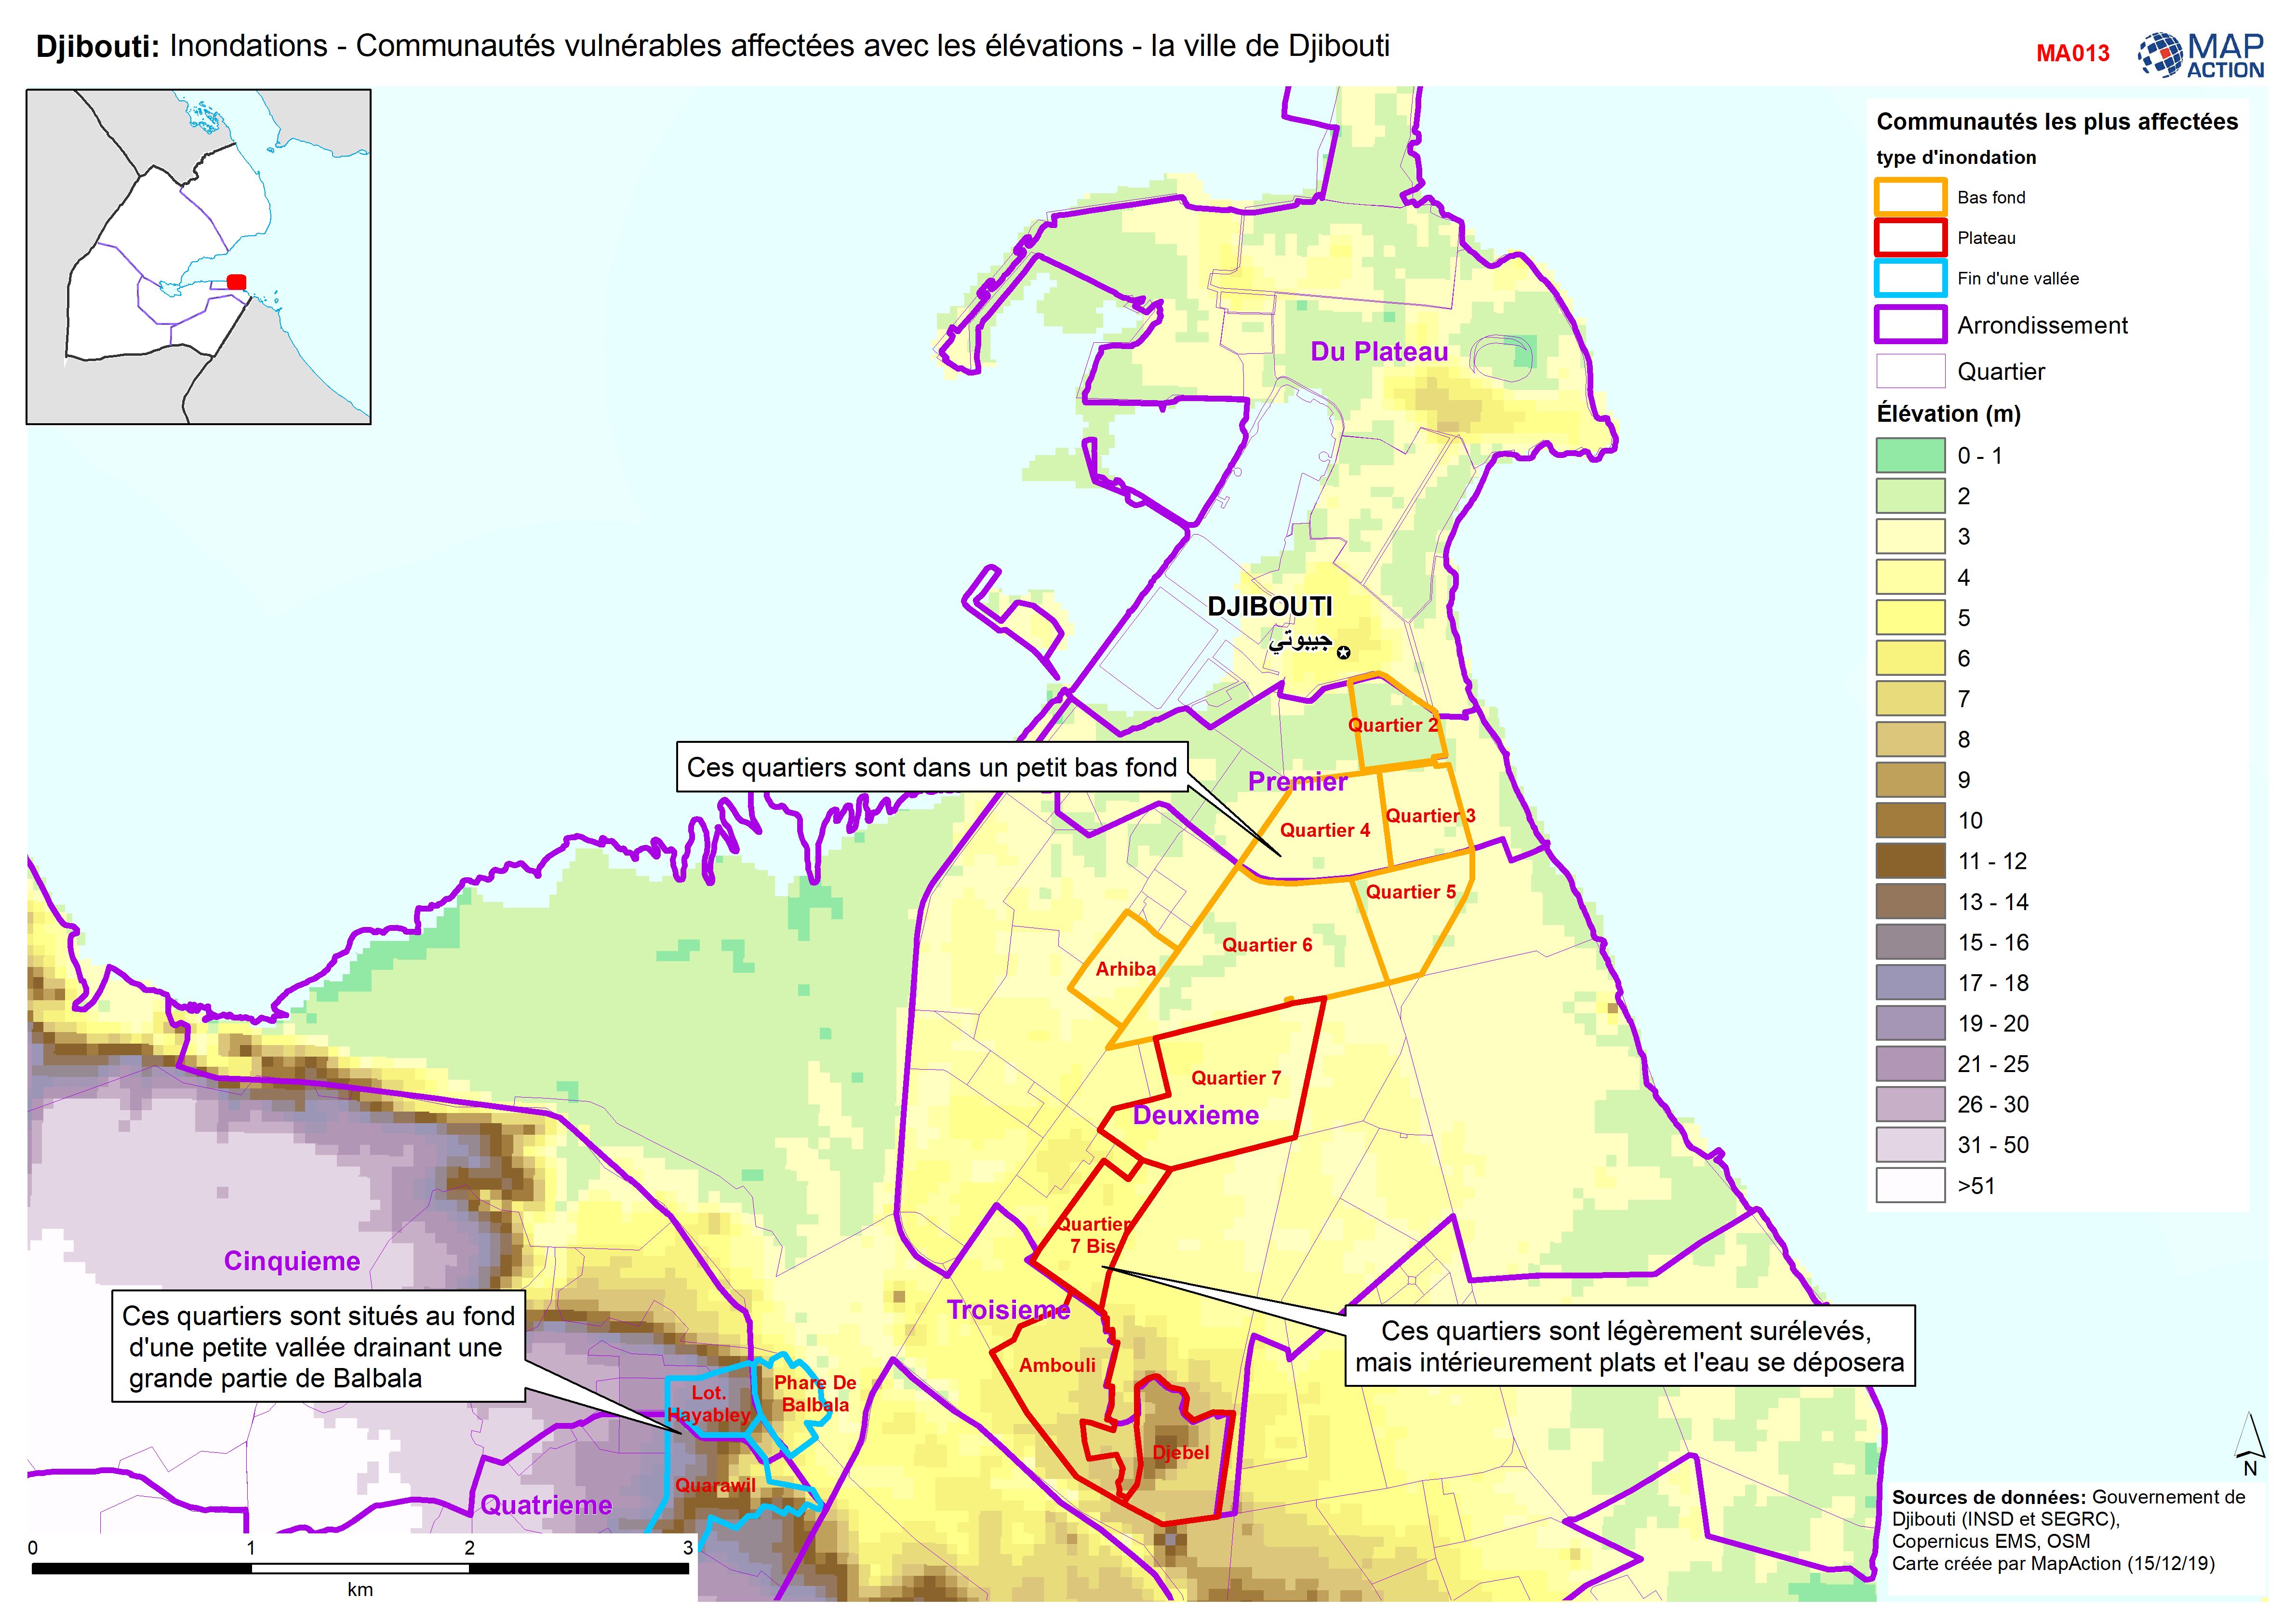
Djibouti: Inondations - Communautés vulnérables affectées avec les élévations...
Djibouti City - Map shows the most affected flooded communities, containing the most vulnerable populations, alongside elevation data to demonstrate the effects of elevation and... -

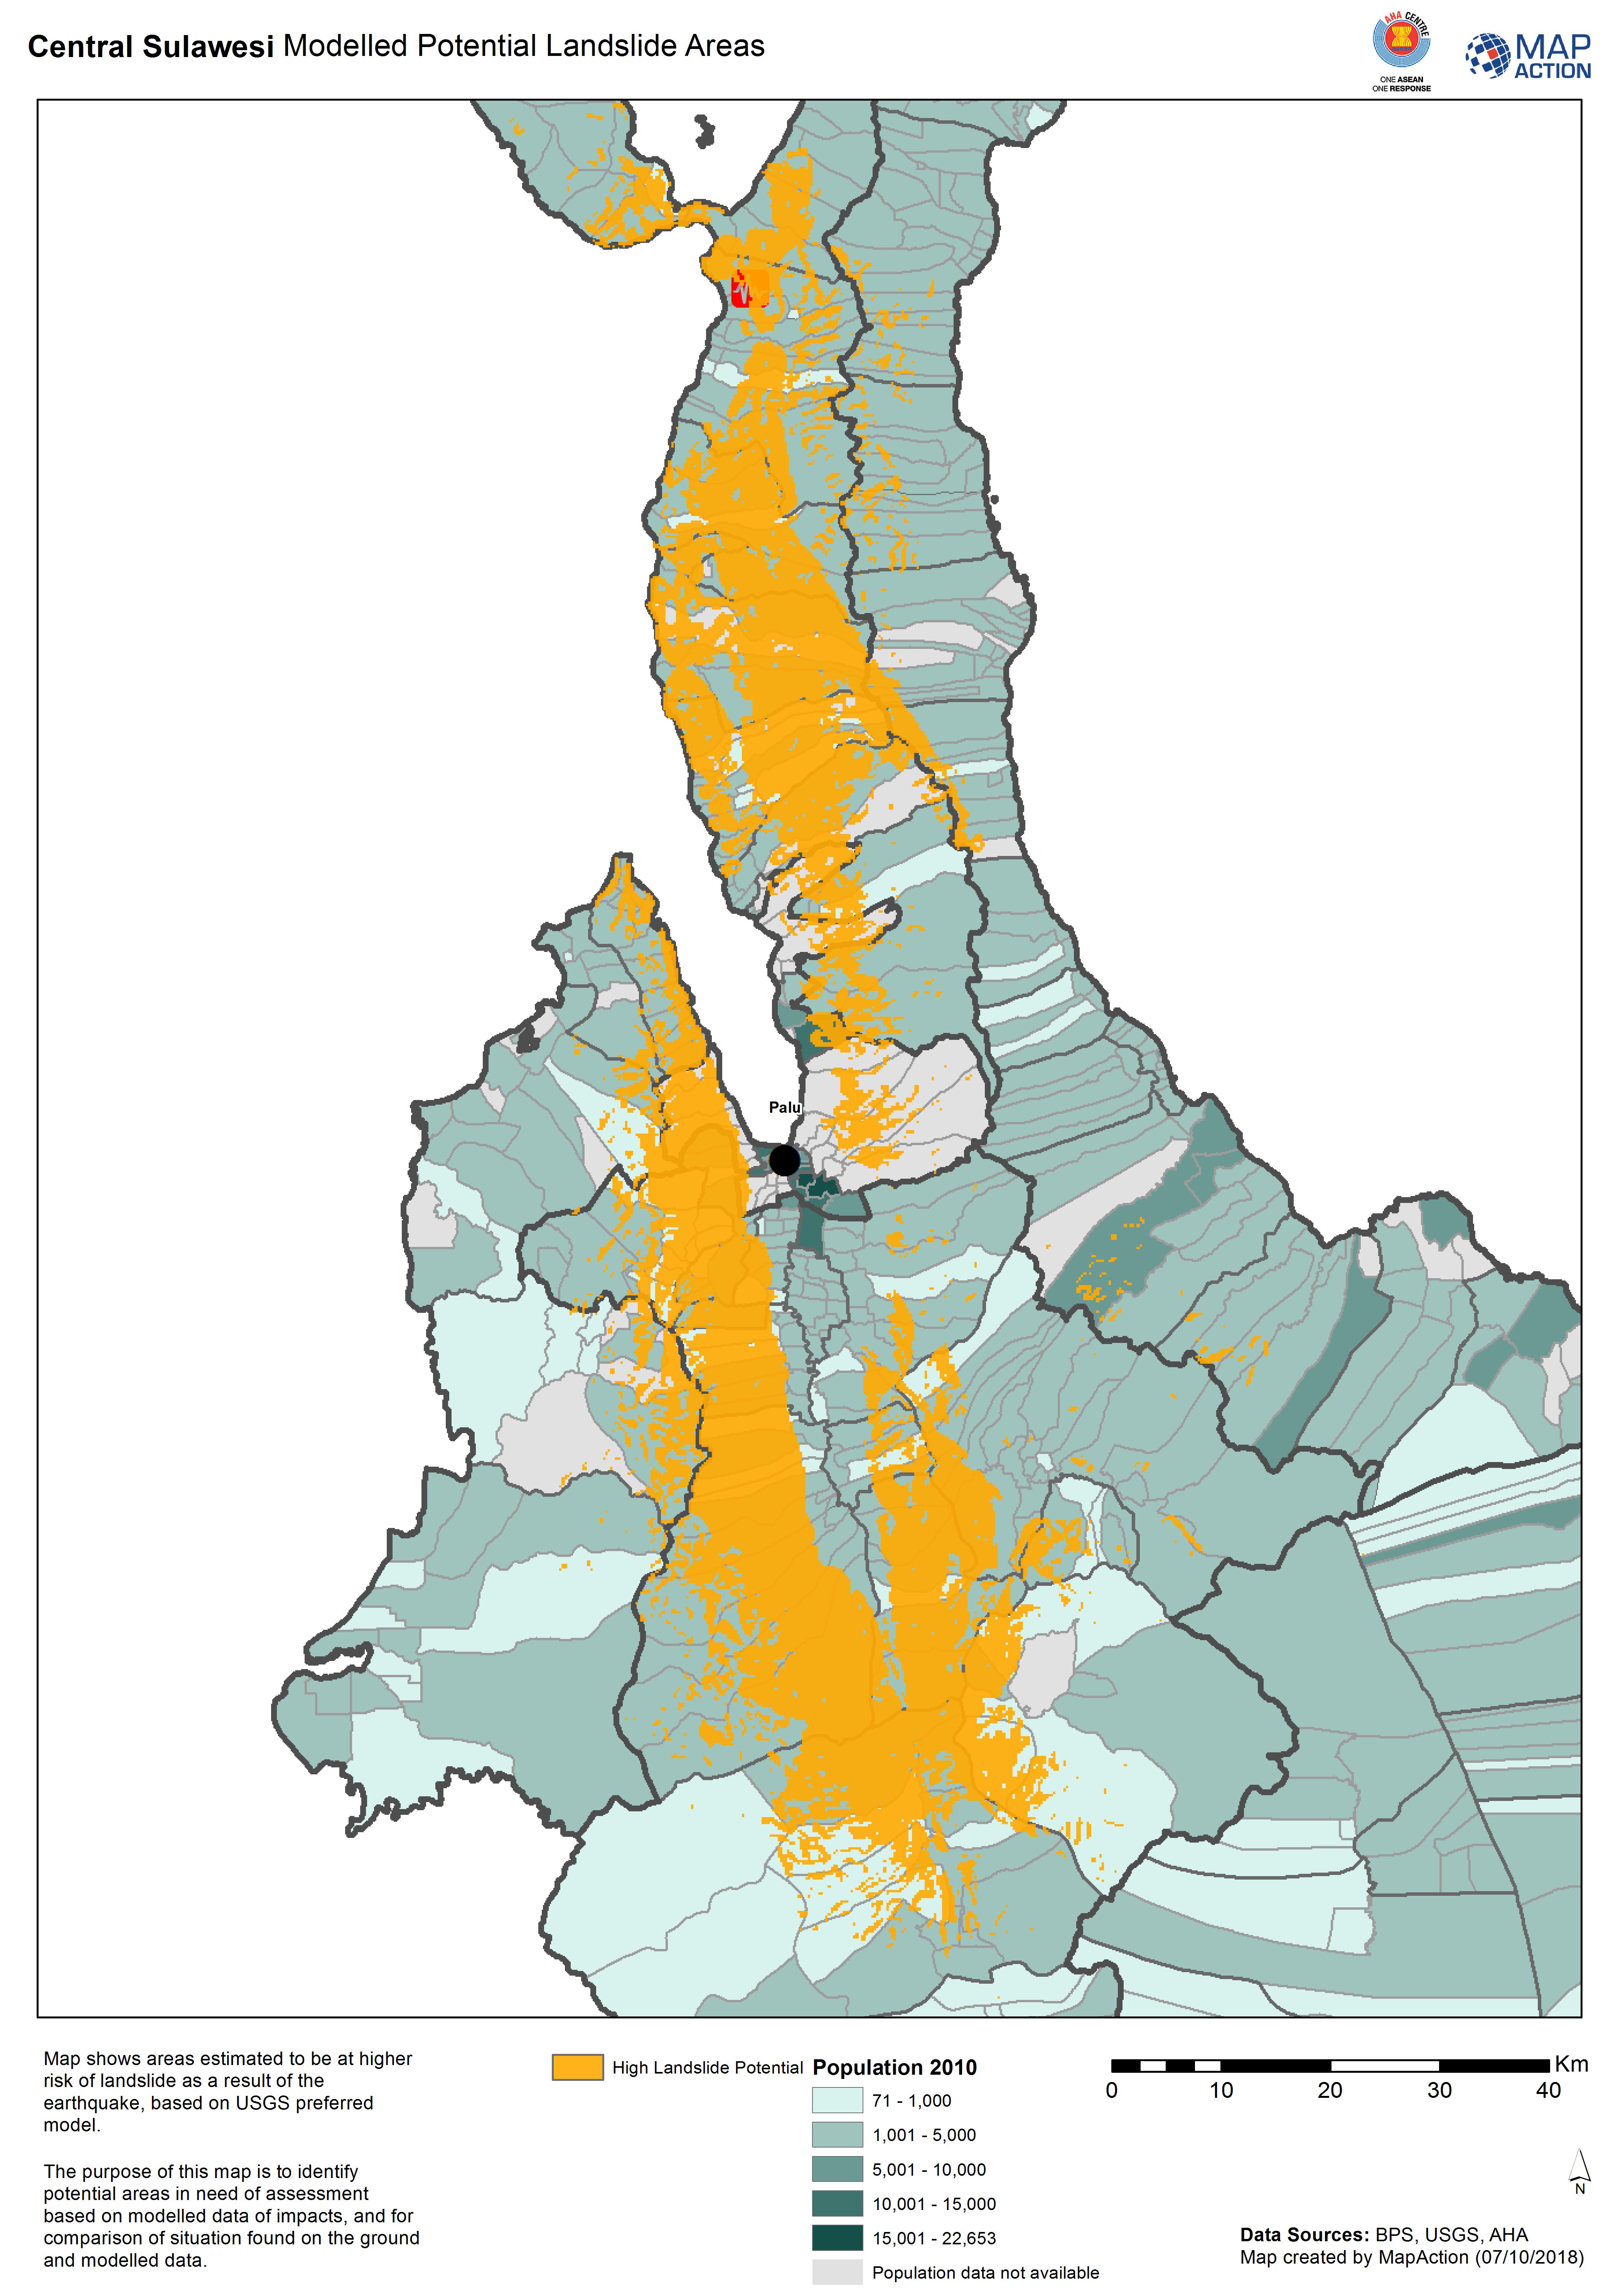
Central Sulawesi Modelled Potential Landslide Areas
Map shows areas estimated to be at higher risk of landslide as aresult of the earthquake, based on USGS preferred model. -

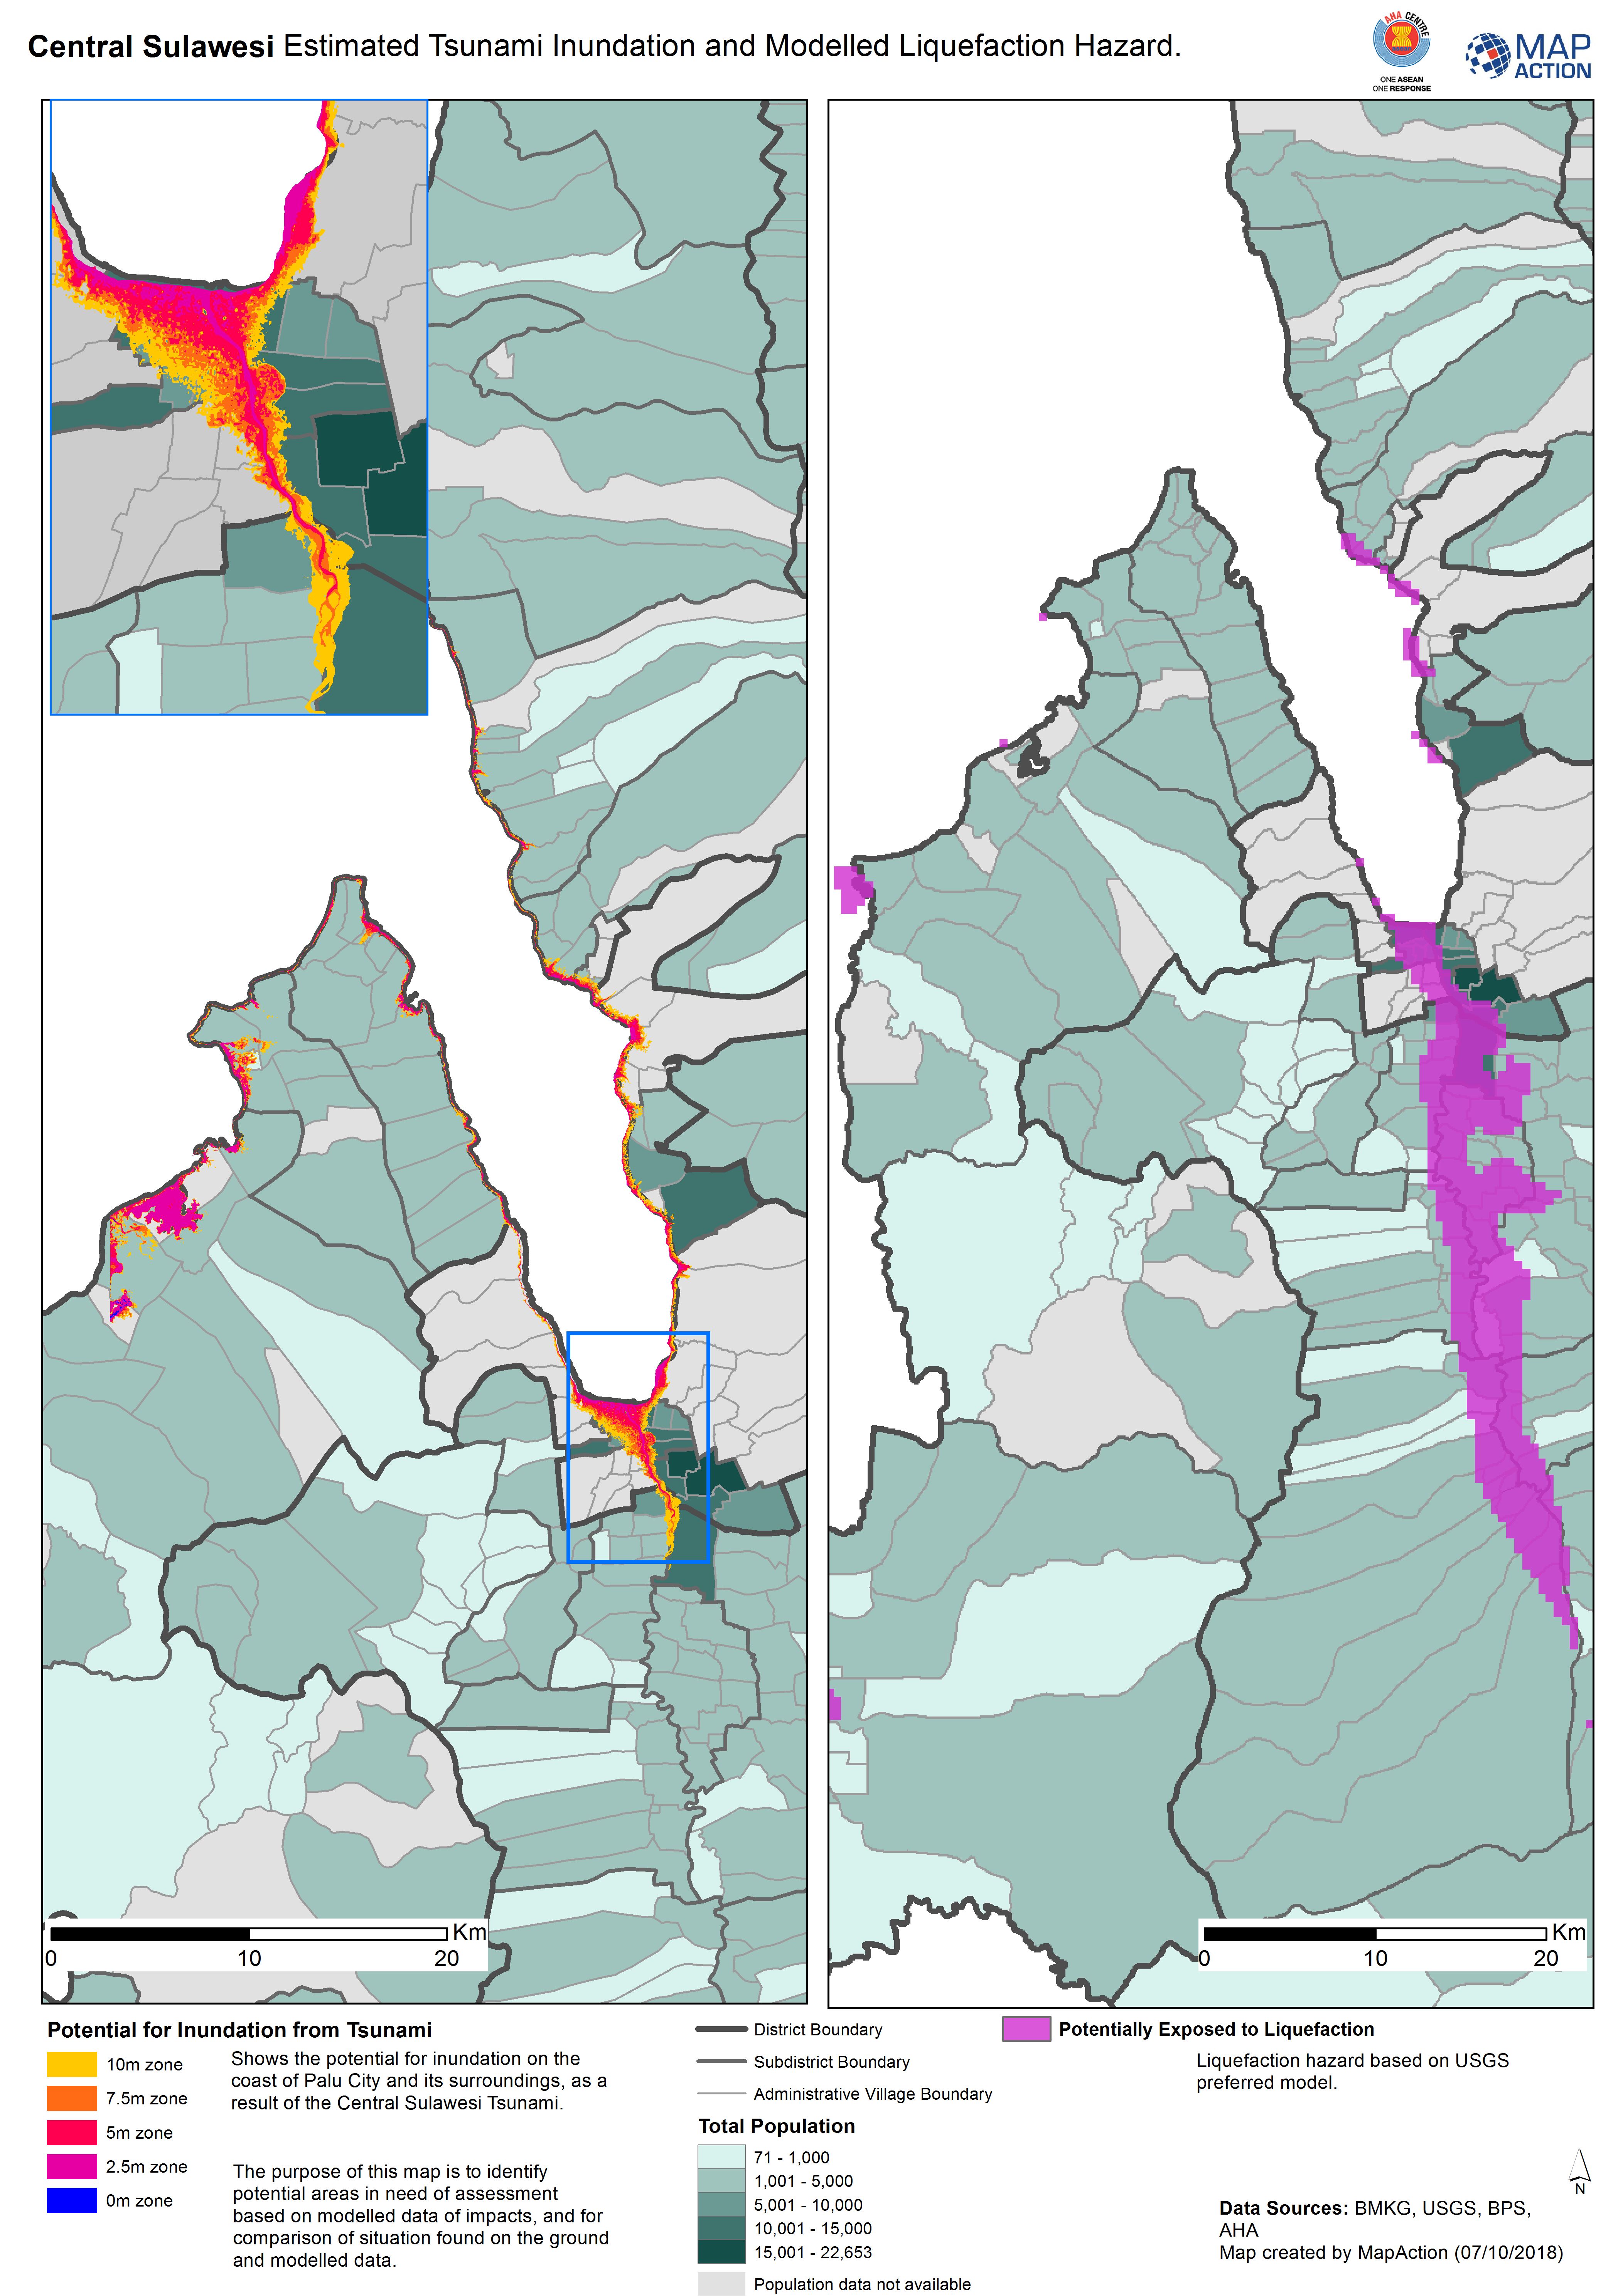
Central Sulawesi Estimated Tsunami Inundation and Modelled Liquefaction Hazard.
Shows the potential for inundation on the coast of Palu City and its surroundings, as a result of the Central Sulawesi Tsunami. The purpose of this map is to identify potential...