-

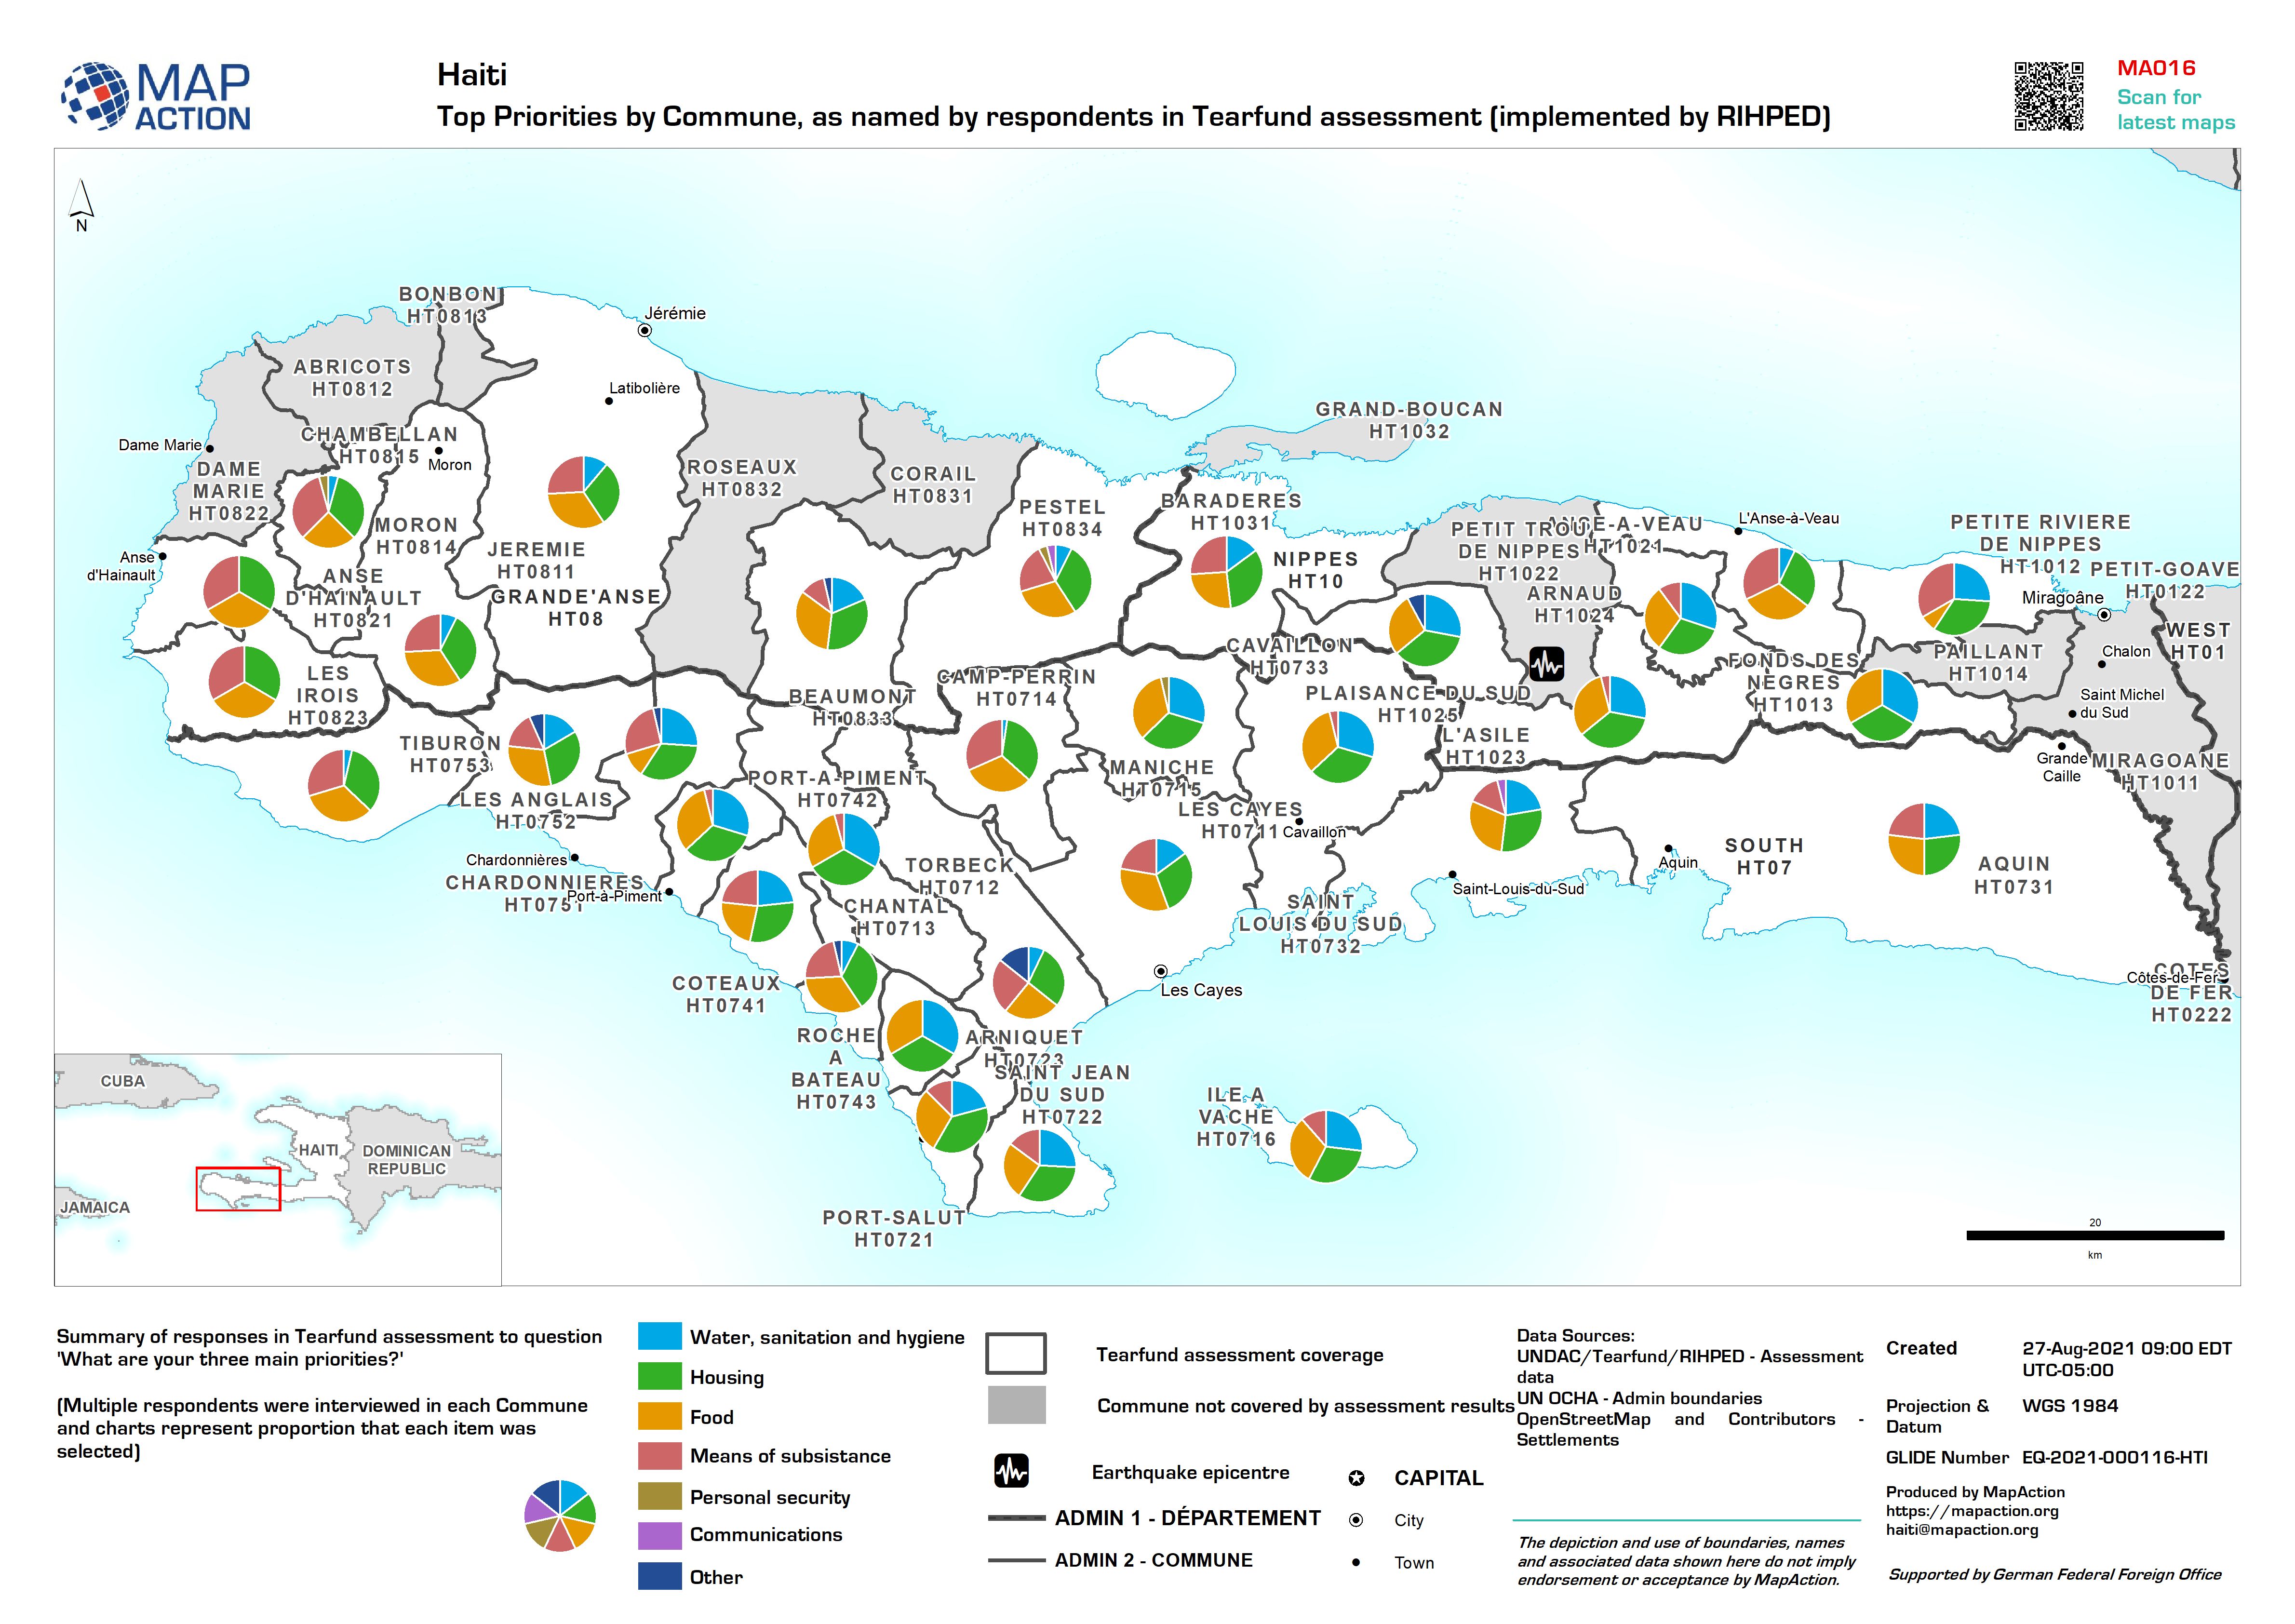
Top Priorities by Commune, as named by respondents in Tearfund assessment (im...
Summary of responses in Tearfund assessment to question 'What are your three main priorities?' (Multiple respondents were interviewed in each Commune and charts represent... -

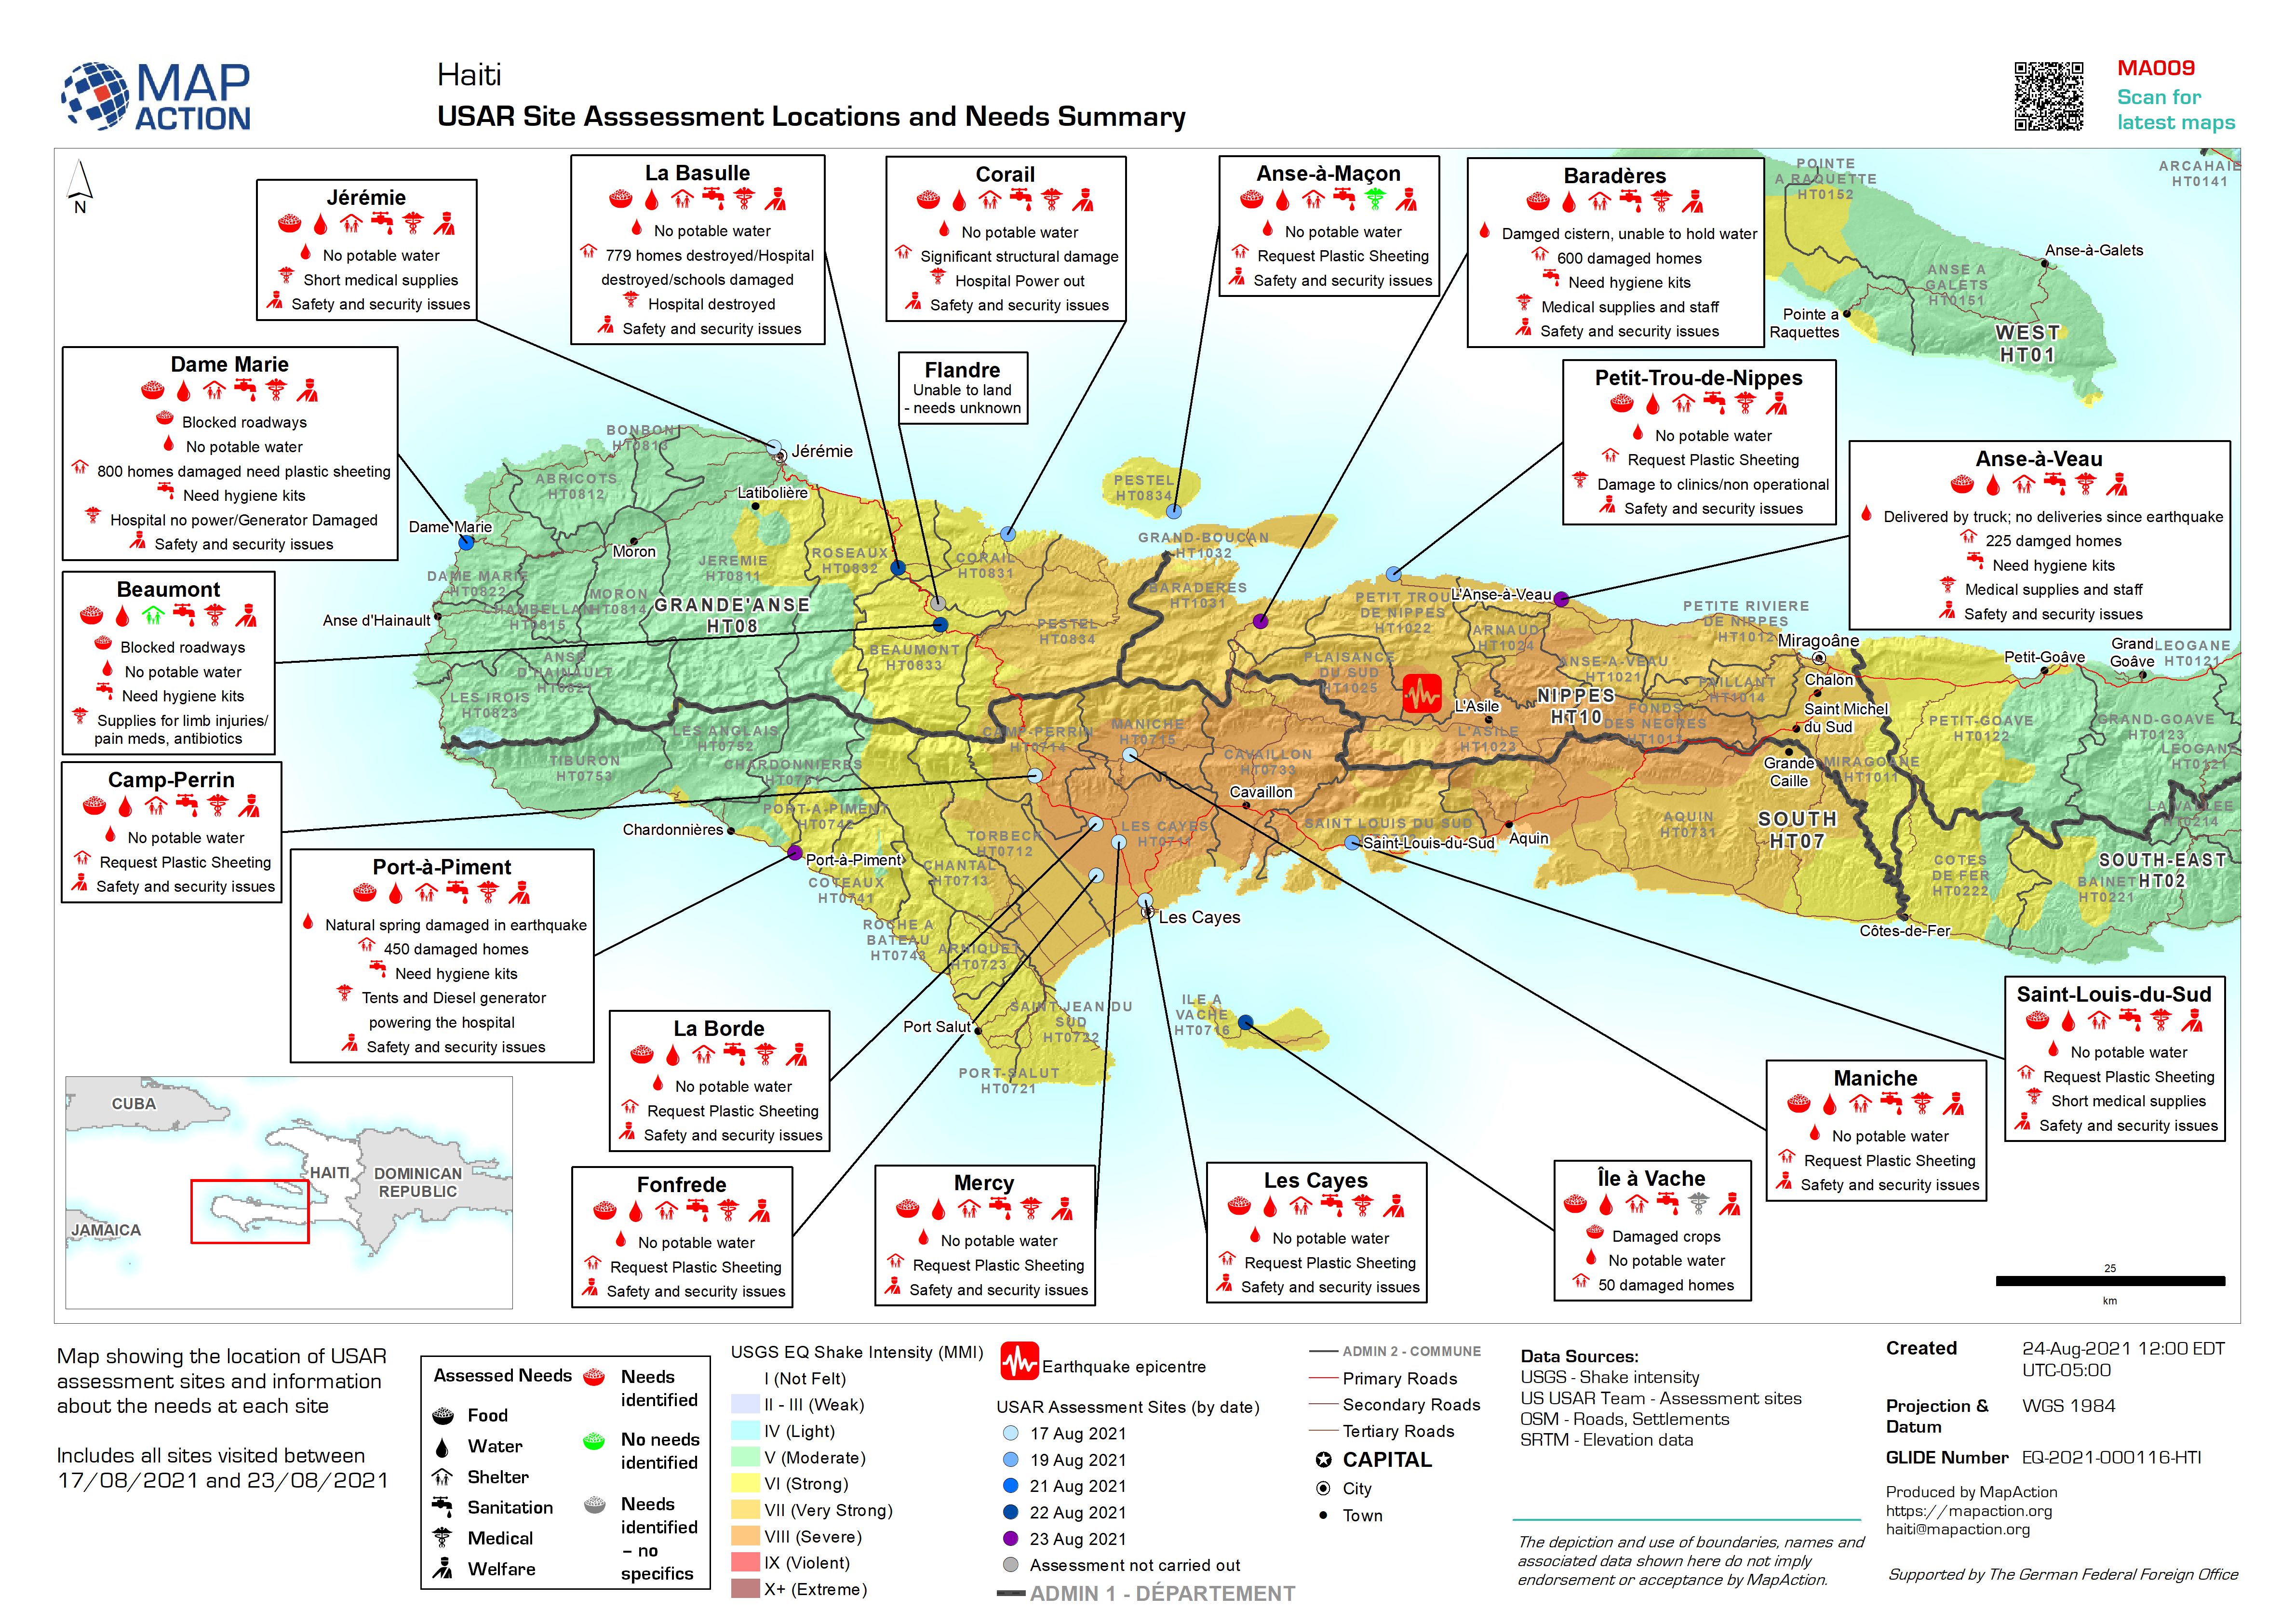
USAR Site Assessment Locations and Needs Summary
Map showing the location of USAR assessment sites and information about the needs at each site Includes all sites visited between 17/08/2021 and 23/08/2021 -
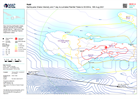
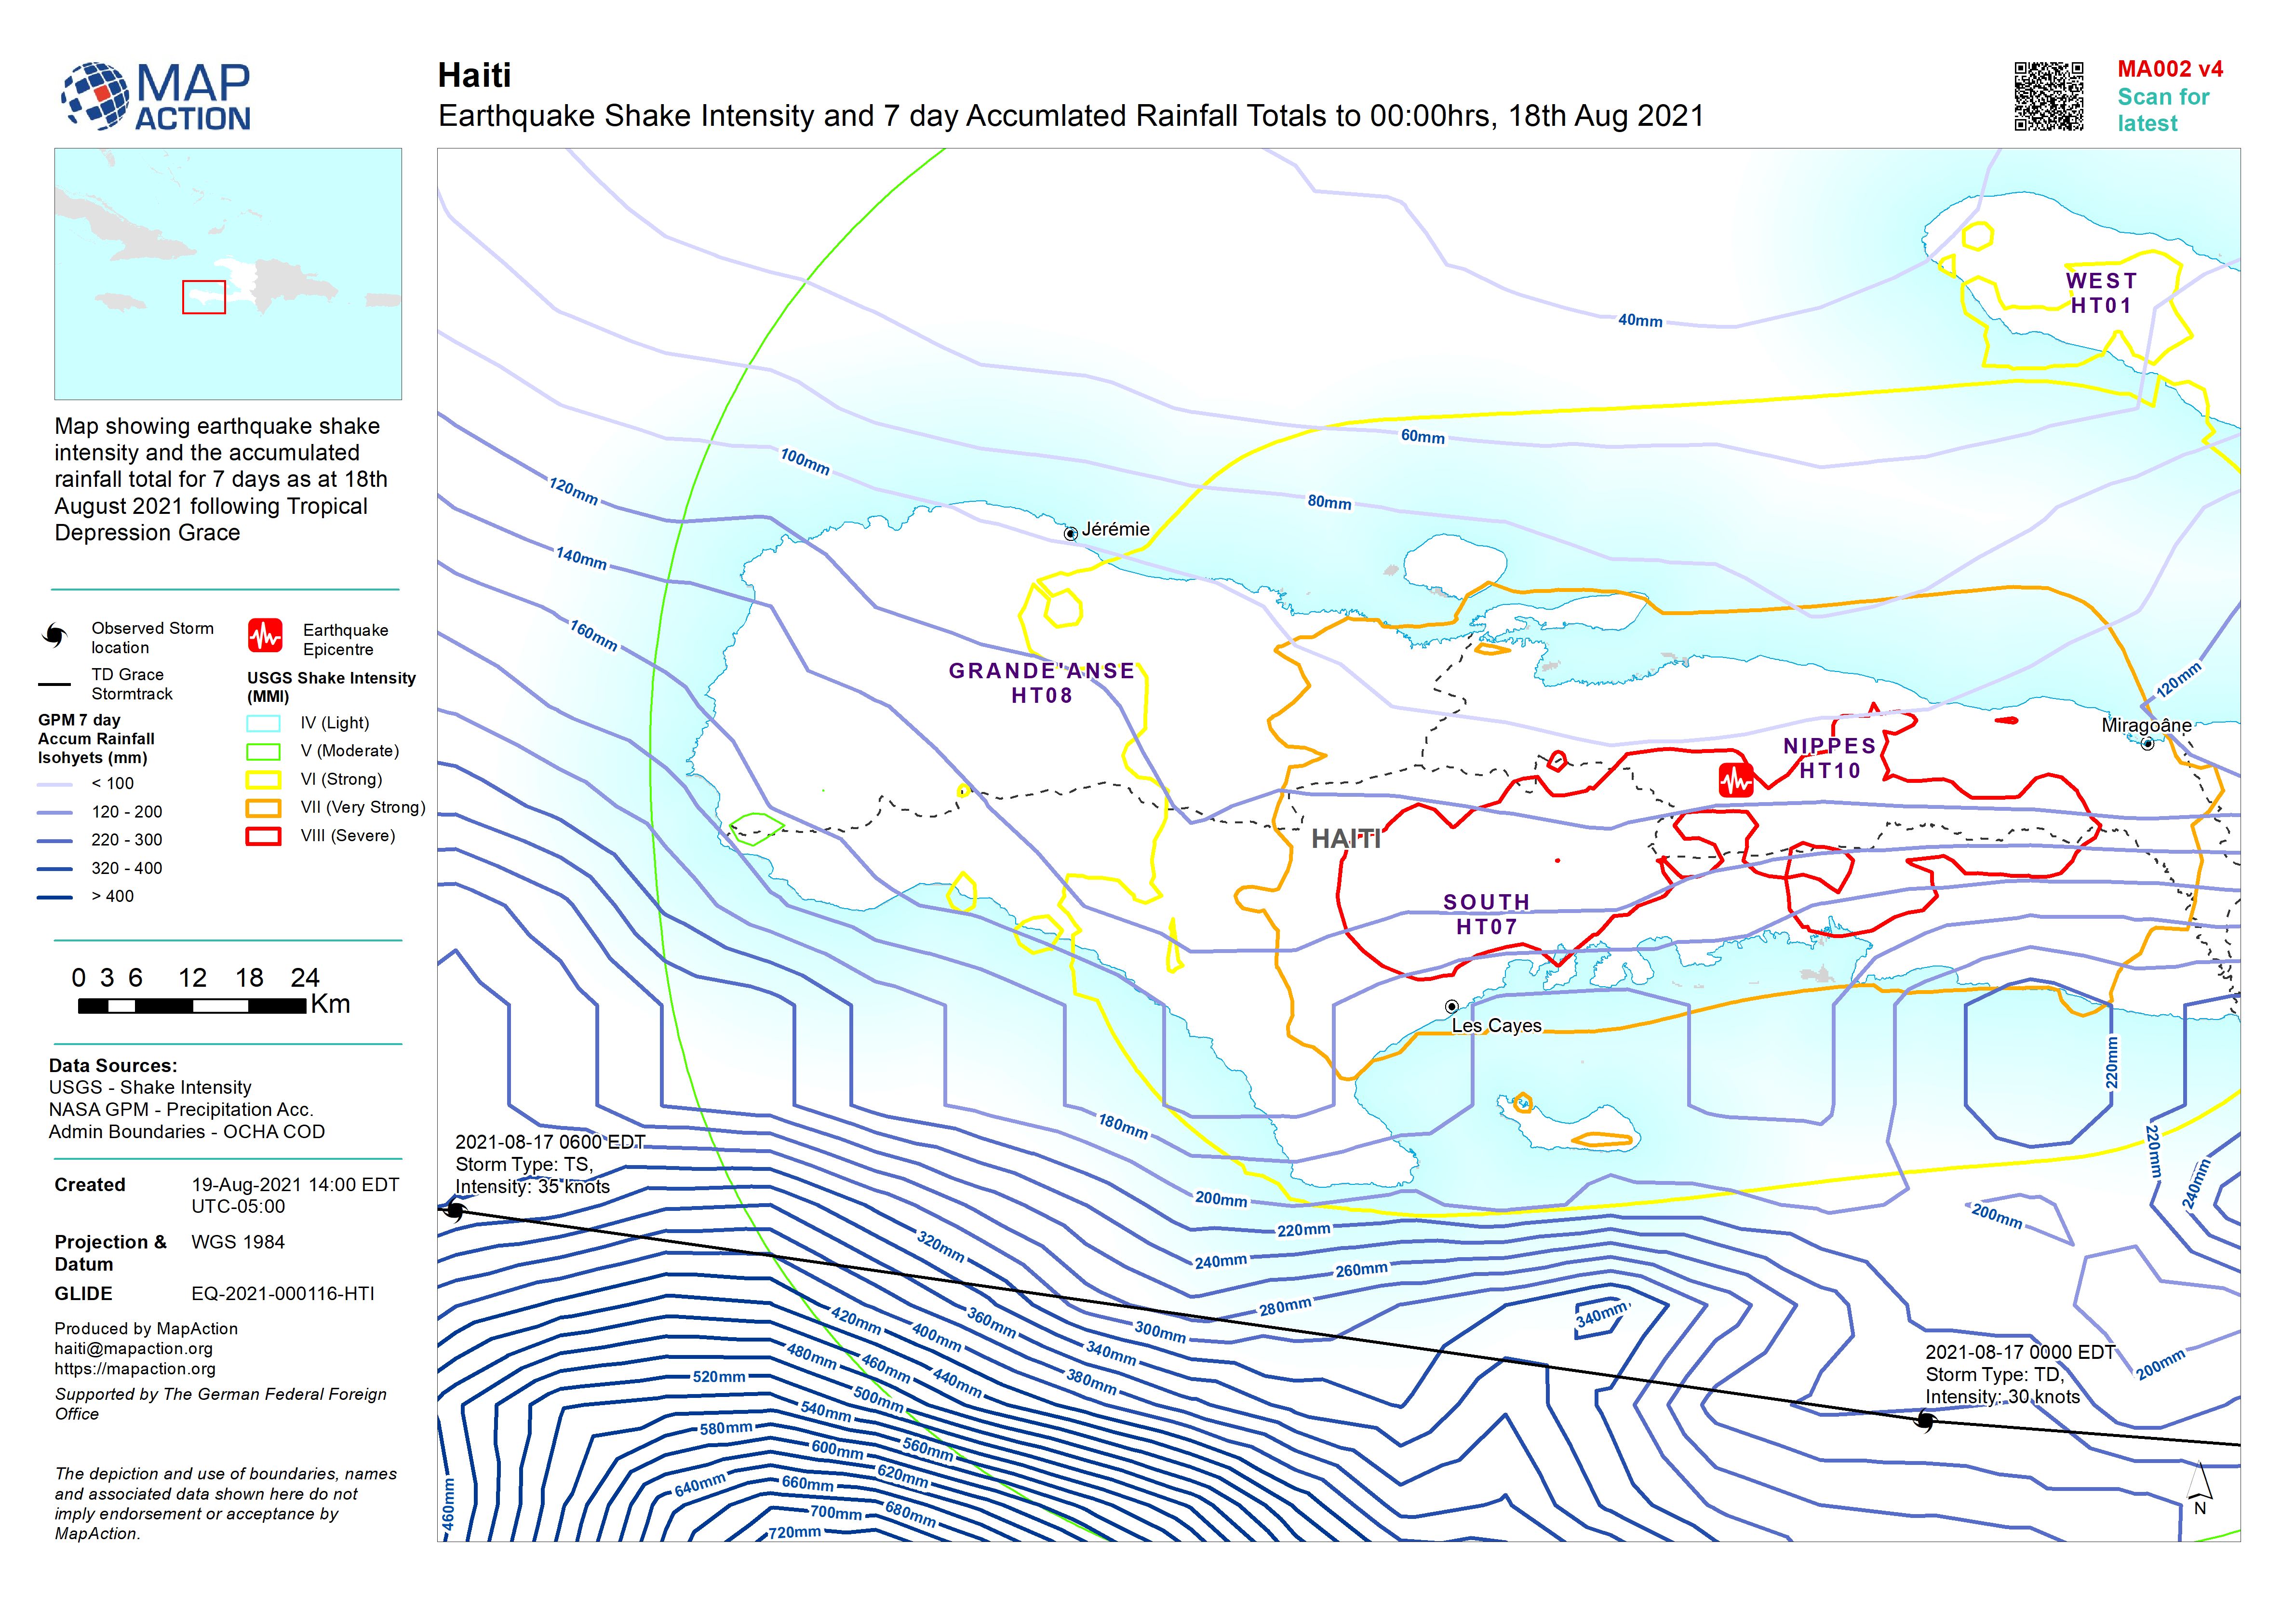
Earthquake Shake Intensity and 7 day Accumulated Rainfall Totals to 00:00hrs,...
Map showing earthquake shake intensity and the accumulated rainfall total for 7 days as at 18th August 2021 following Tropical Depression Grace -
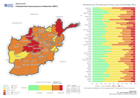
Afghanistan: Projected food Insecurity (June to November 2021)
Map and charts show the projected IPC phases per province. -
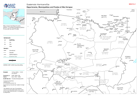
Guatemala: Admin and Pcode Atlas
Map shows the Departments (Admin 1) and Municipalities (Admin 2) boundaries with Pcodes -

Reference map of Saint Vincent
Map shows detailed features of St Vincent including settlements, roads and phyiscal features. -
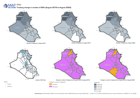
Iraq: Tracking change in numbers of IDPs (August 2018 to August 2020)
Maps show the number of displaced people and the change between years. -

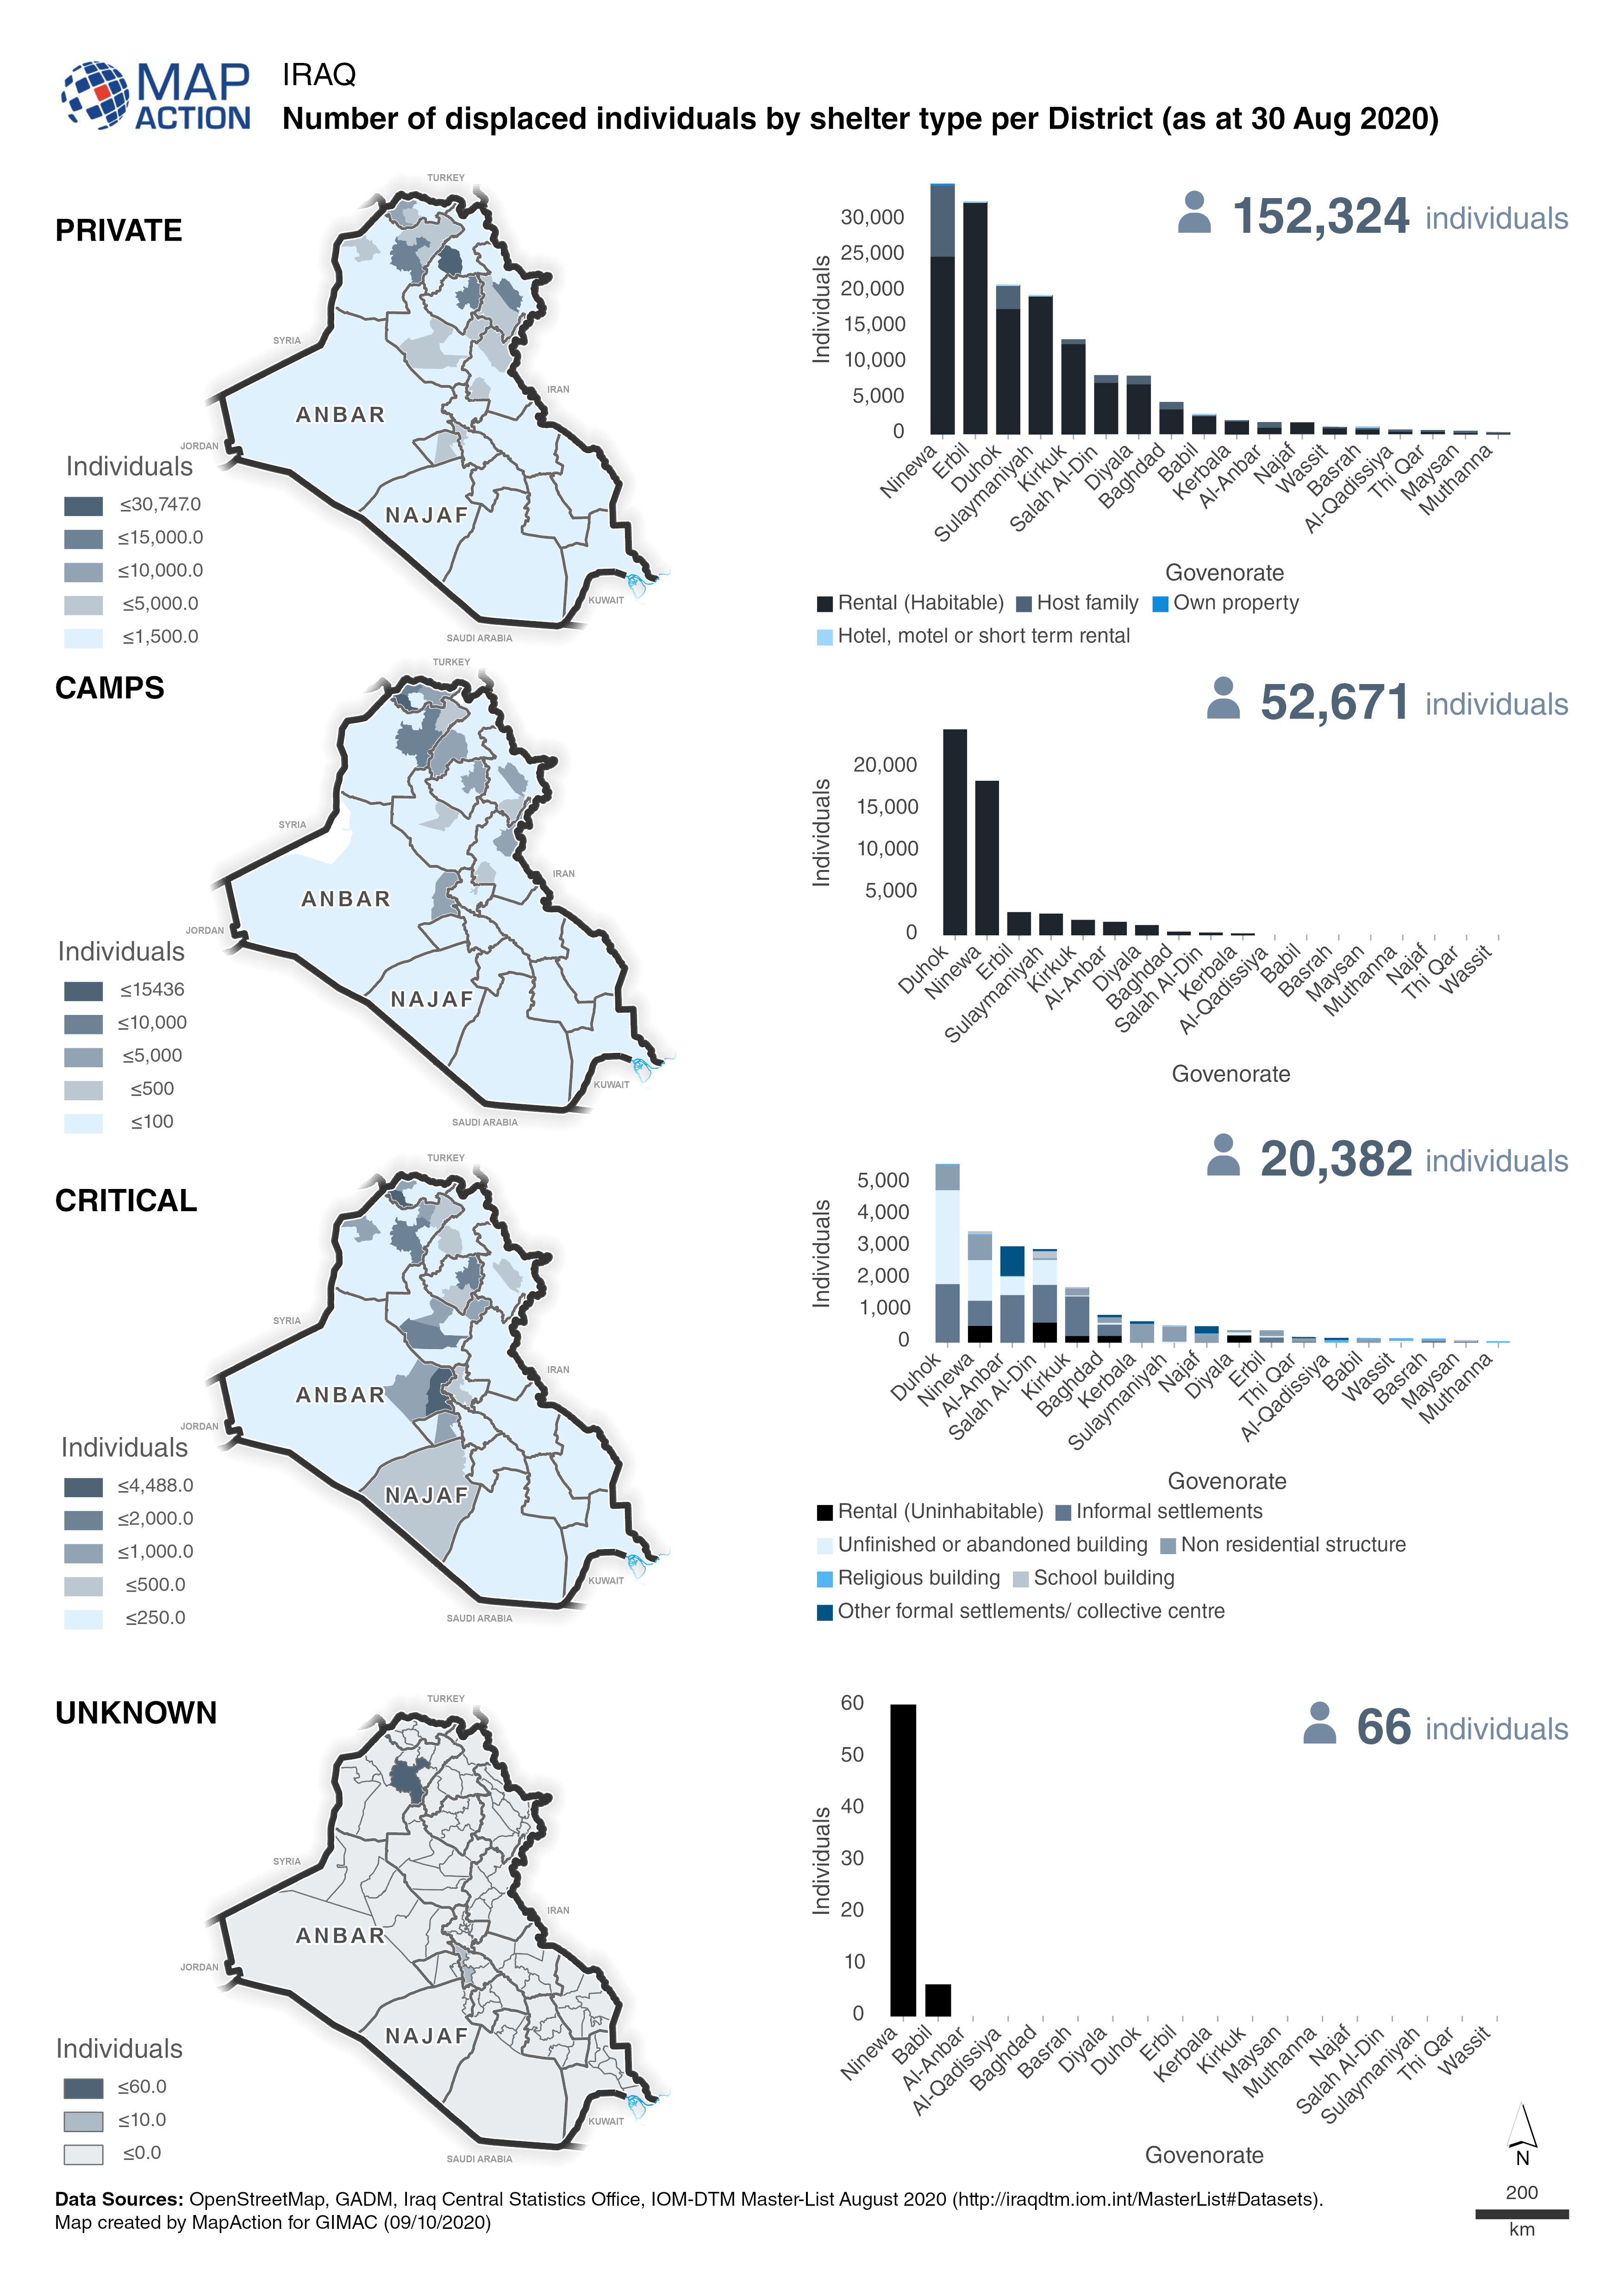
Iraq: Number of displaced individuals by shelter type per district (as at 30 ...
Maps and charts show a breakdown of the number displaced individuals in private accomodation, camps, critical shelters or unknown. -
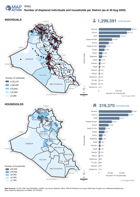
Iraq: Number of displaced individuals and households per district (as at 30 A...
Map shows the number of displaced individuals and households per district in Iraq. -

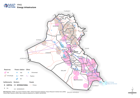
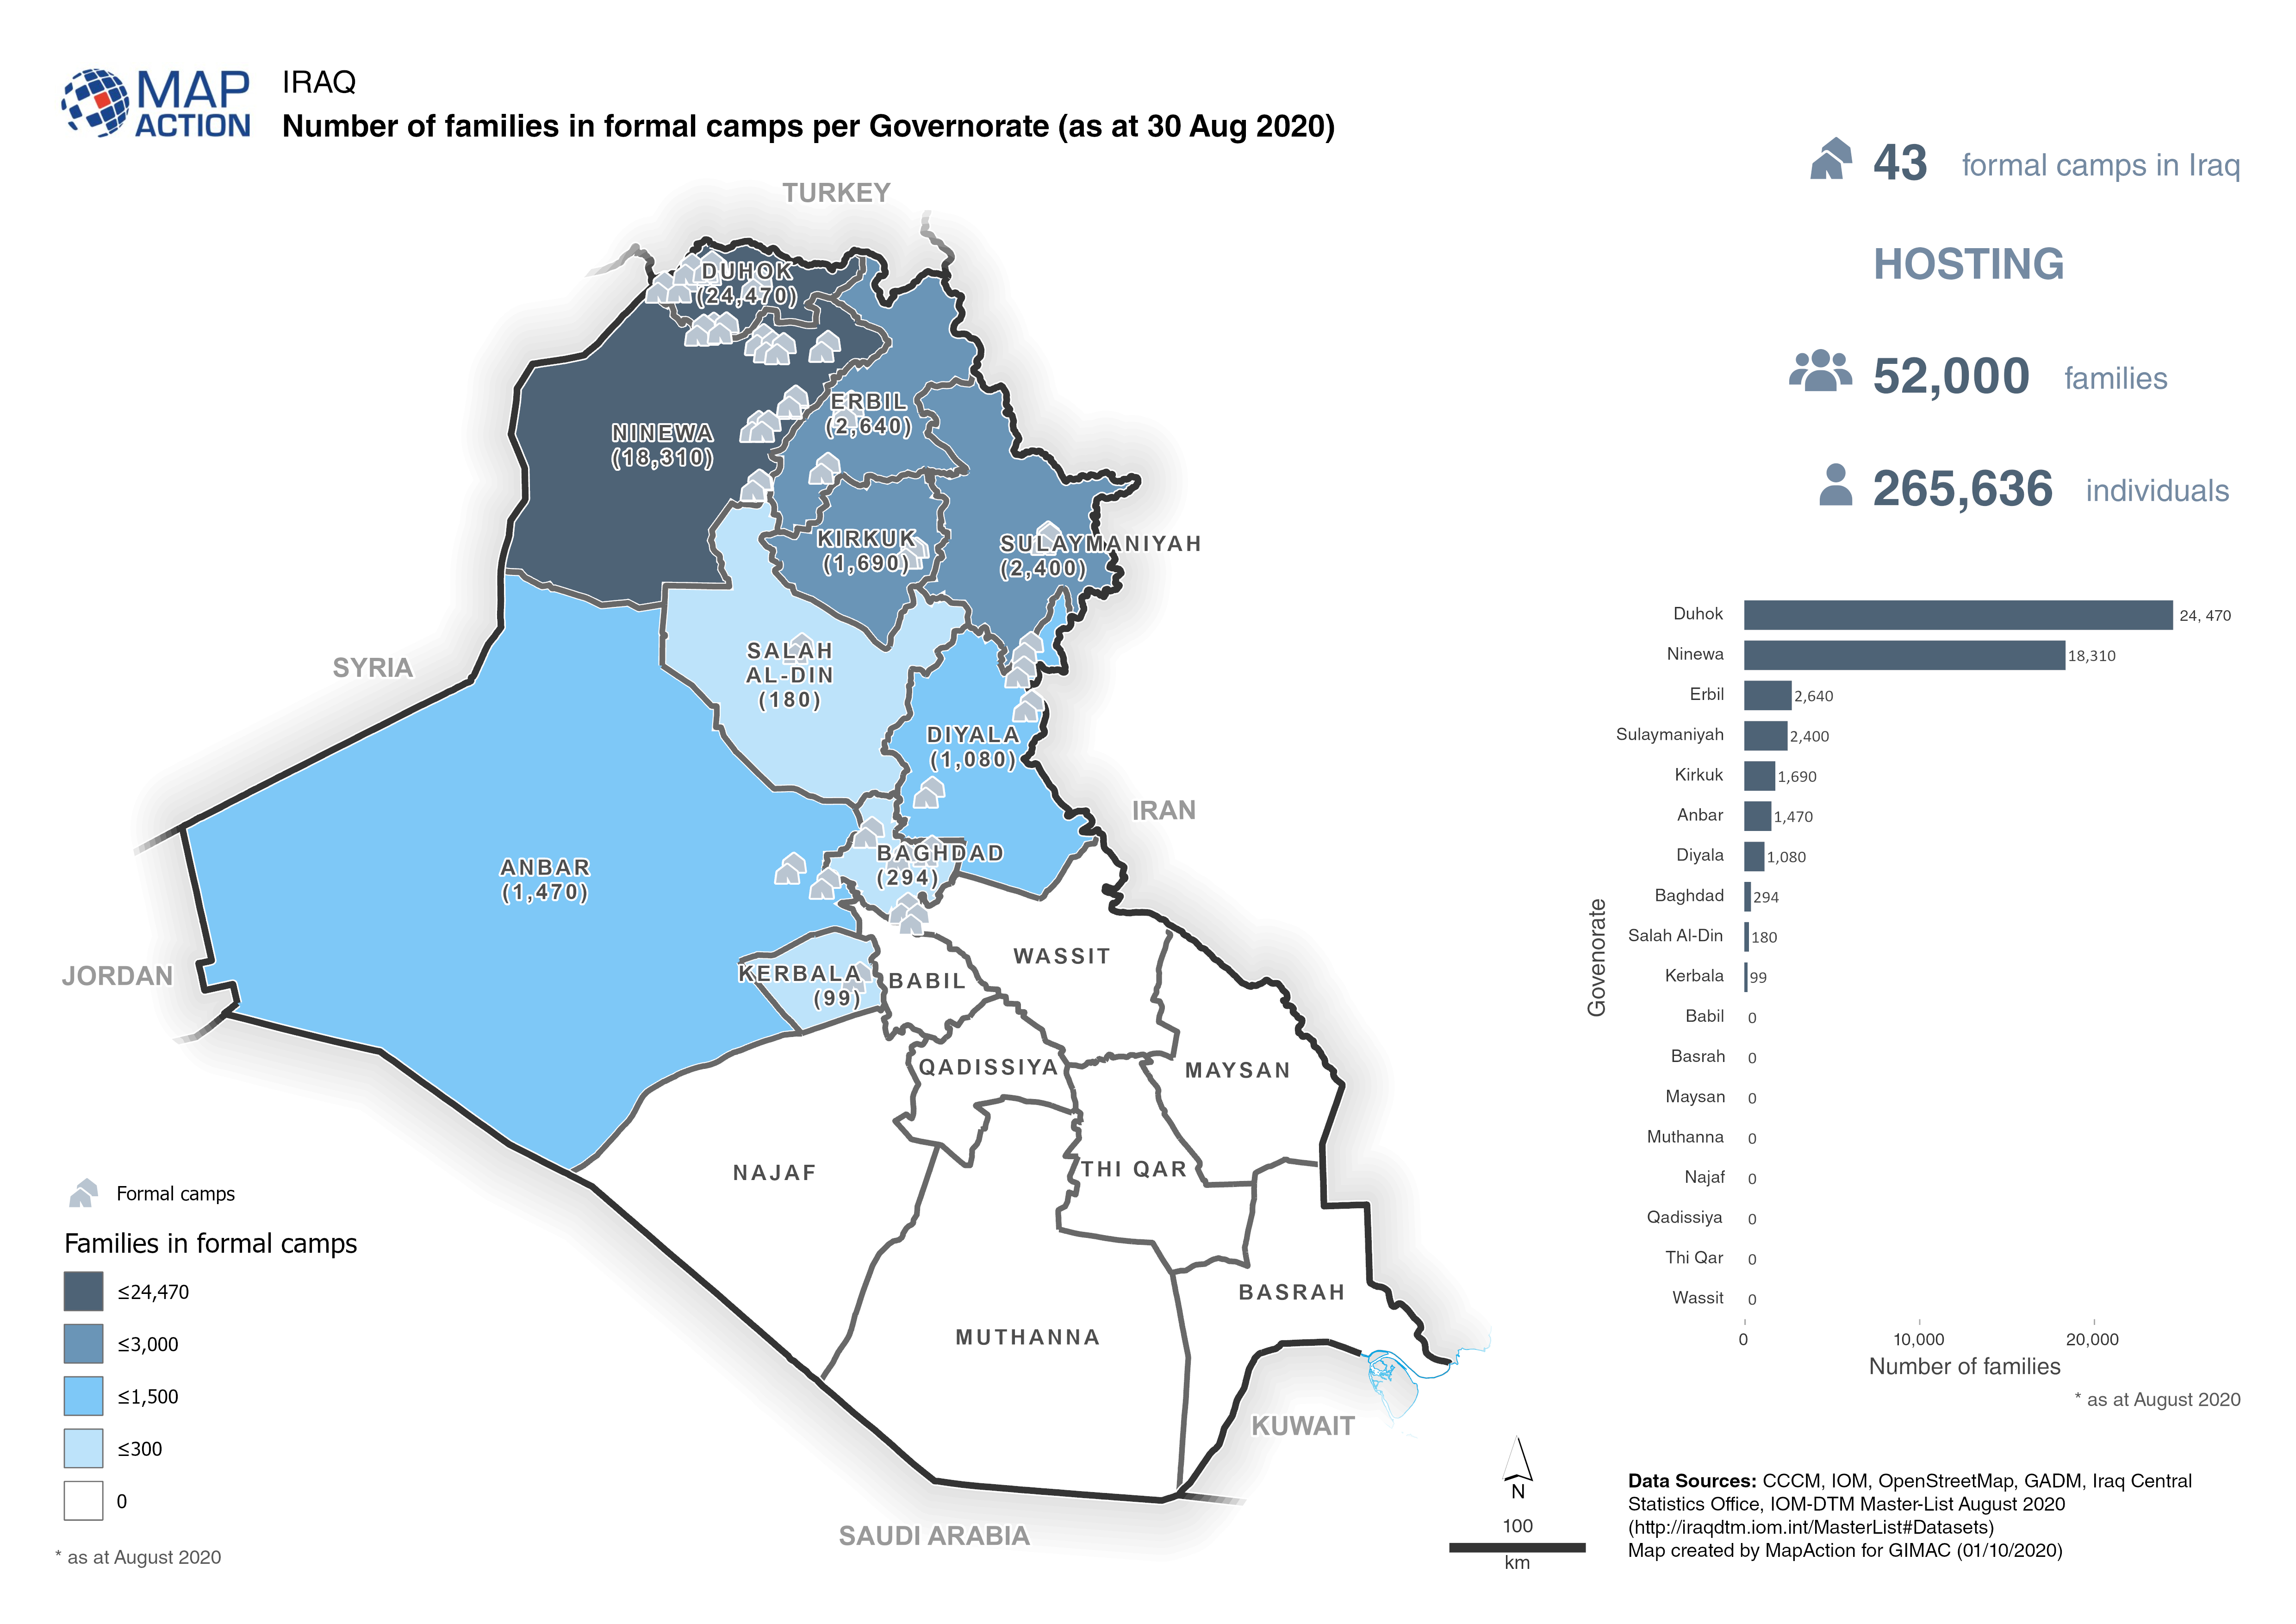
Iraq: Number of families in formal camps per Governorate (as at 30 Aug 2020)
Map shows the number of families and the locations of formal camps in Iraq. -
-

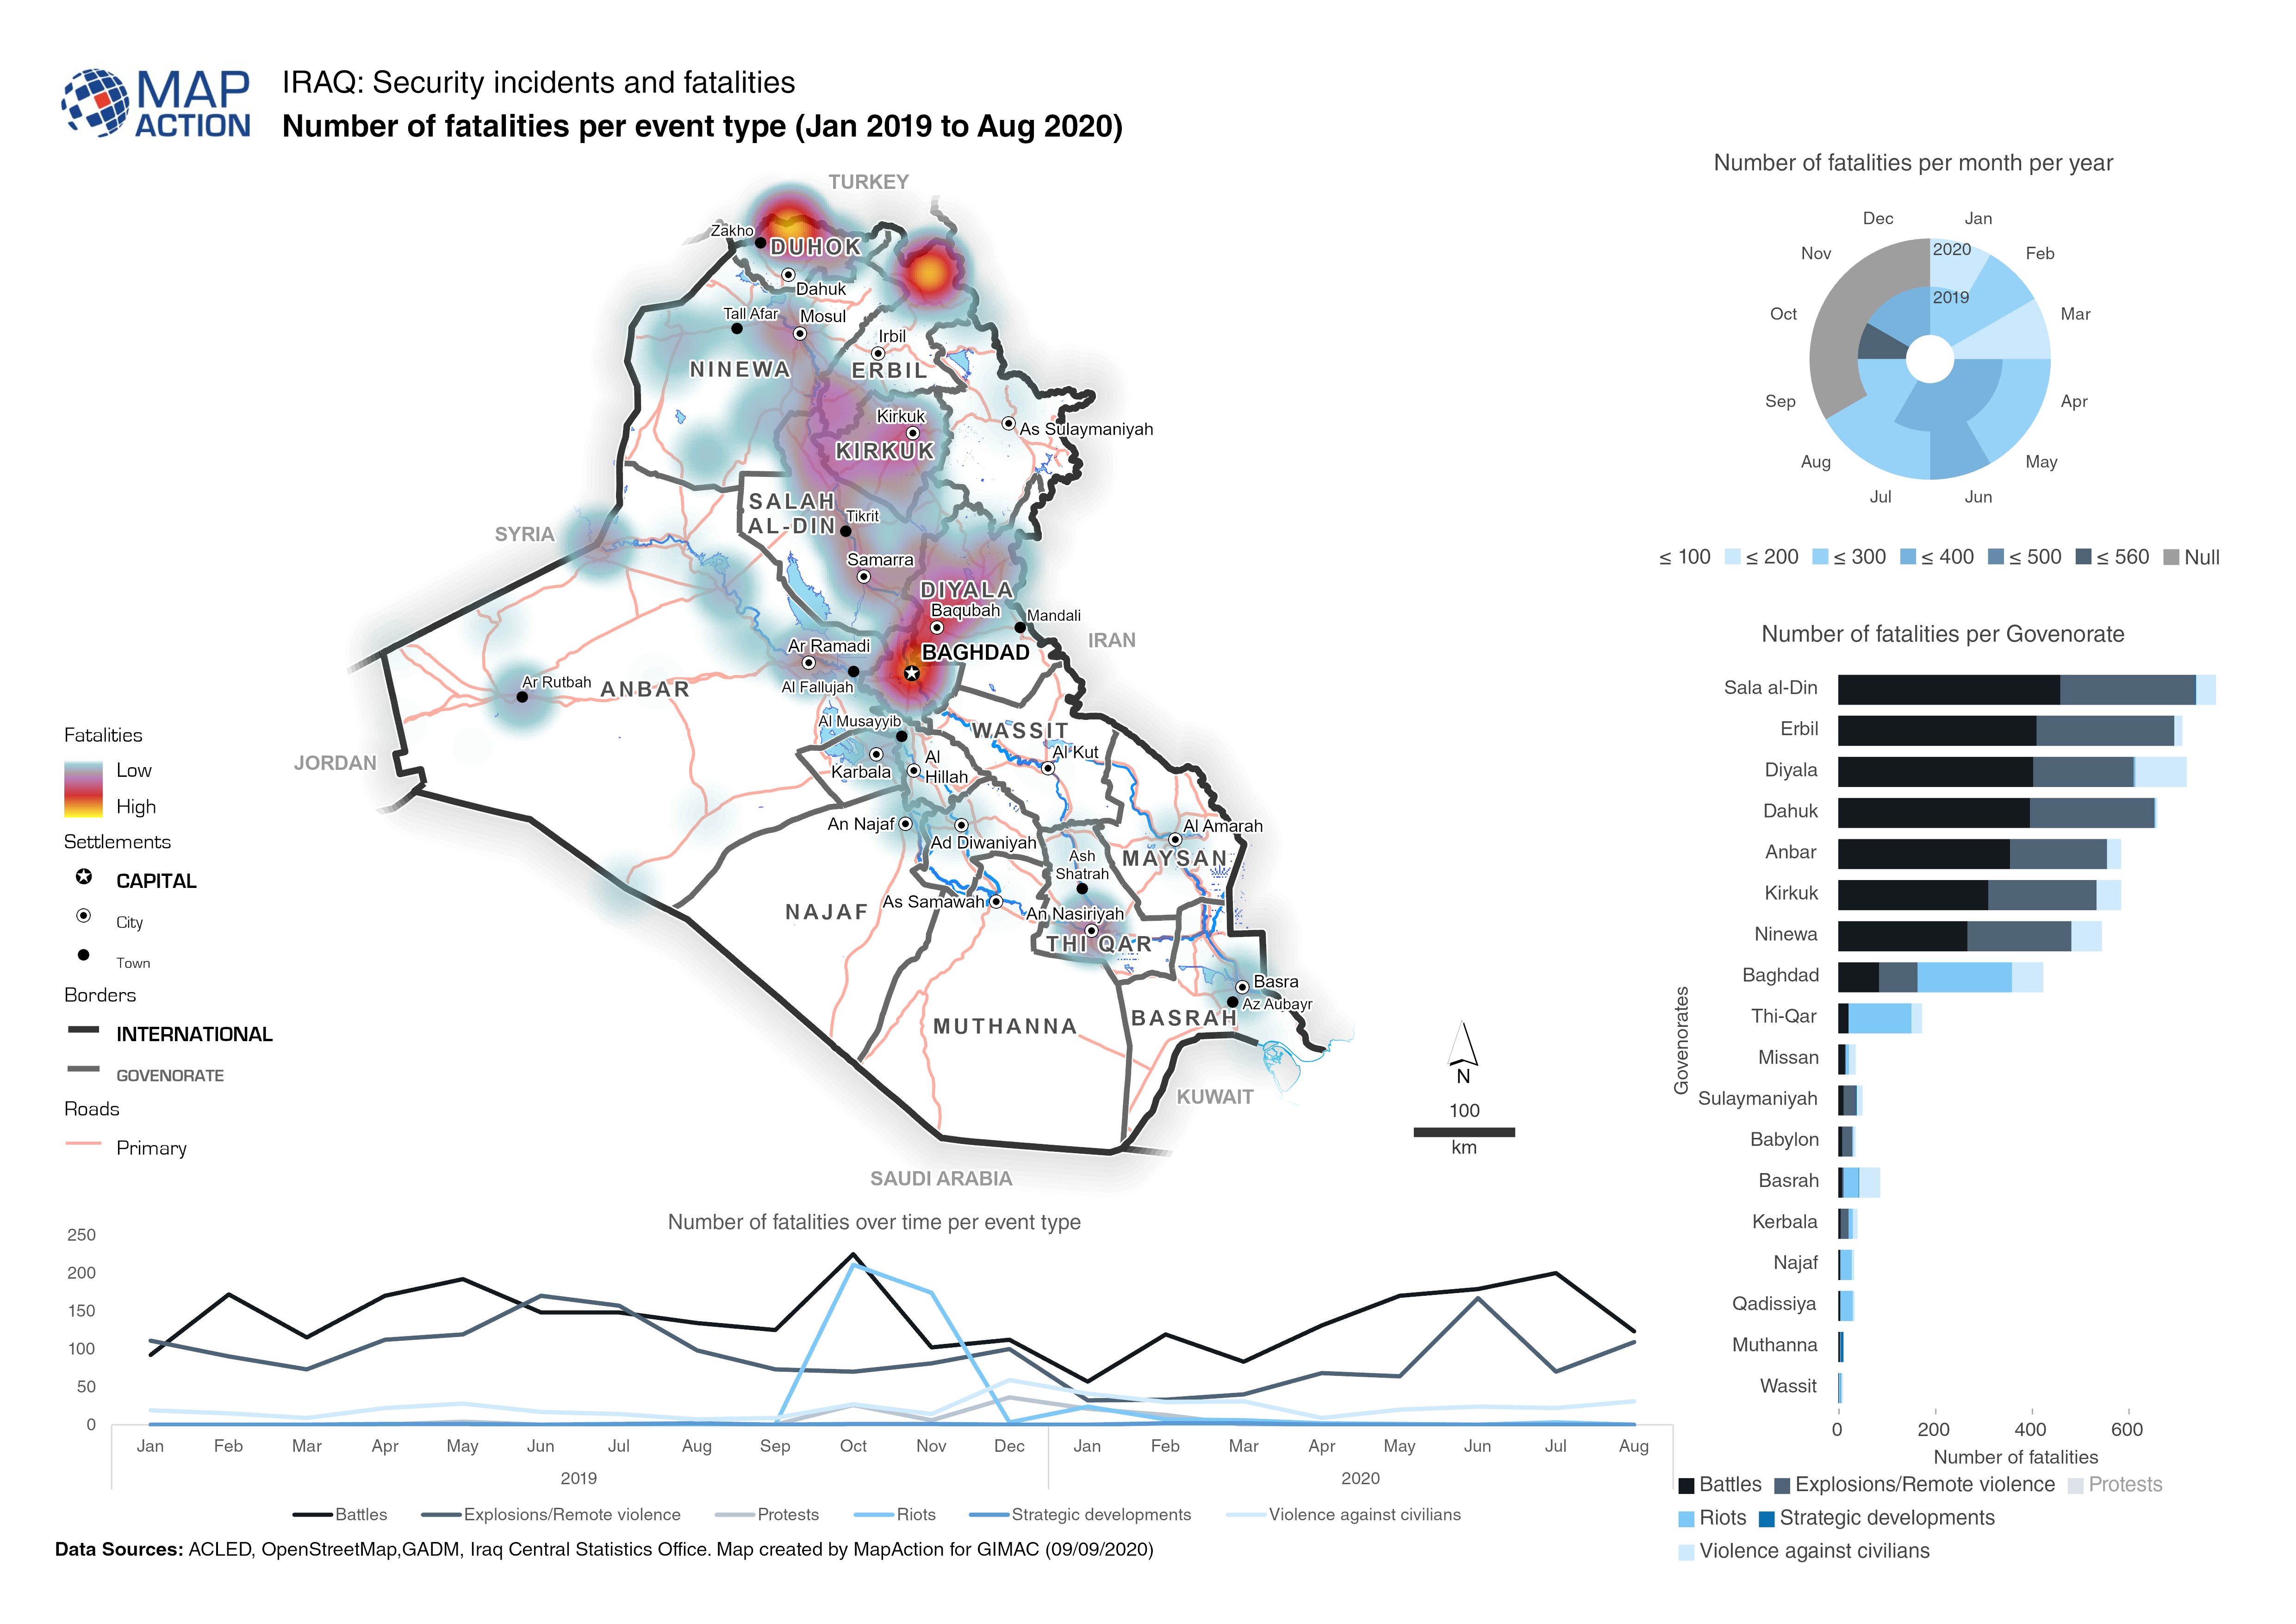
Iraq: Number of fatalities per event type (Jan 2019 to Aug 2020)
The map provides an overview of different security related incidents and fatalities. -

-
-
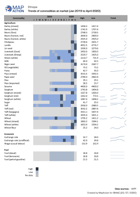
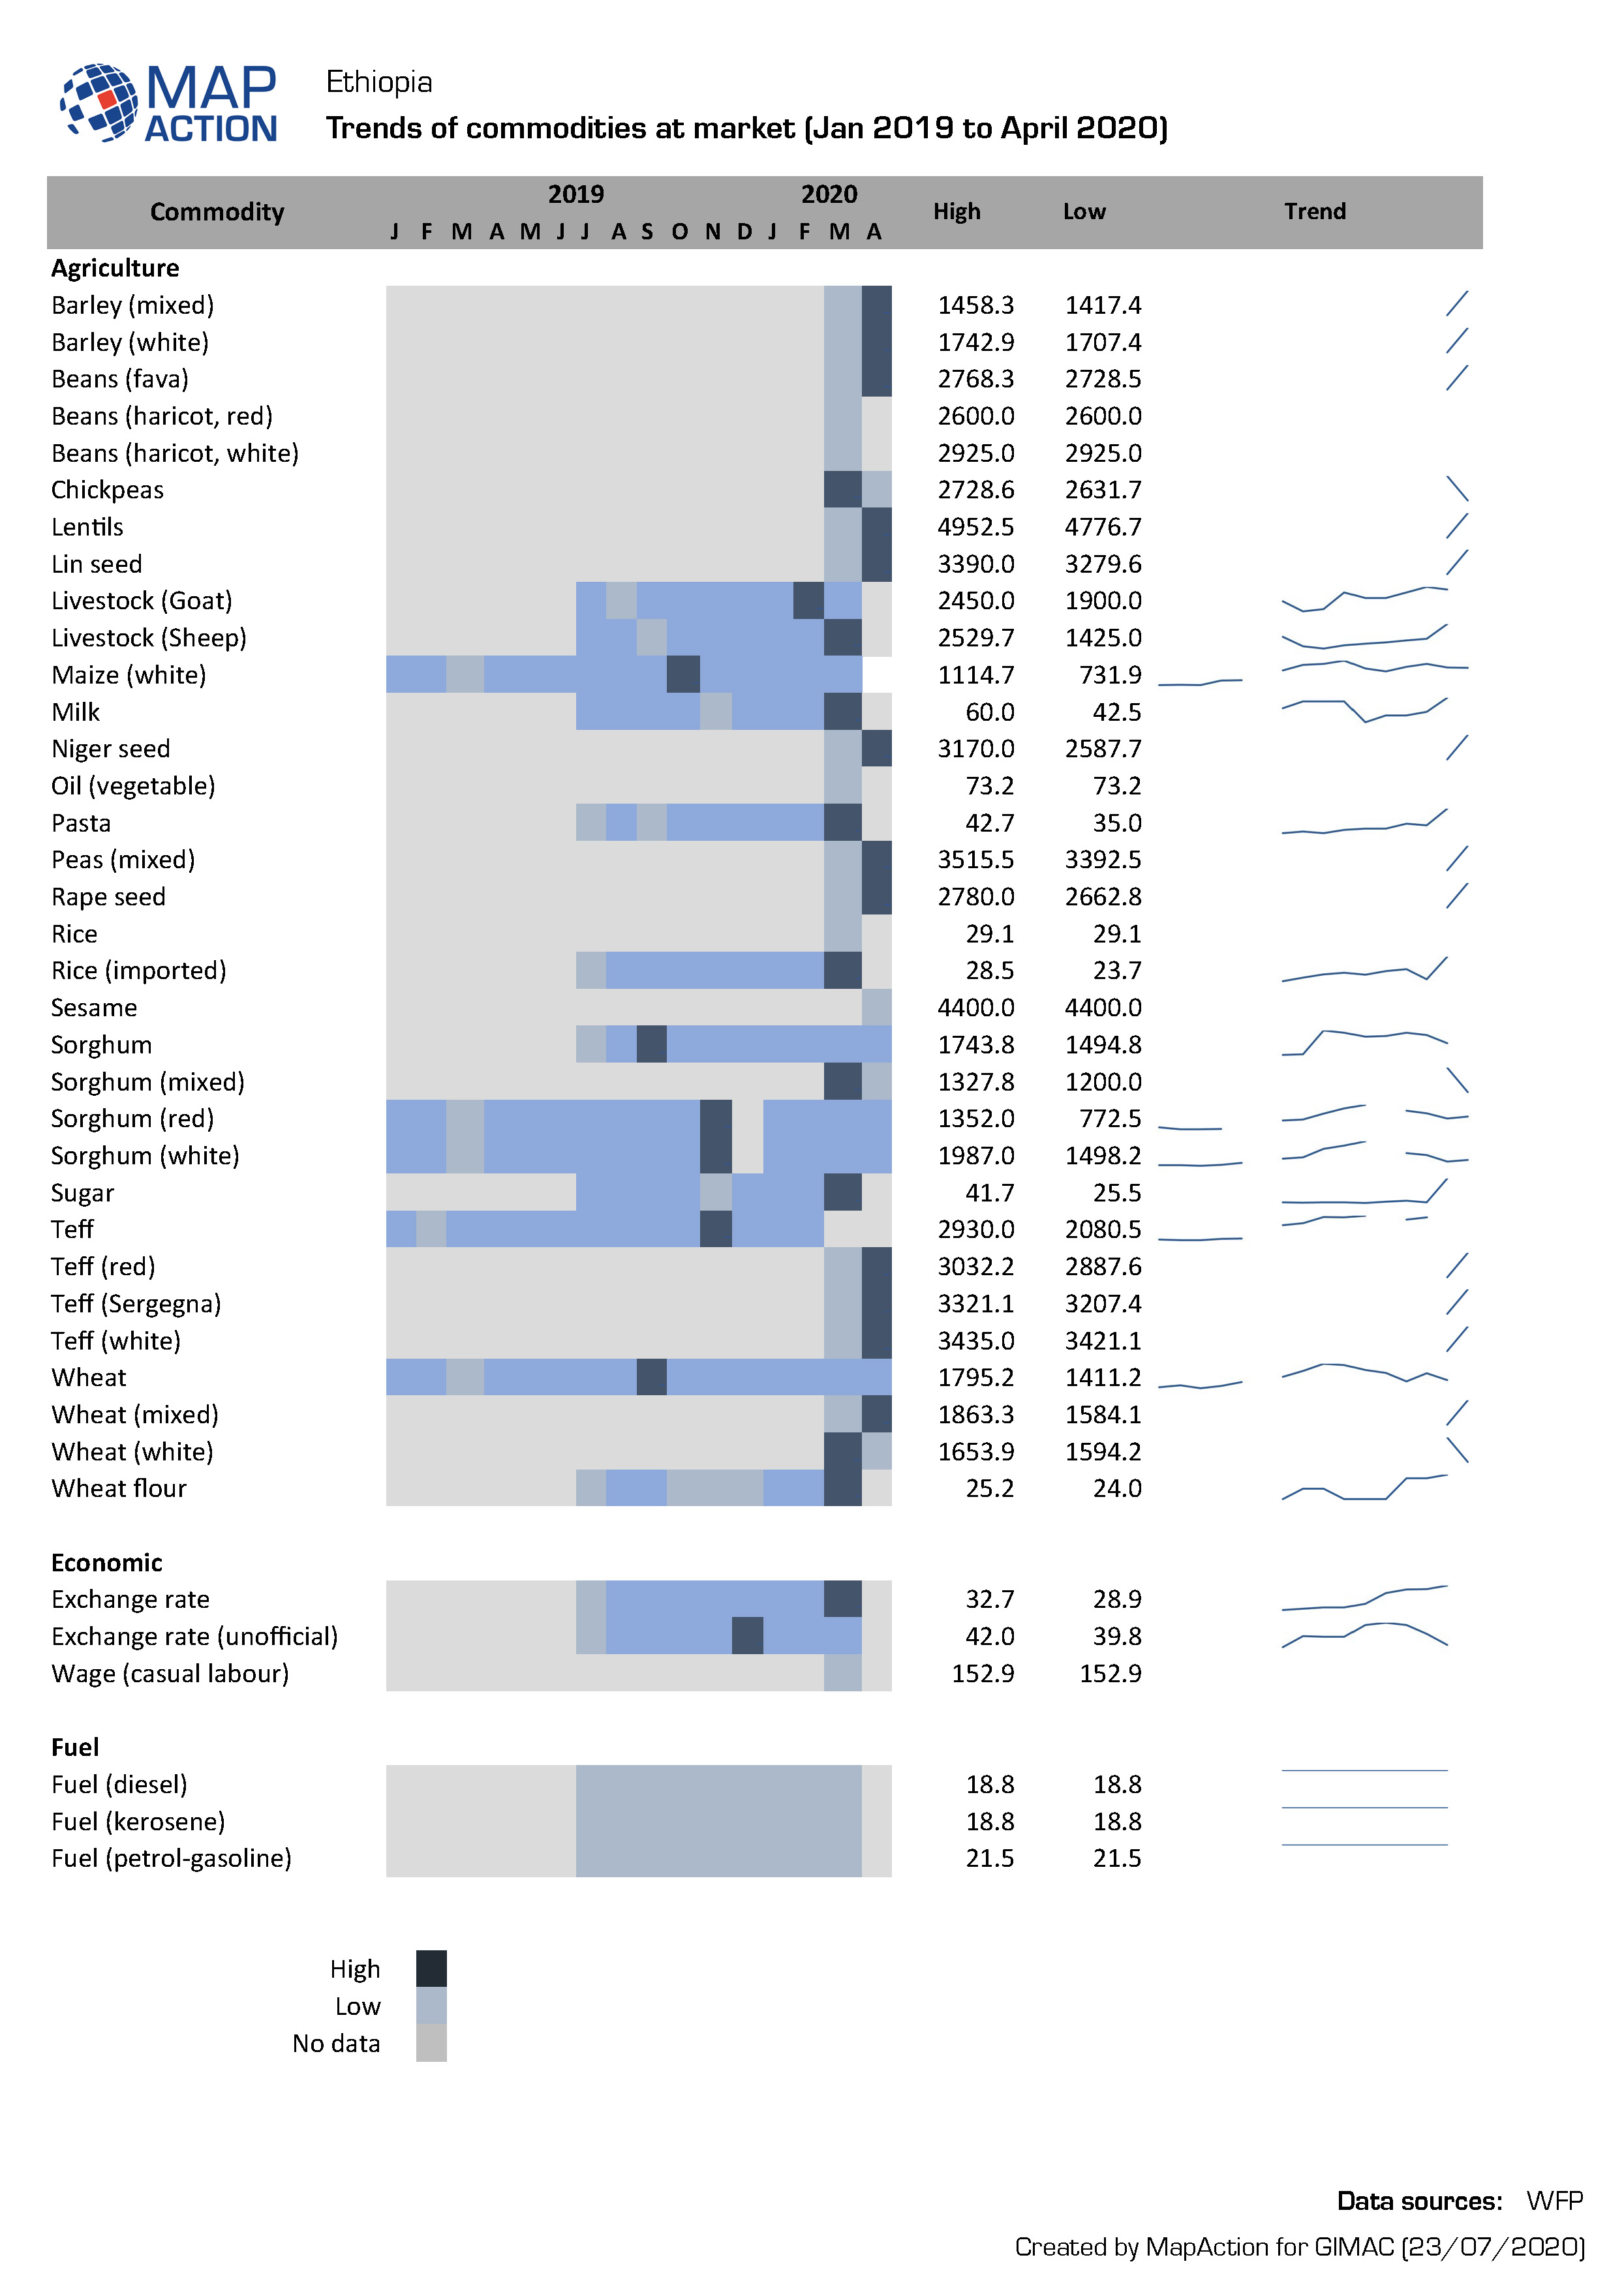
Ethiopia: Trends of commodities at market (Jan 2019 to April 2020)
Infographic shows the type and trends of commodities sold at market. -
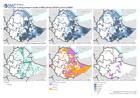
Ethiopia: Tracking change in numbers of IDPs (January 2018 to January 2020)
Maps show the number of displaced people and the change between years. -
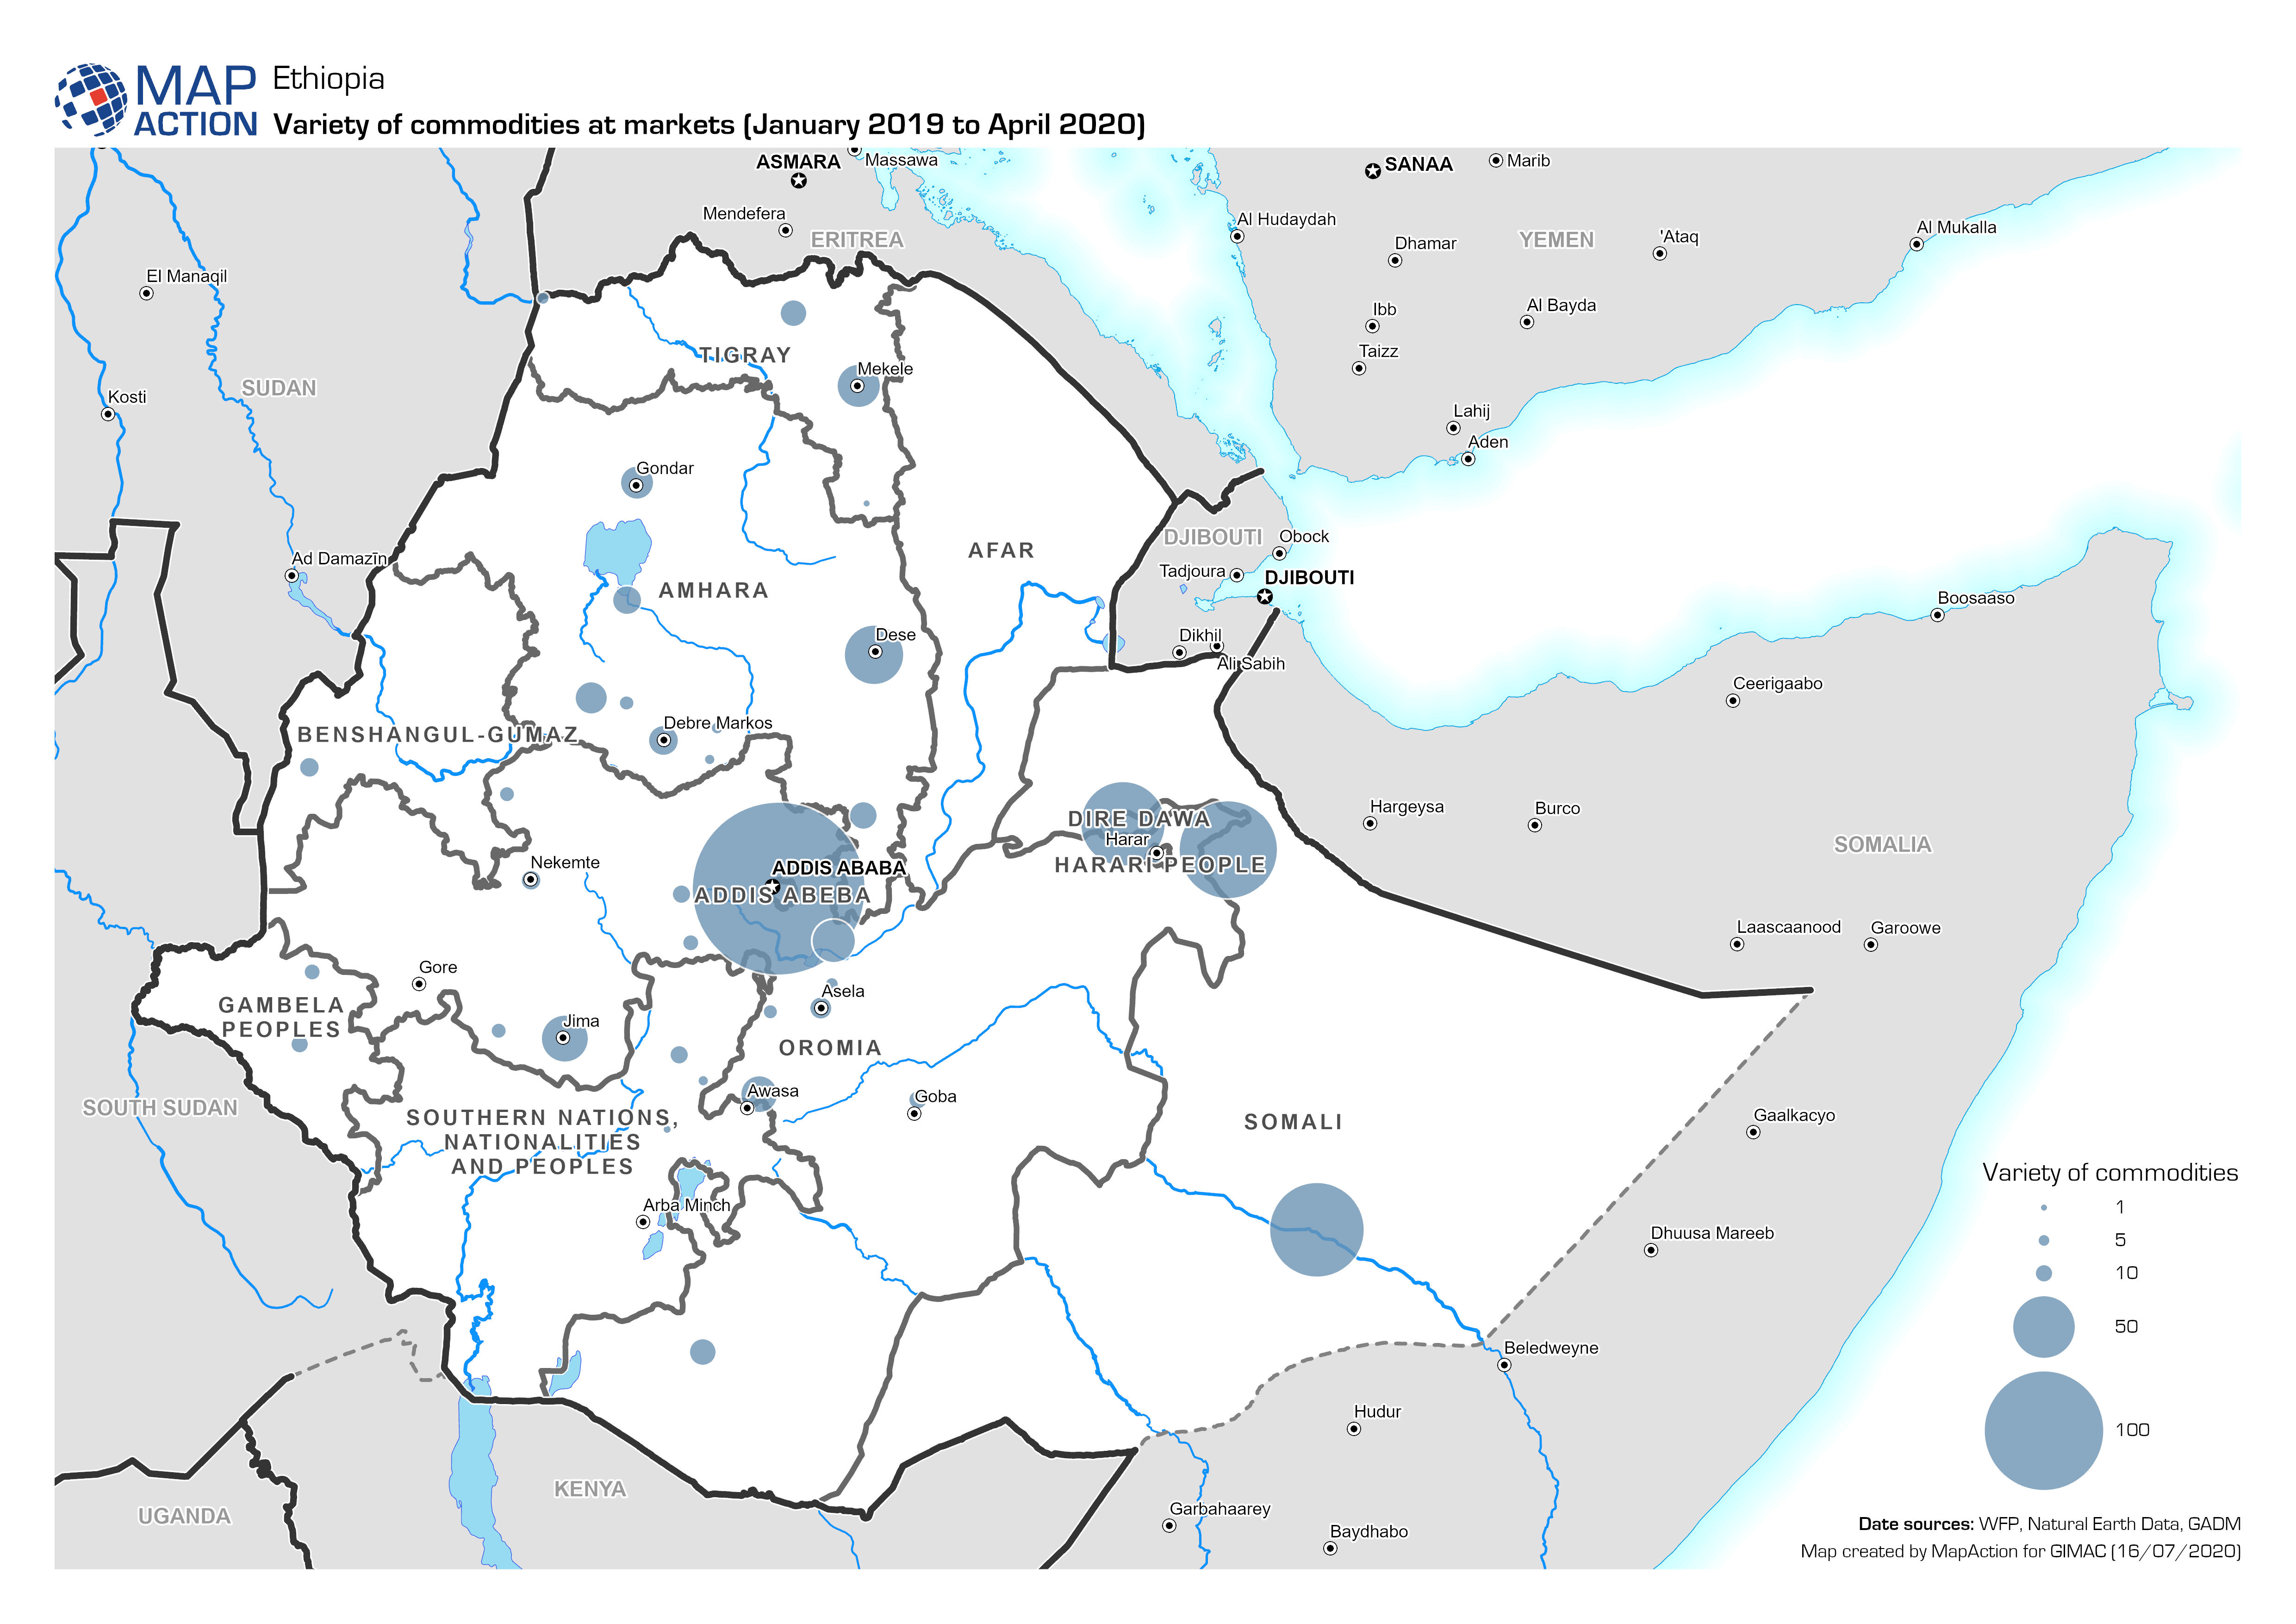
Ethiopia: Variety of commodities in markets (January 2019 to April 2020)
Map shows the variety in the number of commodities being sold in market places. -
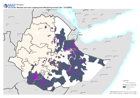
Ethiopia: Woreda and main cropping land affected by locuts (Jan - Jul 2020)
Map shows the location of the main cropping lands, the position of locusts and the woreda affected by locusts. -

Ethiopia: Number of fatalities per event (July 2019 to July 2020)
The map provides an overview of different security related incidents and fatalities. -

Sudan: Number of fatalities per event type (June 2018 to June 2021)
The map provides an overview of different security related incidents and fatalities.