-

UNICEF Water Testing Communities
Location of communites scheduled or have had water tested by UNICEF and Guyana Red Cross as of 25 Nov 2018 -

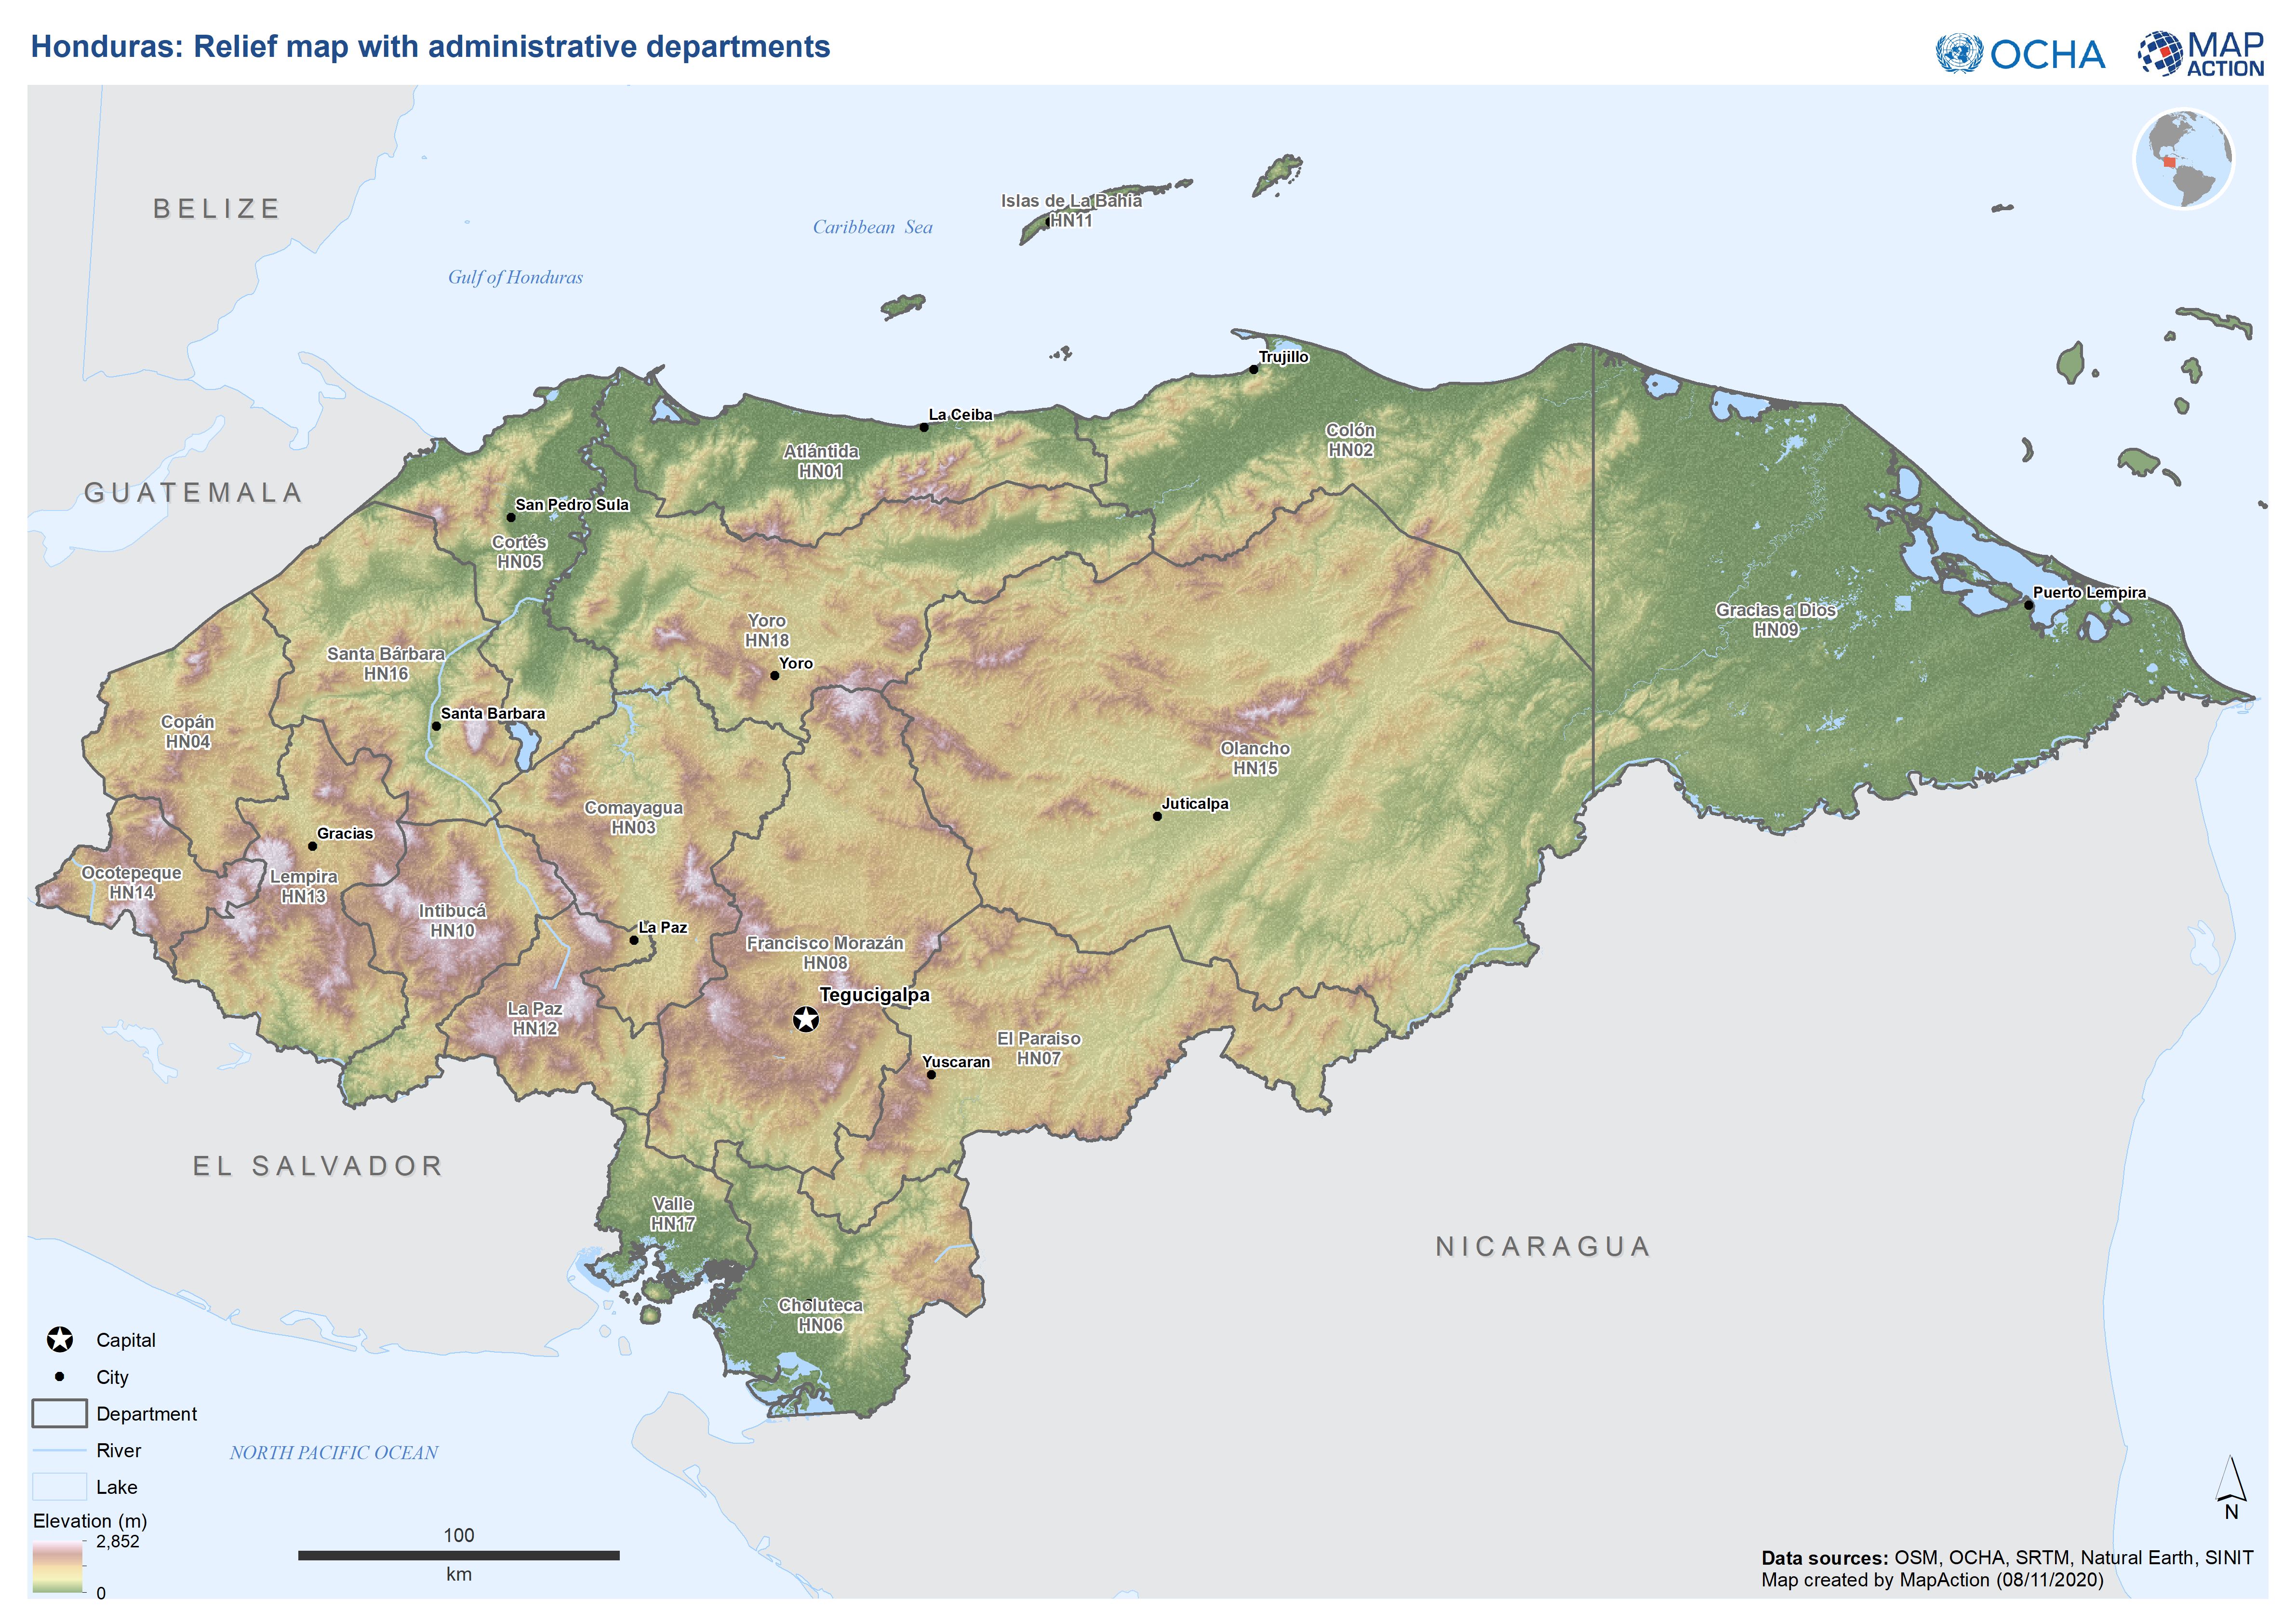
Honduras: Relief map with administrative departments
This map shows elevation, administration level 1 departments and major cities for Honduras. -
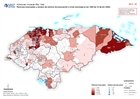
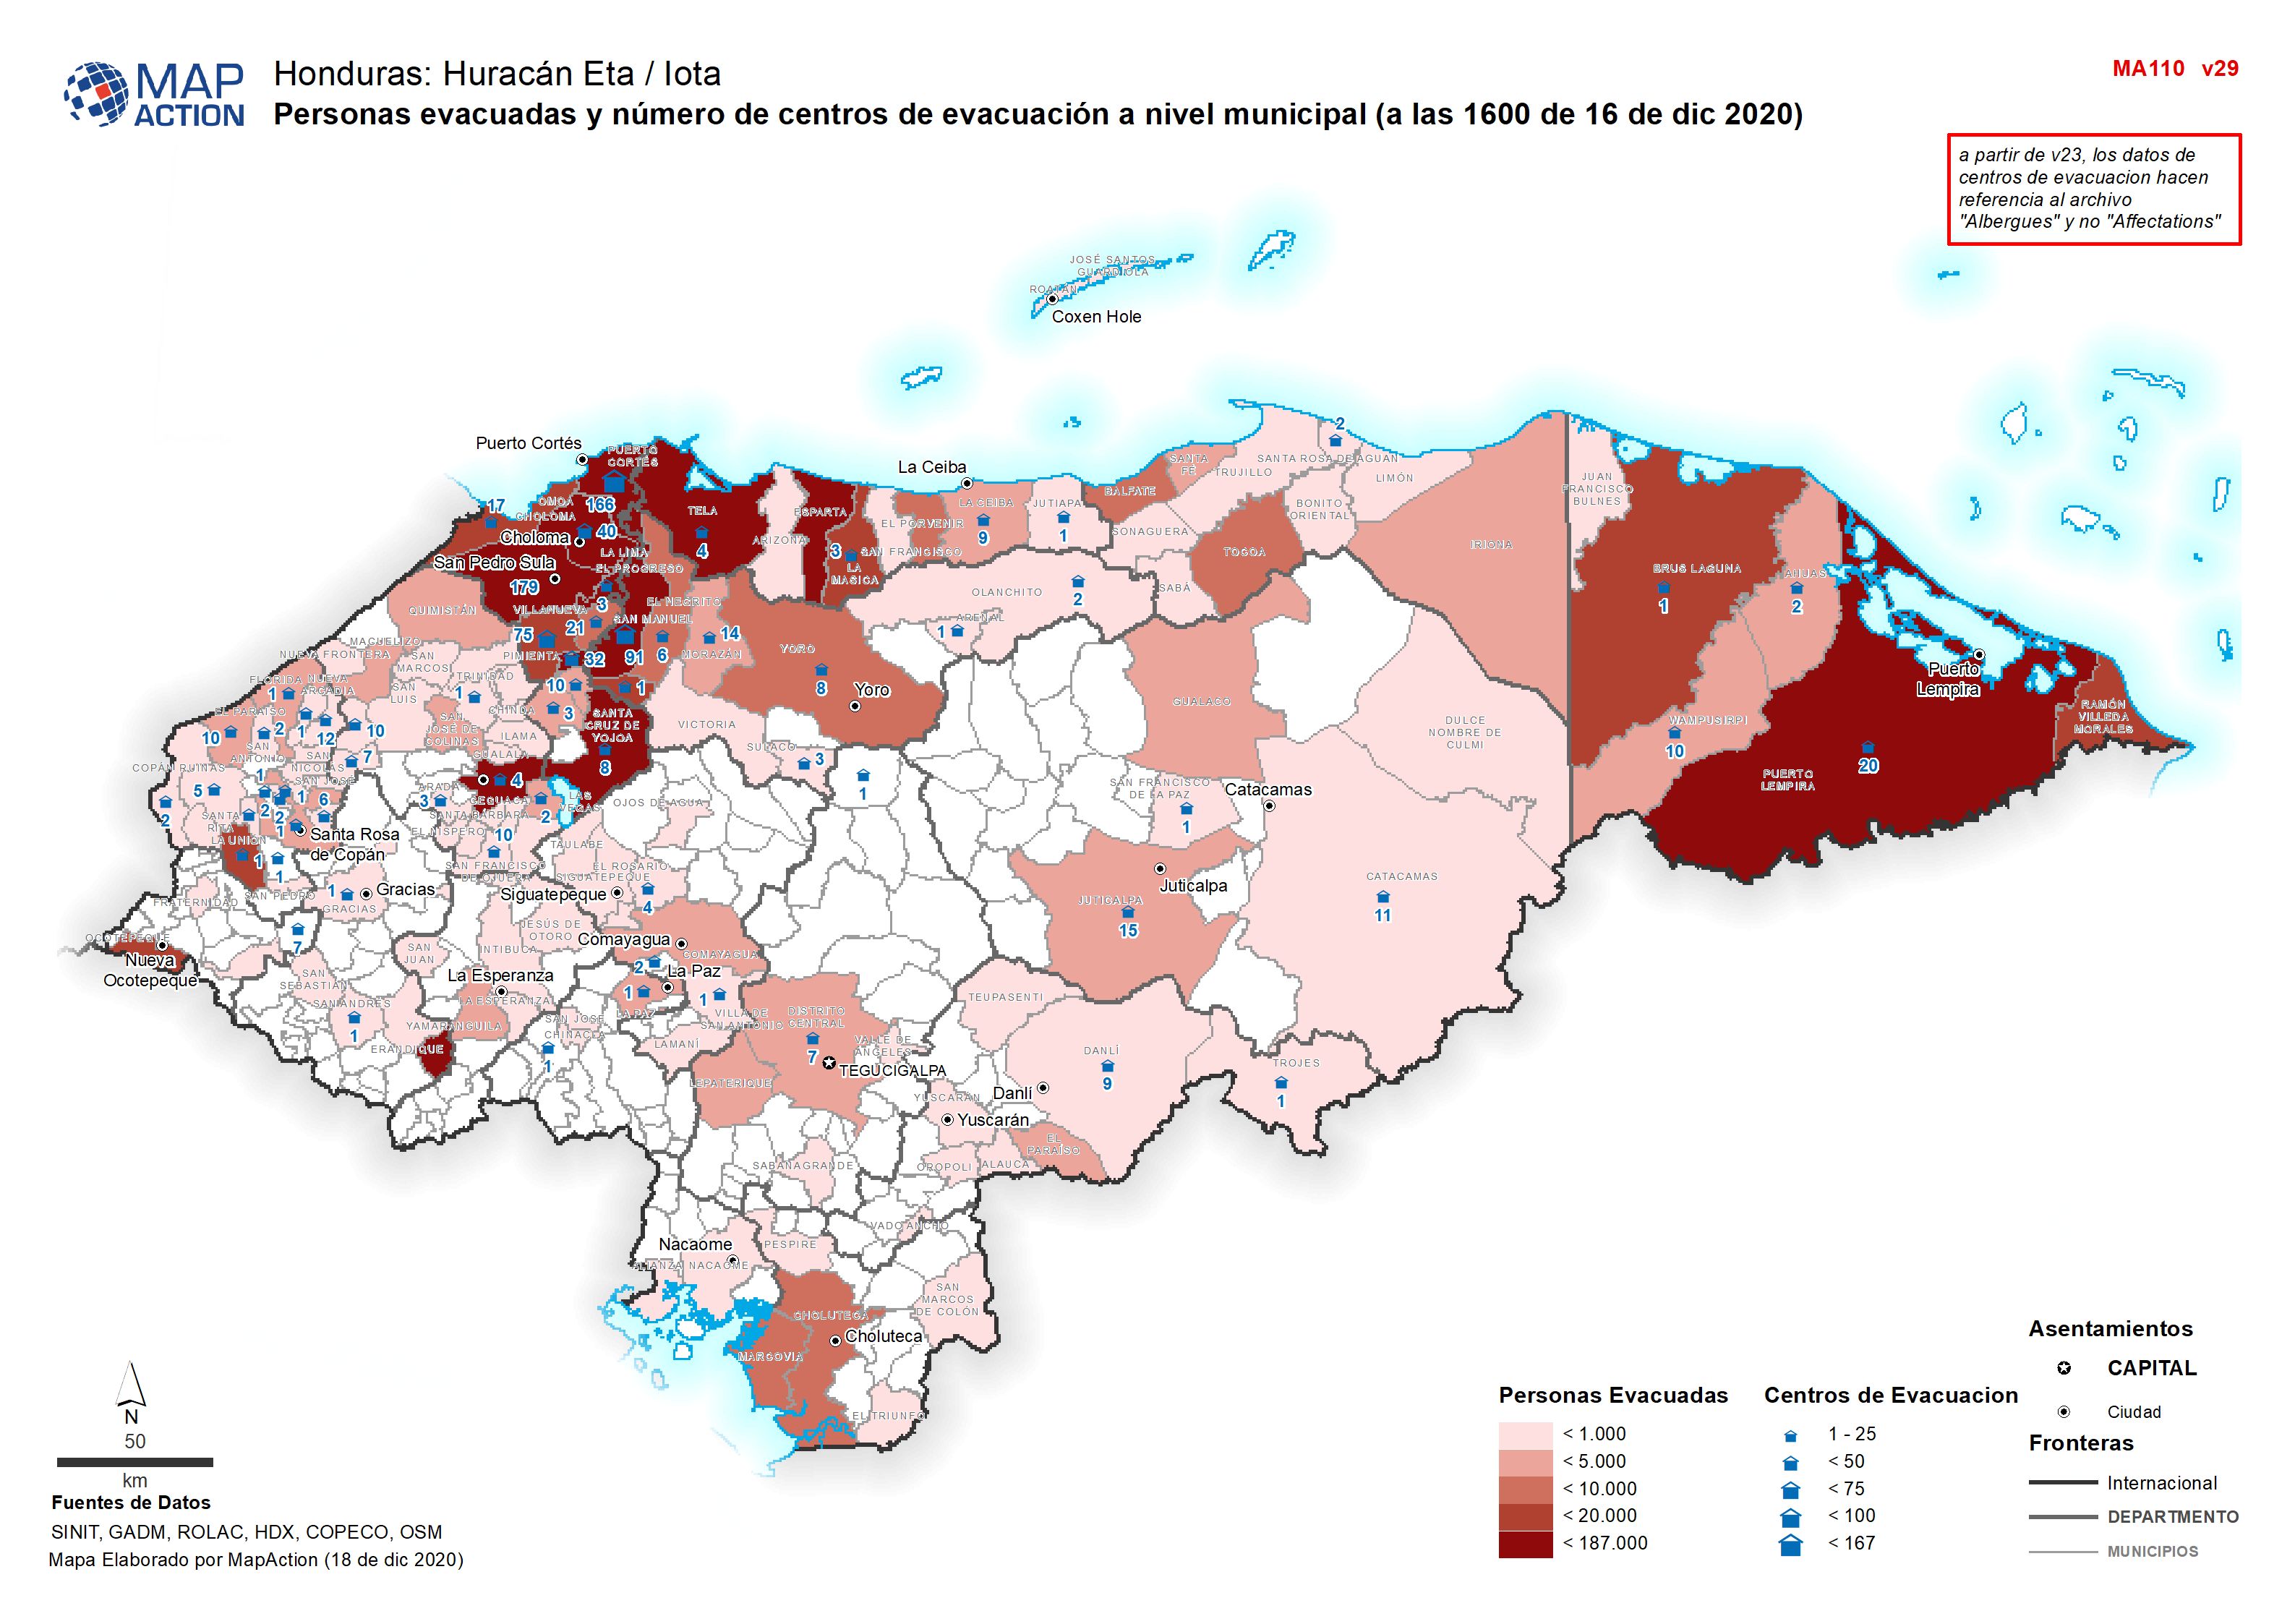
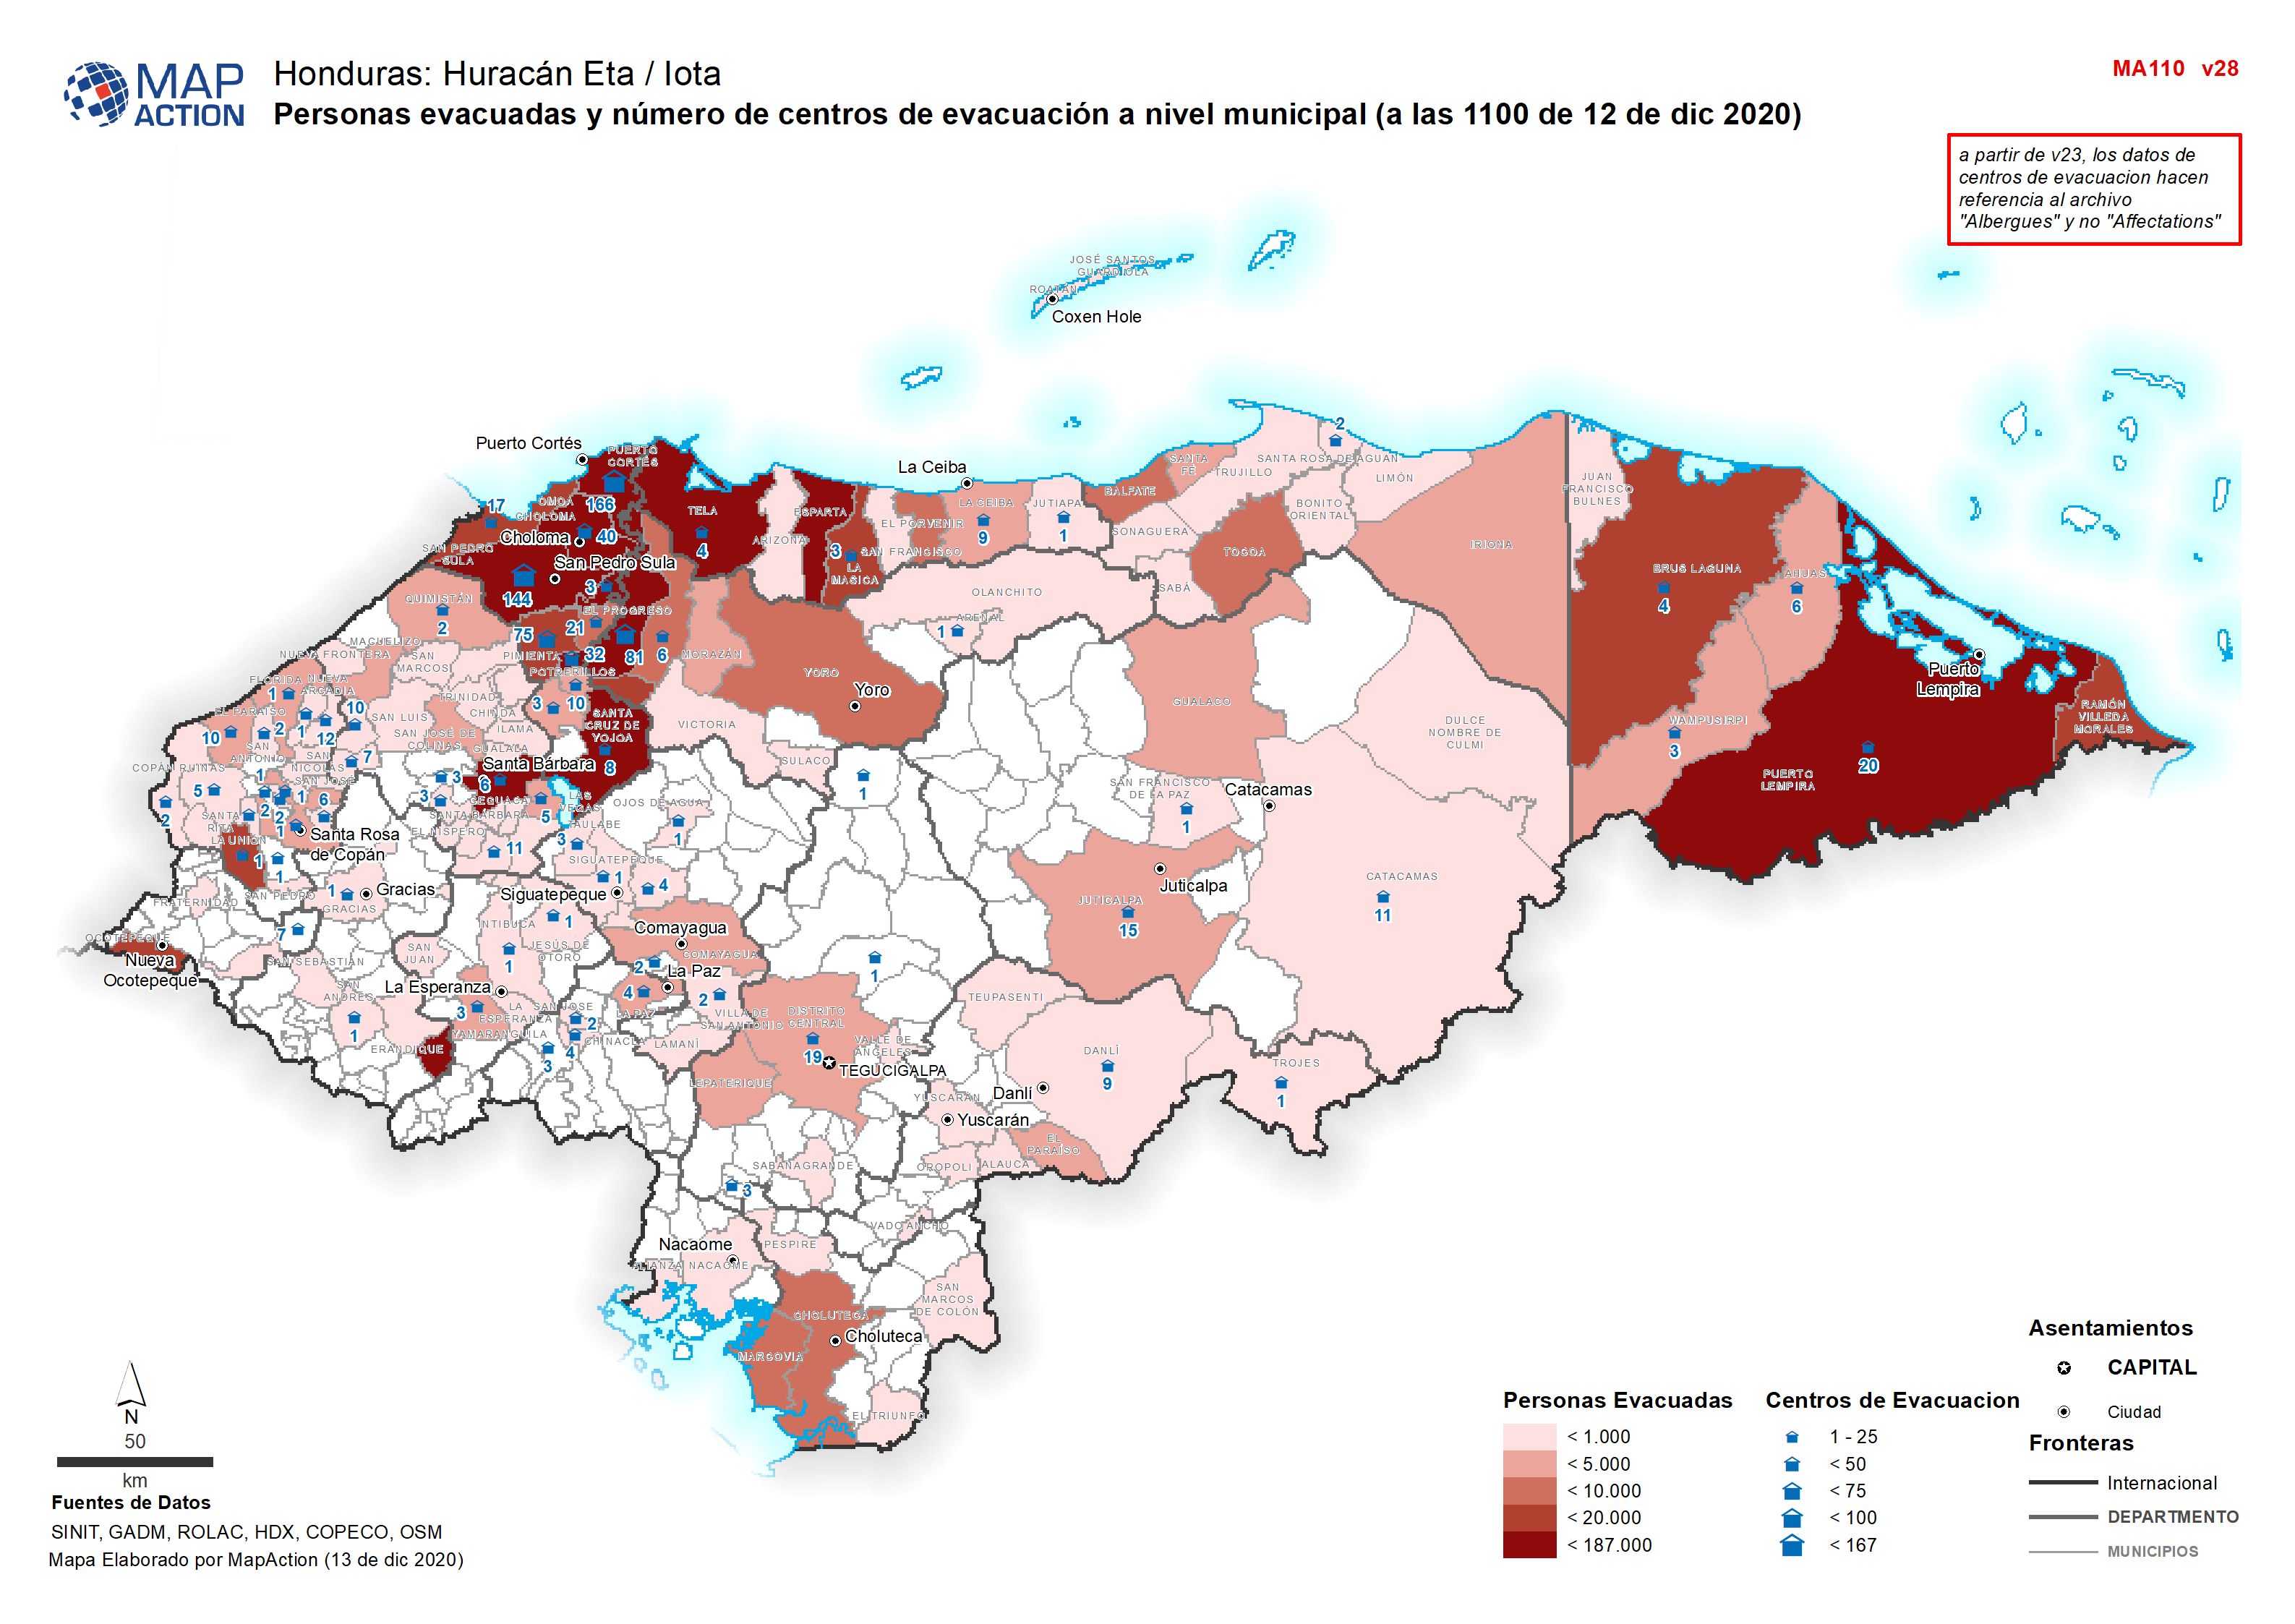
Personas evacuadas y número de centros de evacuación a nivel municipal (a las...
Personas evacuadas y número de centros de evacuación a nivel municipal (a 03 Diciembre 2020 -

Actual and forecasted storm tracks of Tropical Cyclones Yasa and Zazu (as at ...
Map shows the actual and forecasted storm tracks for tropical cyclones Yasa and Zazu. The cone of uncertainty is the area in which the storm track is predicted to move along but... -

-
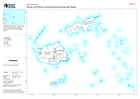
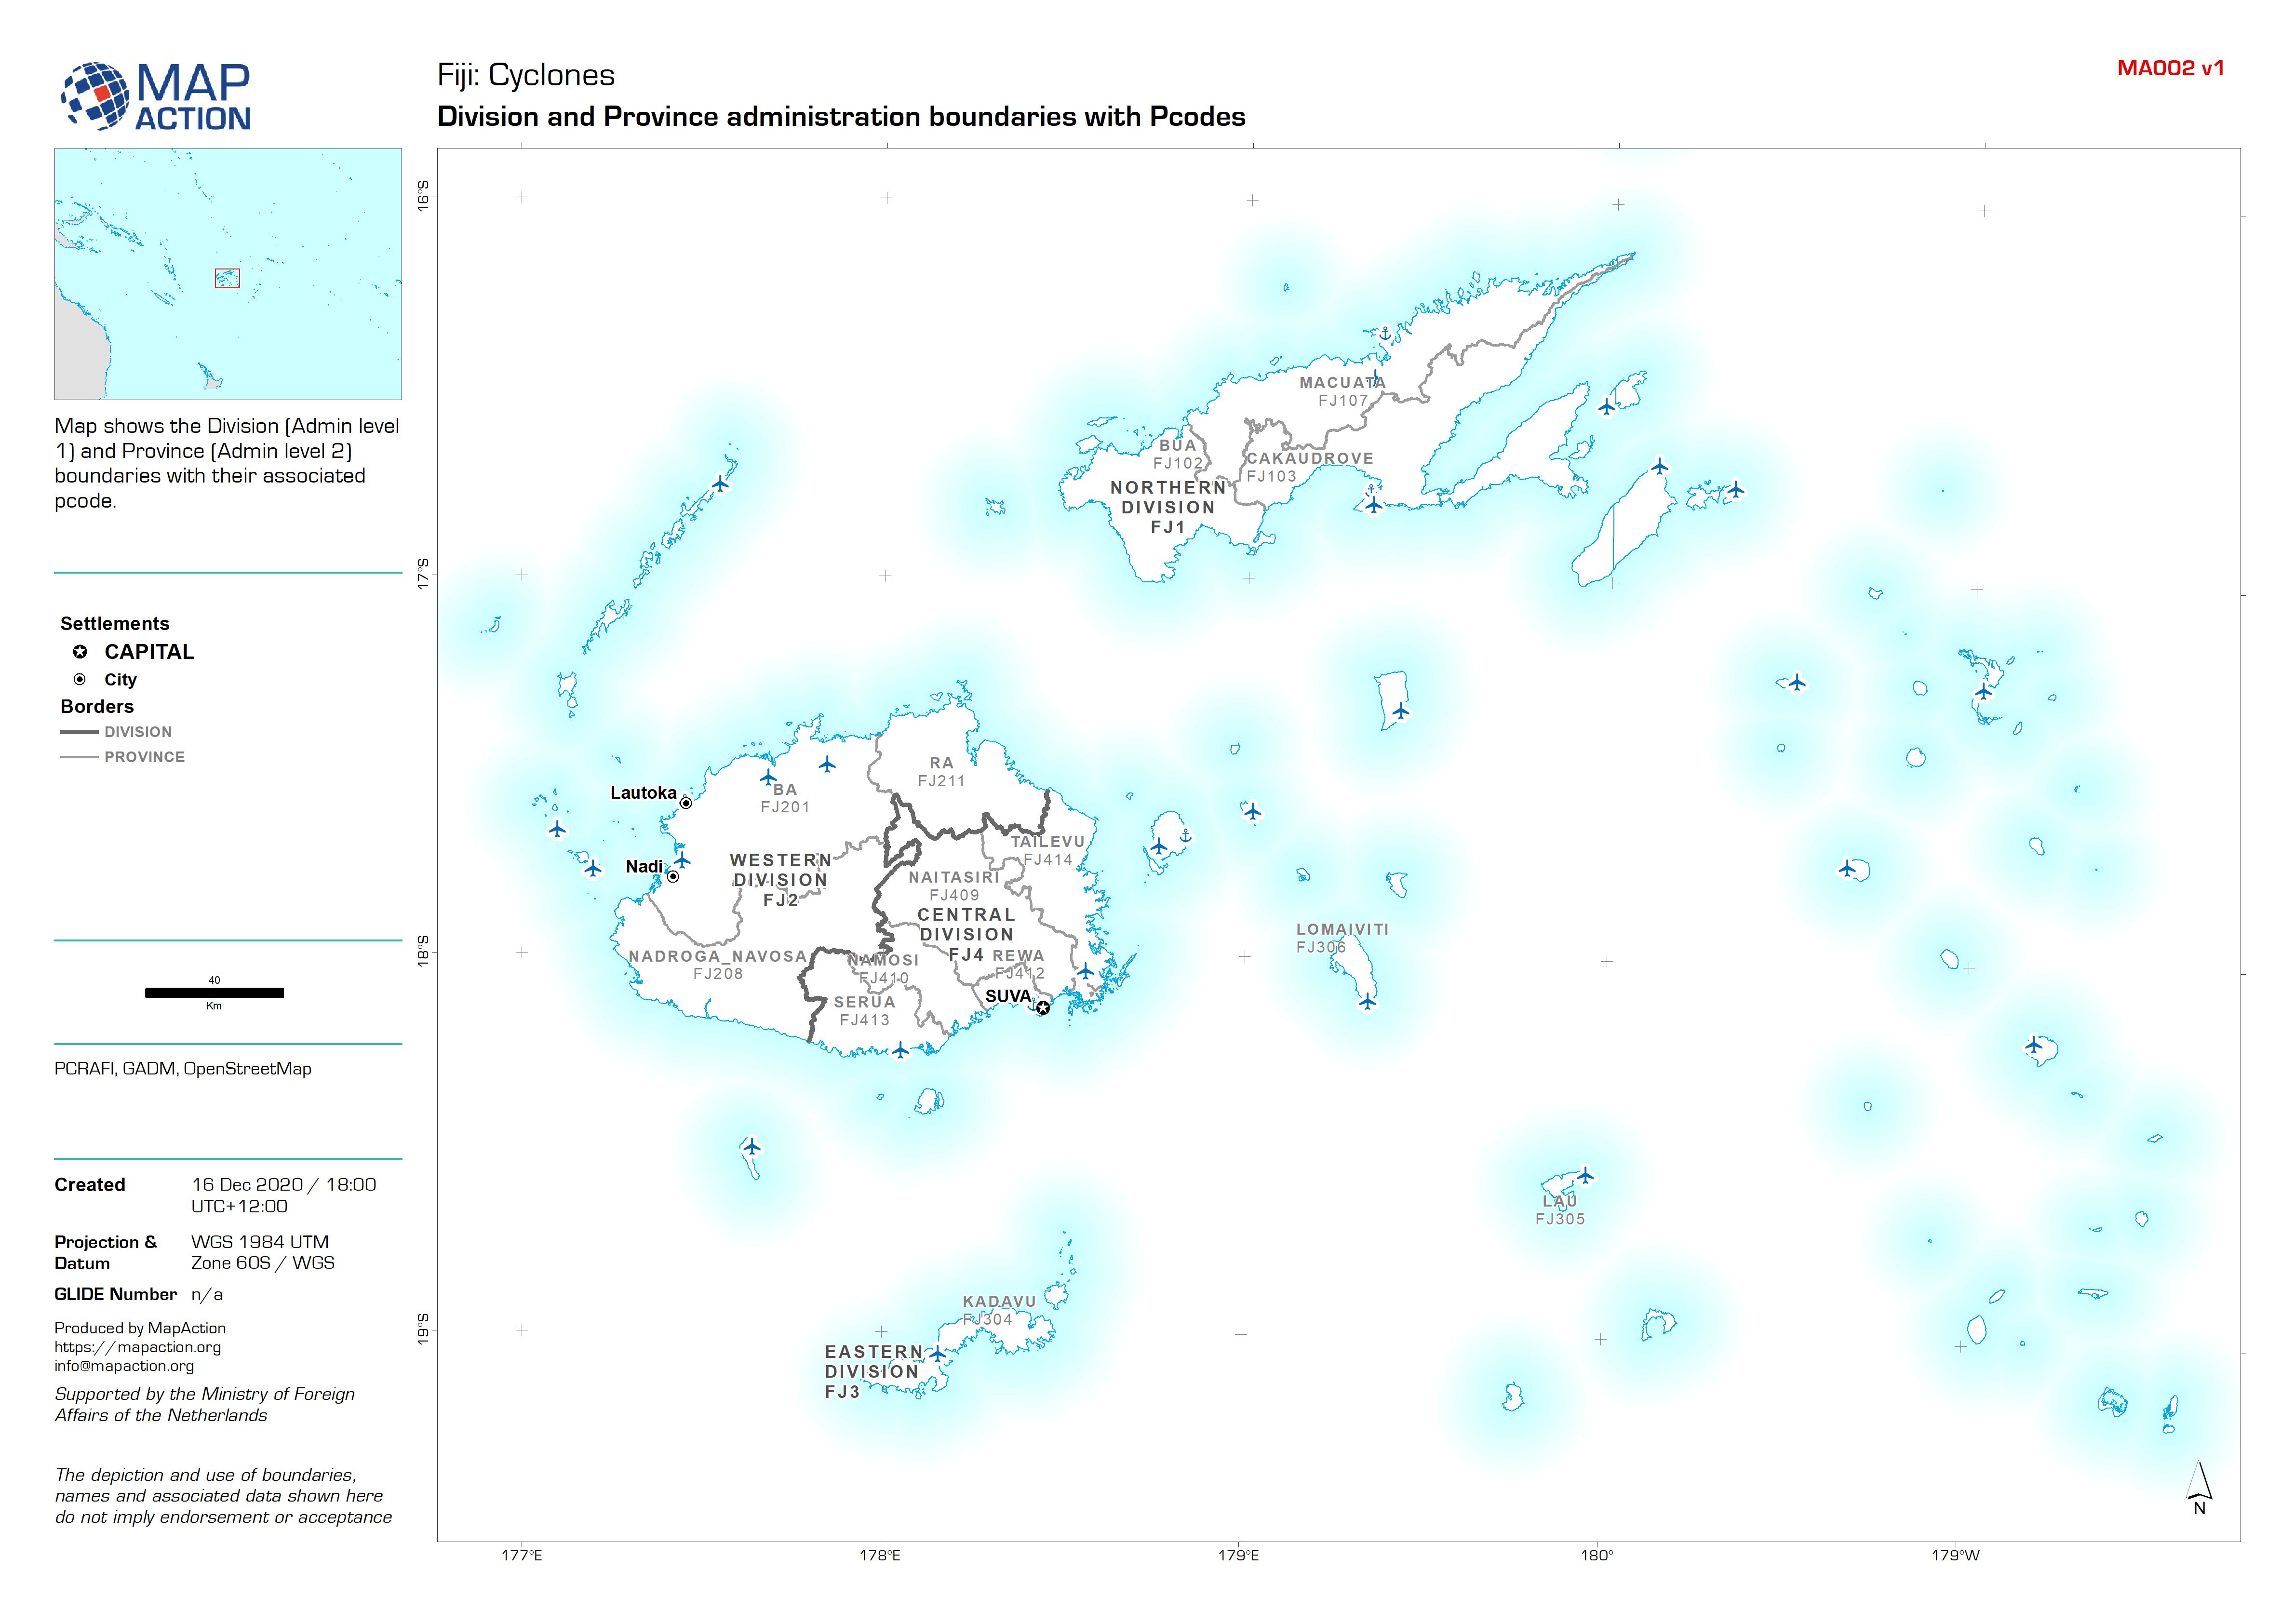
Fiji: Division and Province administration boundaries with Pcodes
Map shows the Division (Admin level 1) and Province (Admin level 2) boundaries with their associated pcode. -

Personas evacuadas y número de centros de evacuación a nivel municipal (a las...
Personas evacuadas y número de centros de evacuación a nivel municipal (a 03 Diciembre 2020 -
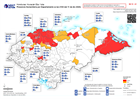
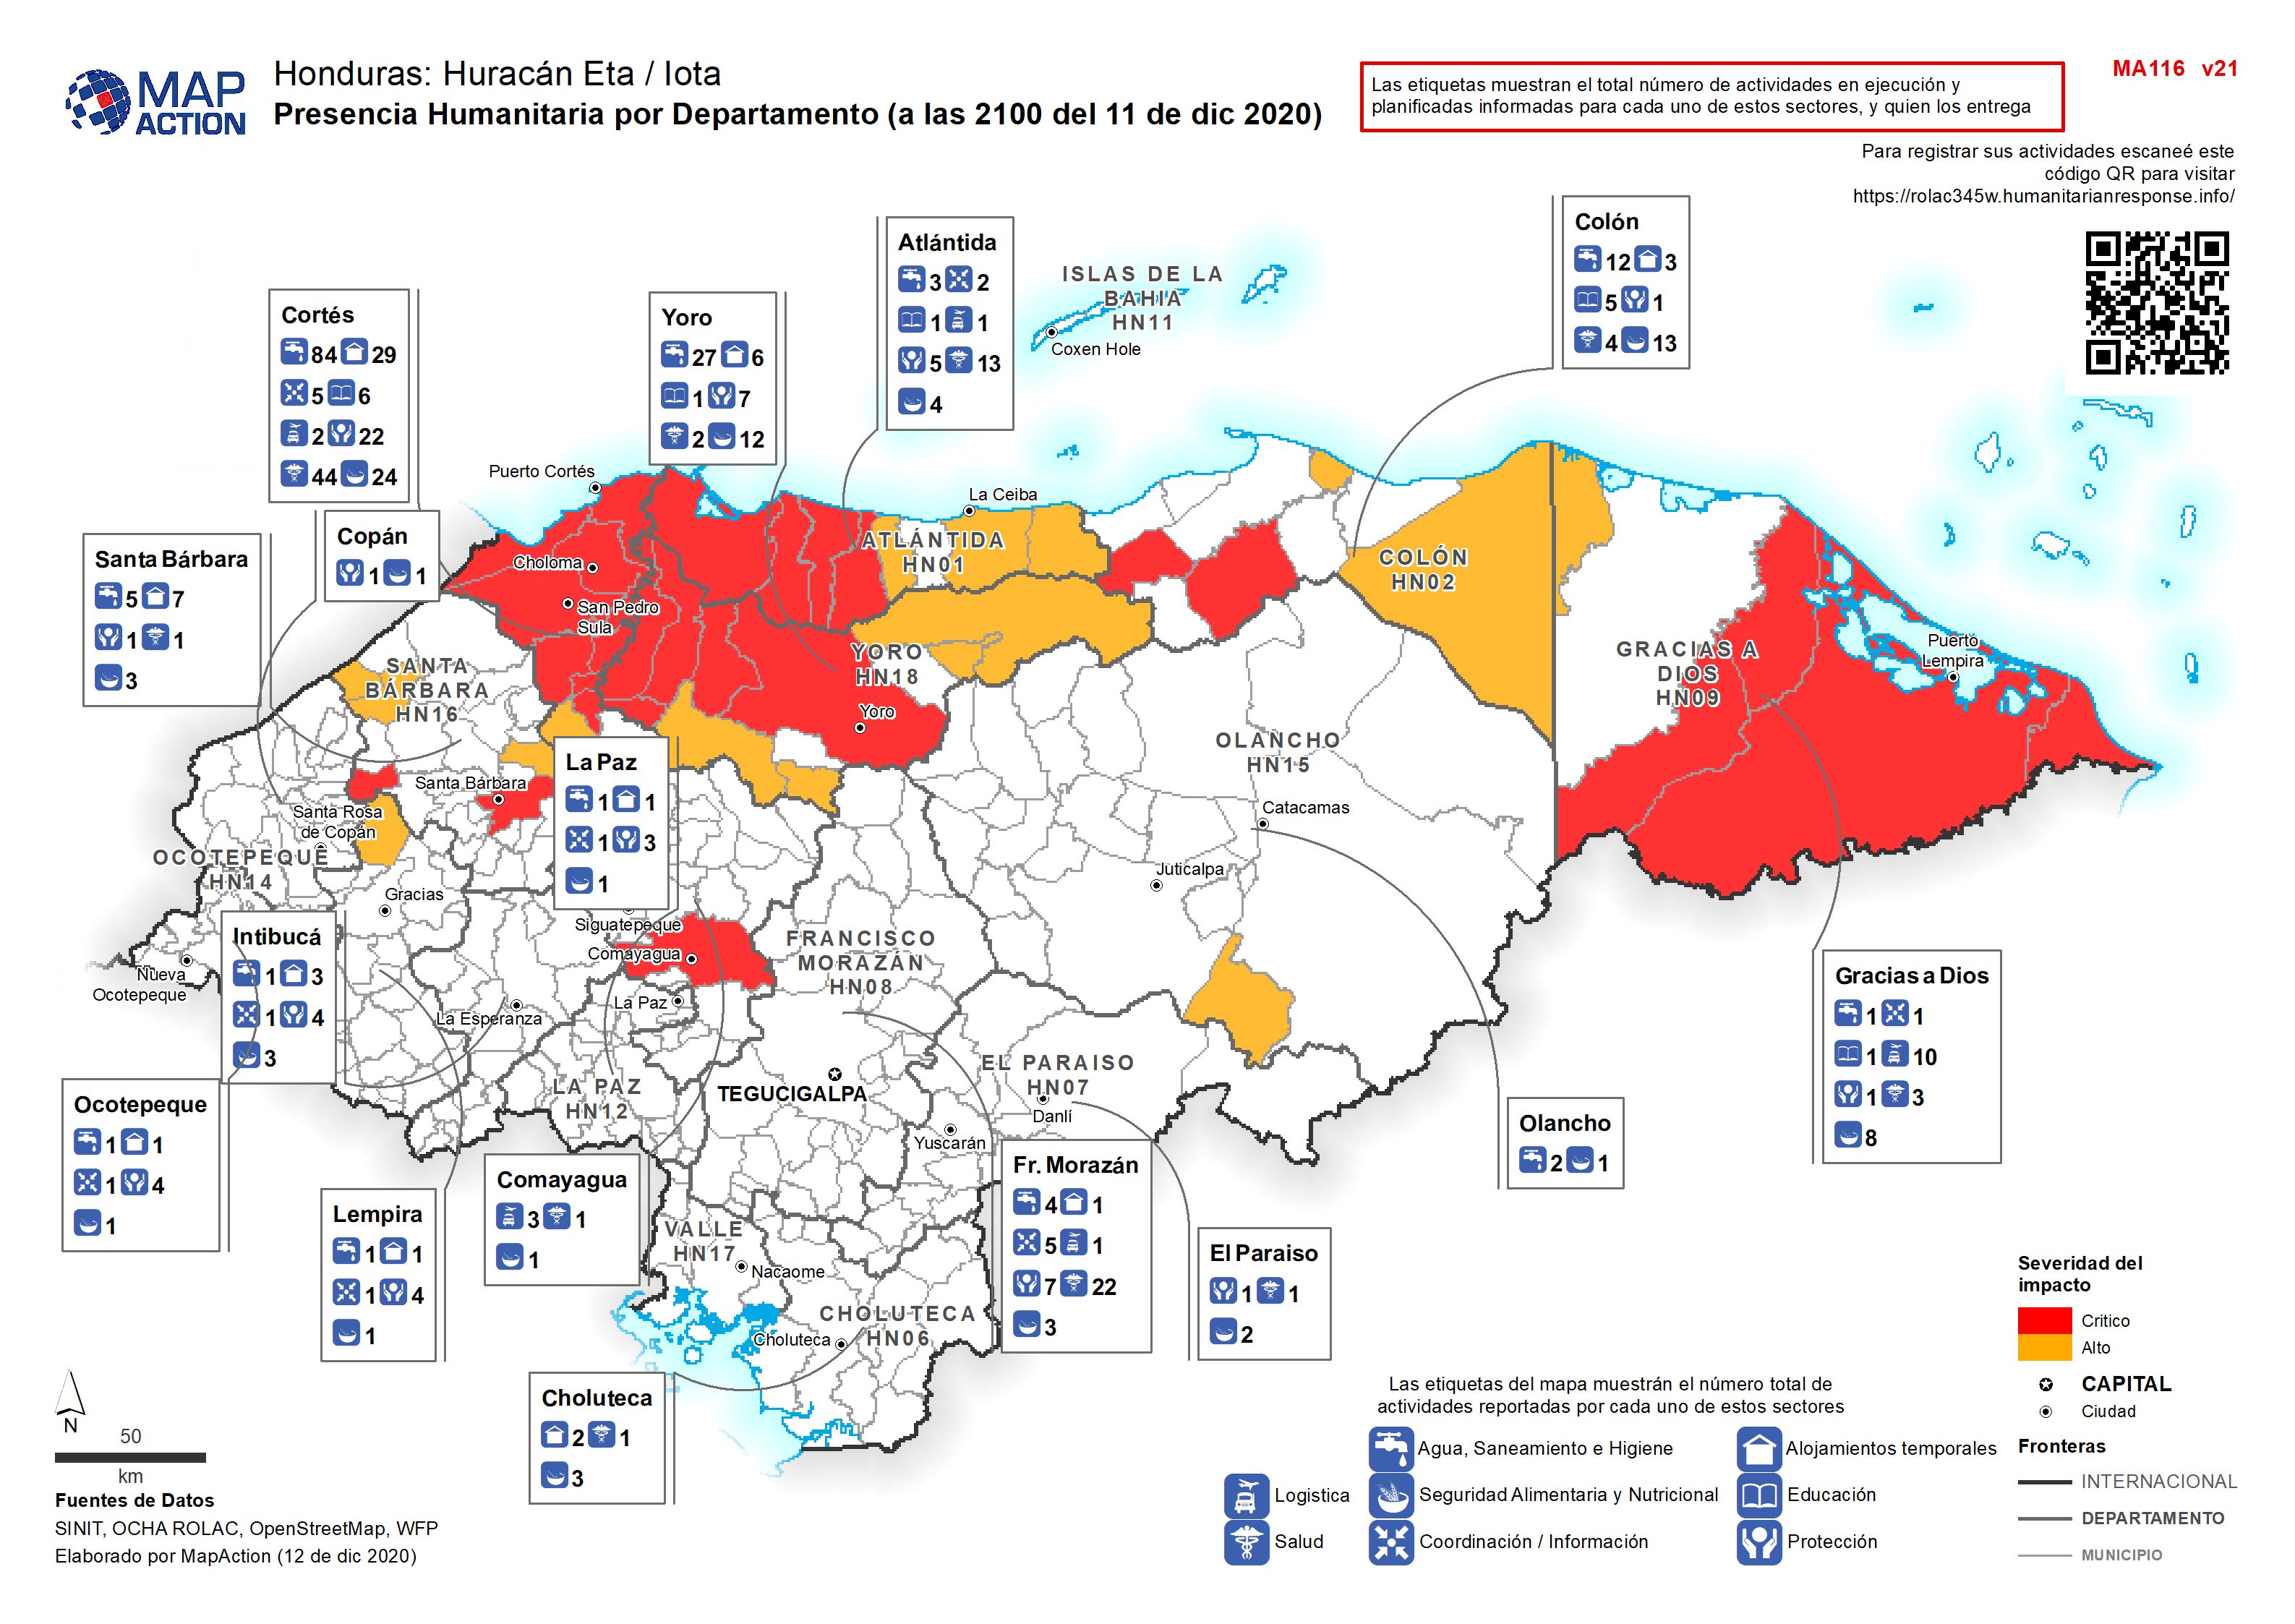
Presencia Humanitaria por Departamento (a las 2100 del 11 de dic 2020)
Map shows the number of reported activities per Sector per Department in Honduras. Critical and High priority response areas are also shown. -

Guatemala: Huracanes ETA e IOTA - Personas afectadas por departamento e inund...
This map shows the flood extents for hurricane Eta and Iota and the affected population at administrative 1 departmental level for Guatemala. -
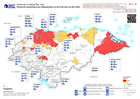
Presencia Humanitaria por Departamento (a las 2100 del 8 de Dic 2020)
Map shows the number of reported activities per Sector per Department in Honduras. Critical and High priority response areas are also shown. -

CENTROAMÉRICA: HURACANES ETA E IOTA - Honduras y Guatemala: personas afectada...
This map shows the storm tracks and flood extents for hurricane Eta and Iota. Across Honduras and in the two most highly affected departments in Guatemala the map shows affected... -

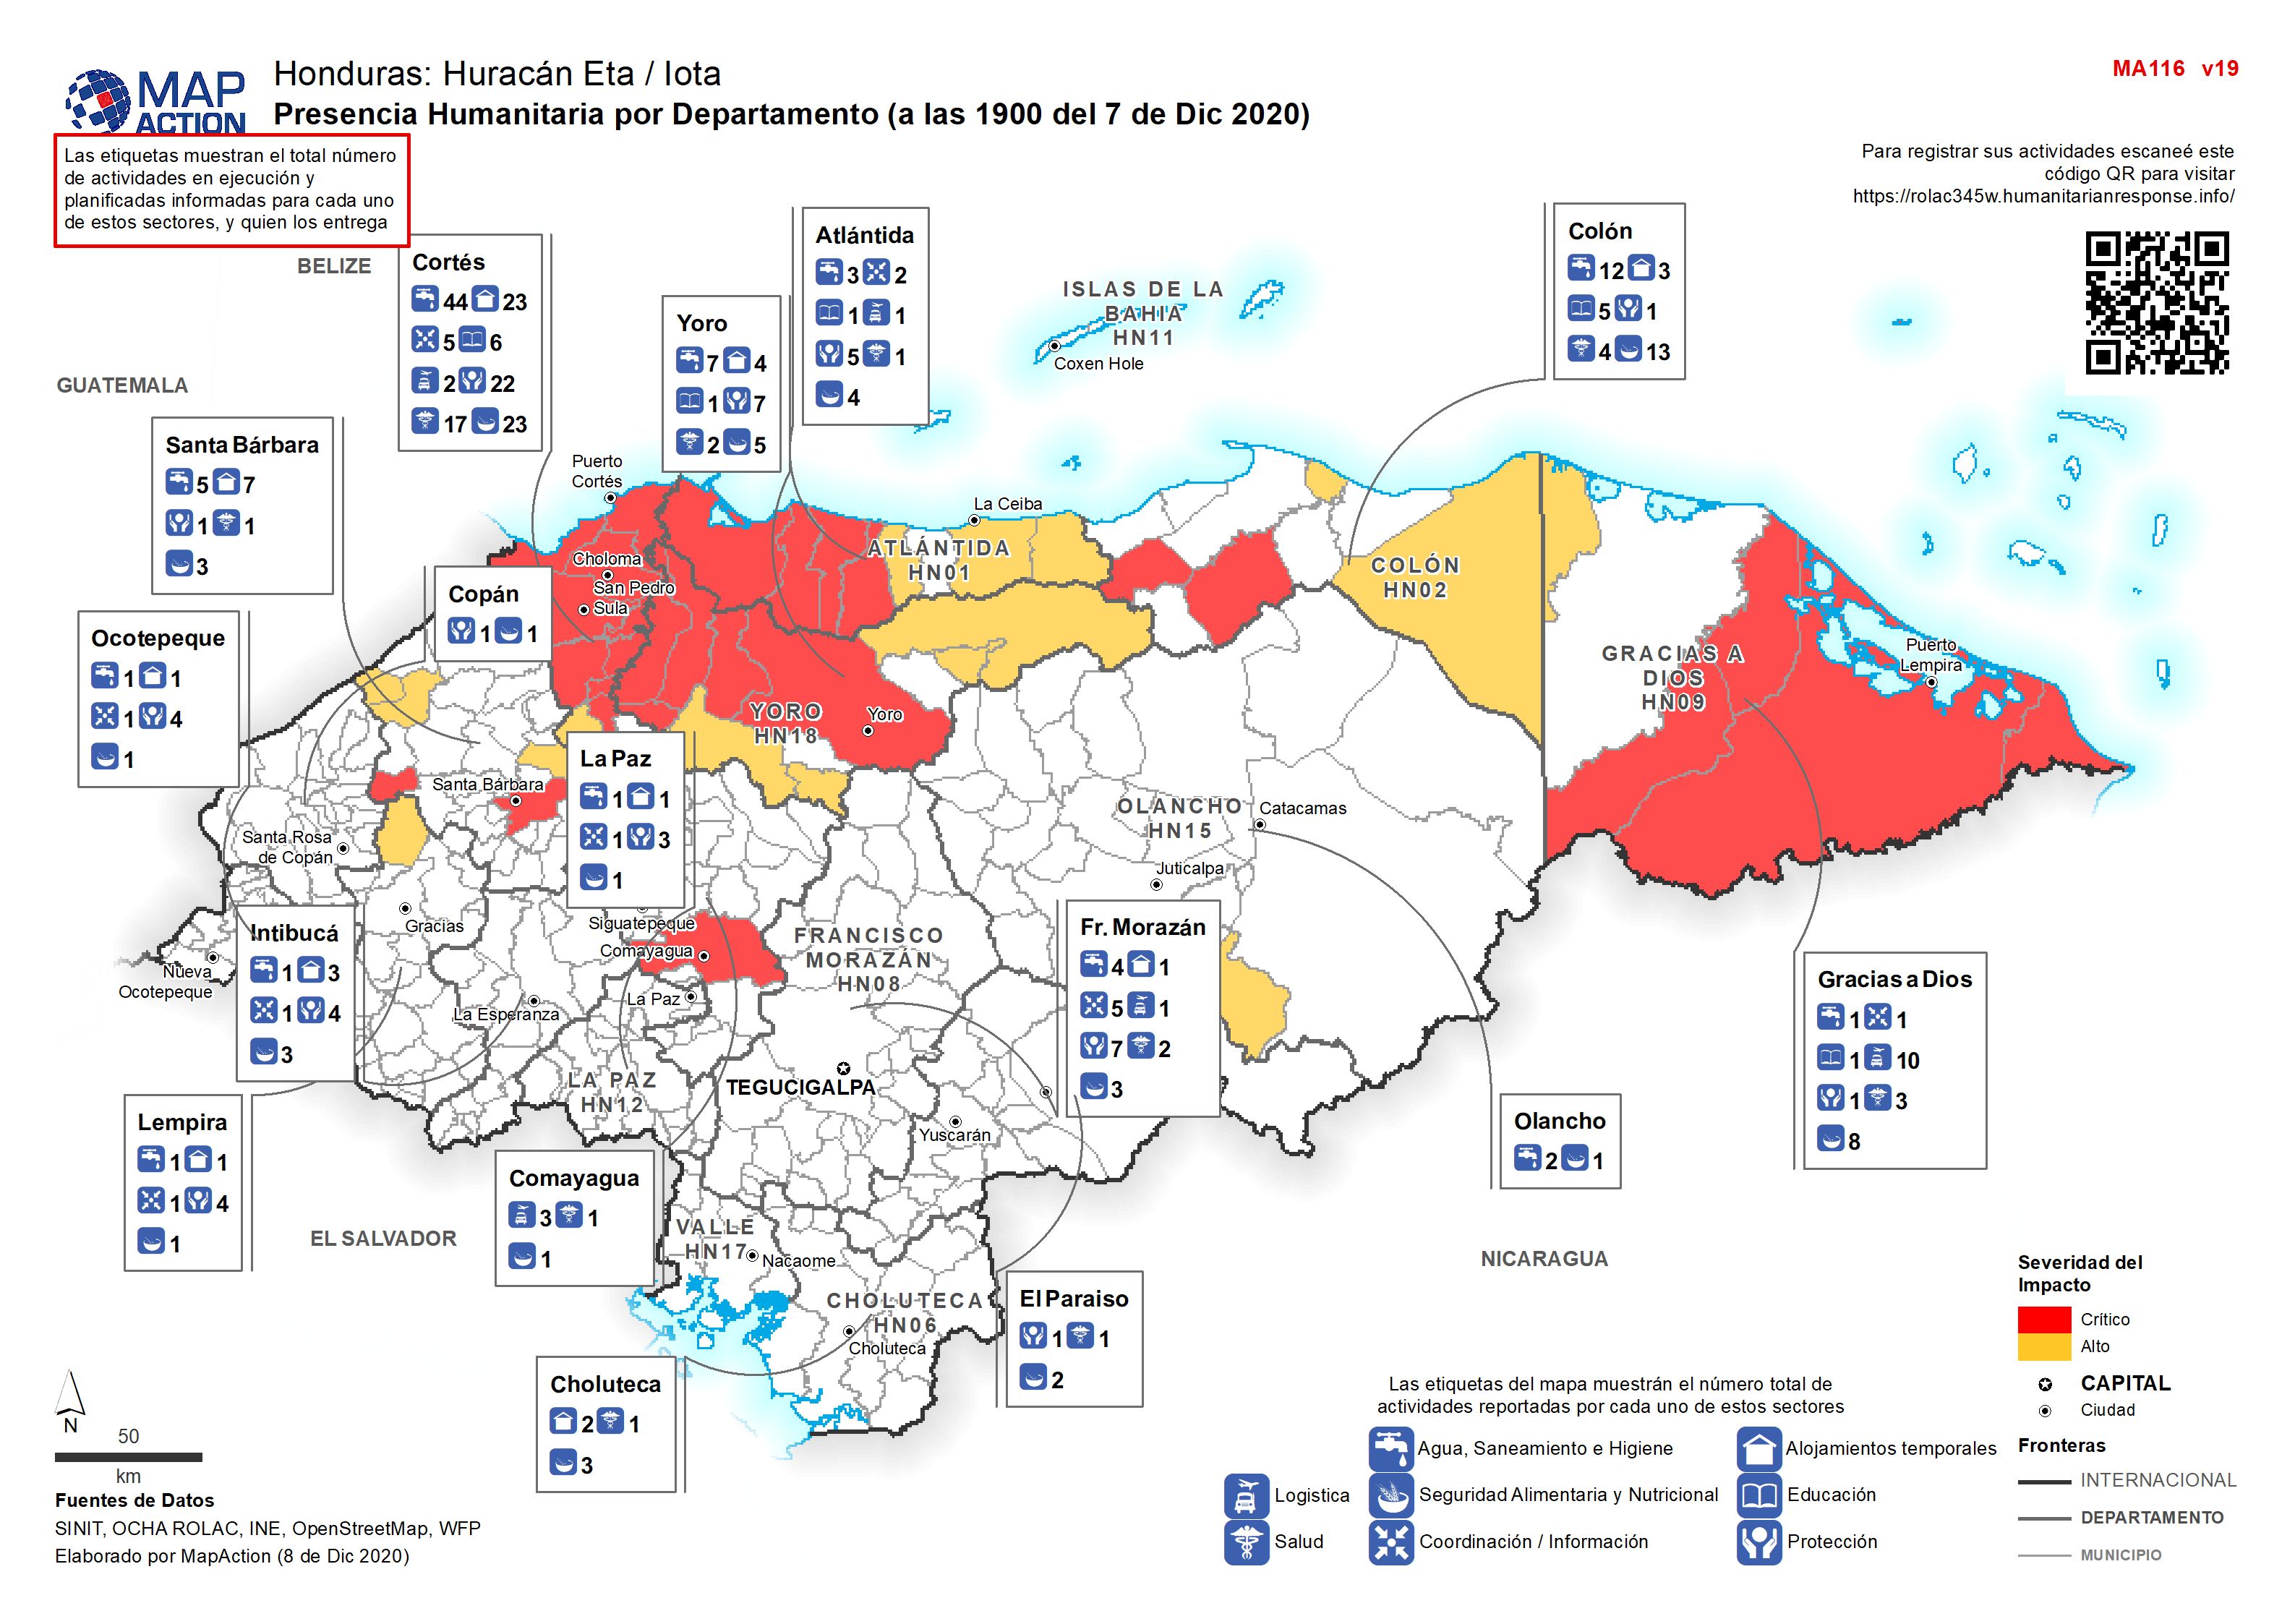
Presencia Humanitaria por Departamento (a las 1900 del 7 de Dic 2020)
Map shows the number of reported activities per Sector per Department in Honduras. Critical and High priority response areas are also shown. -

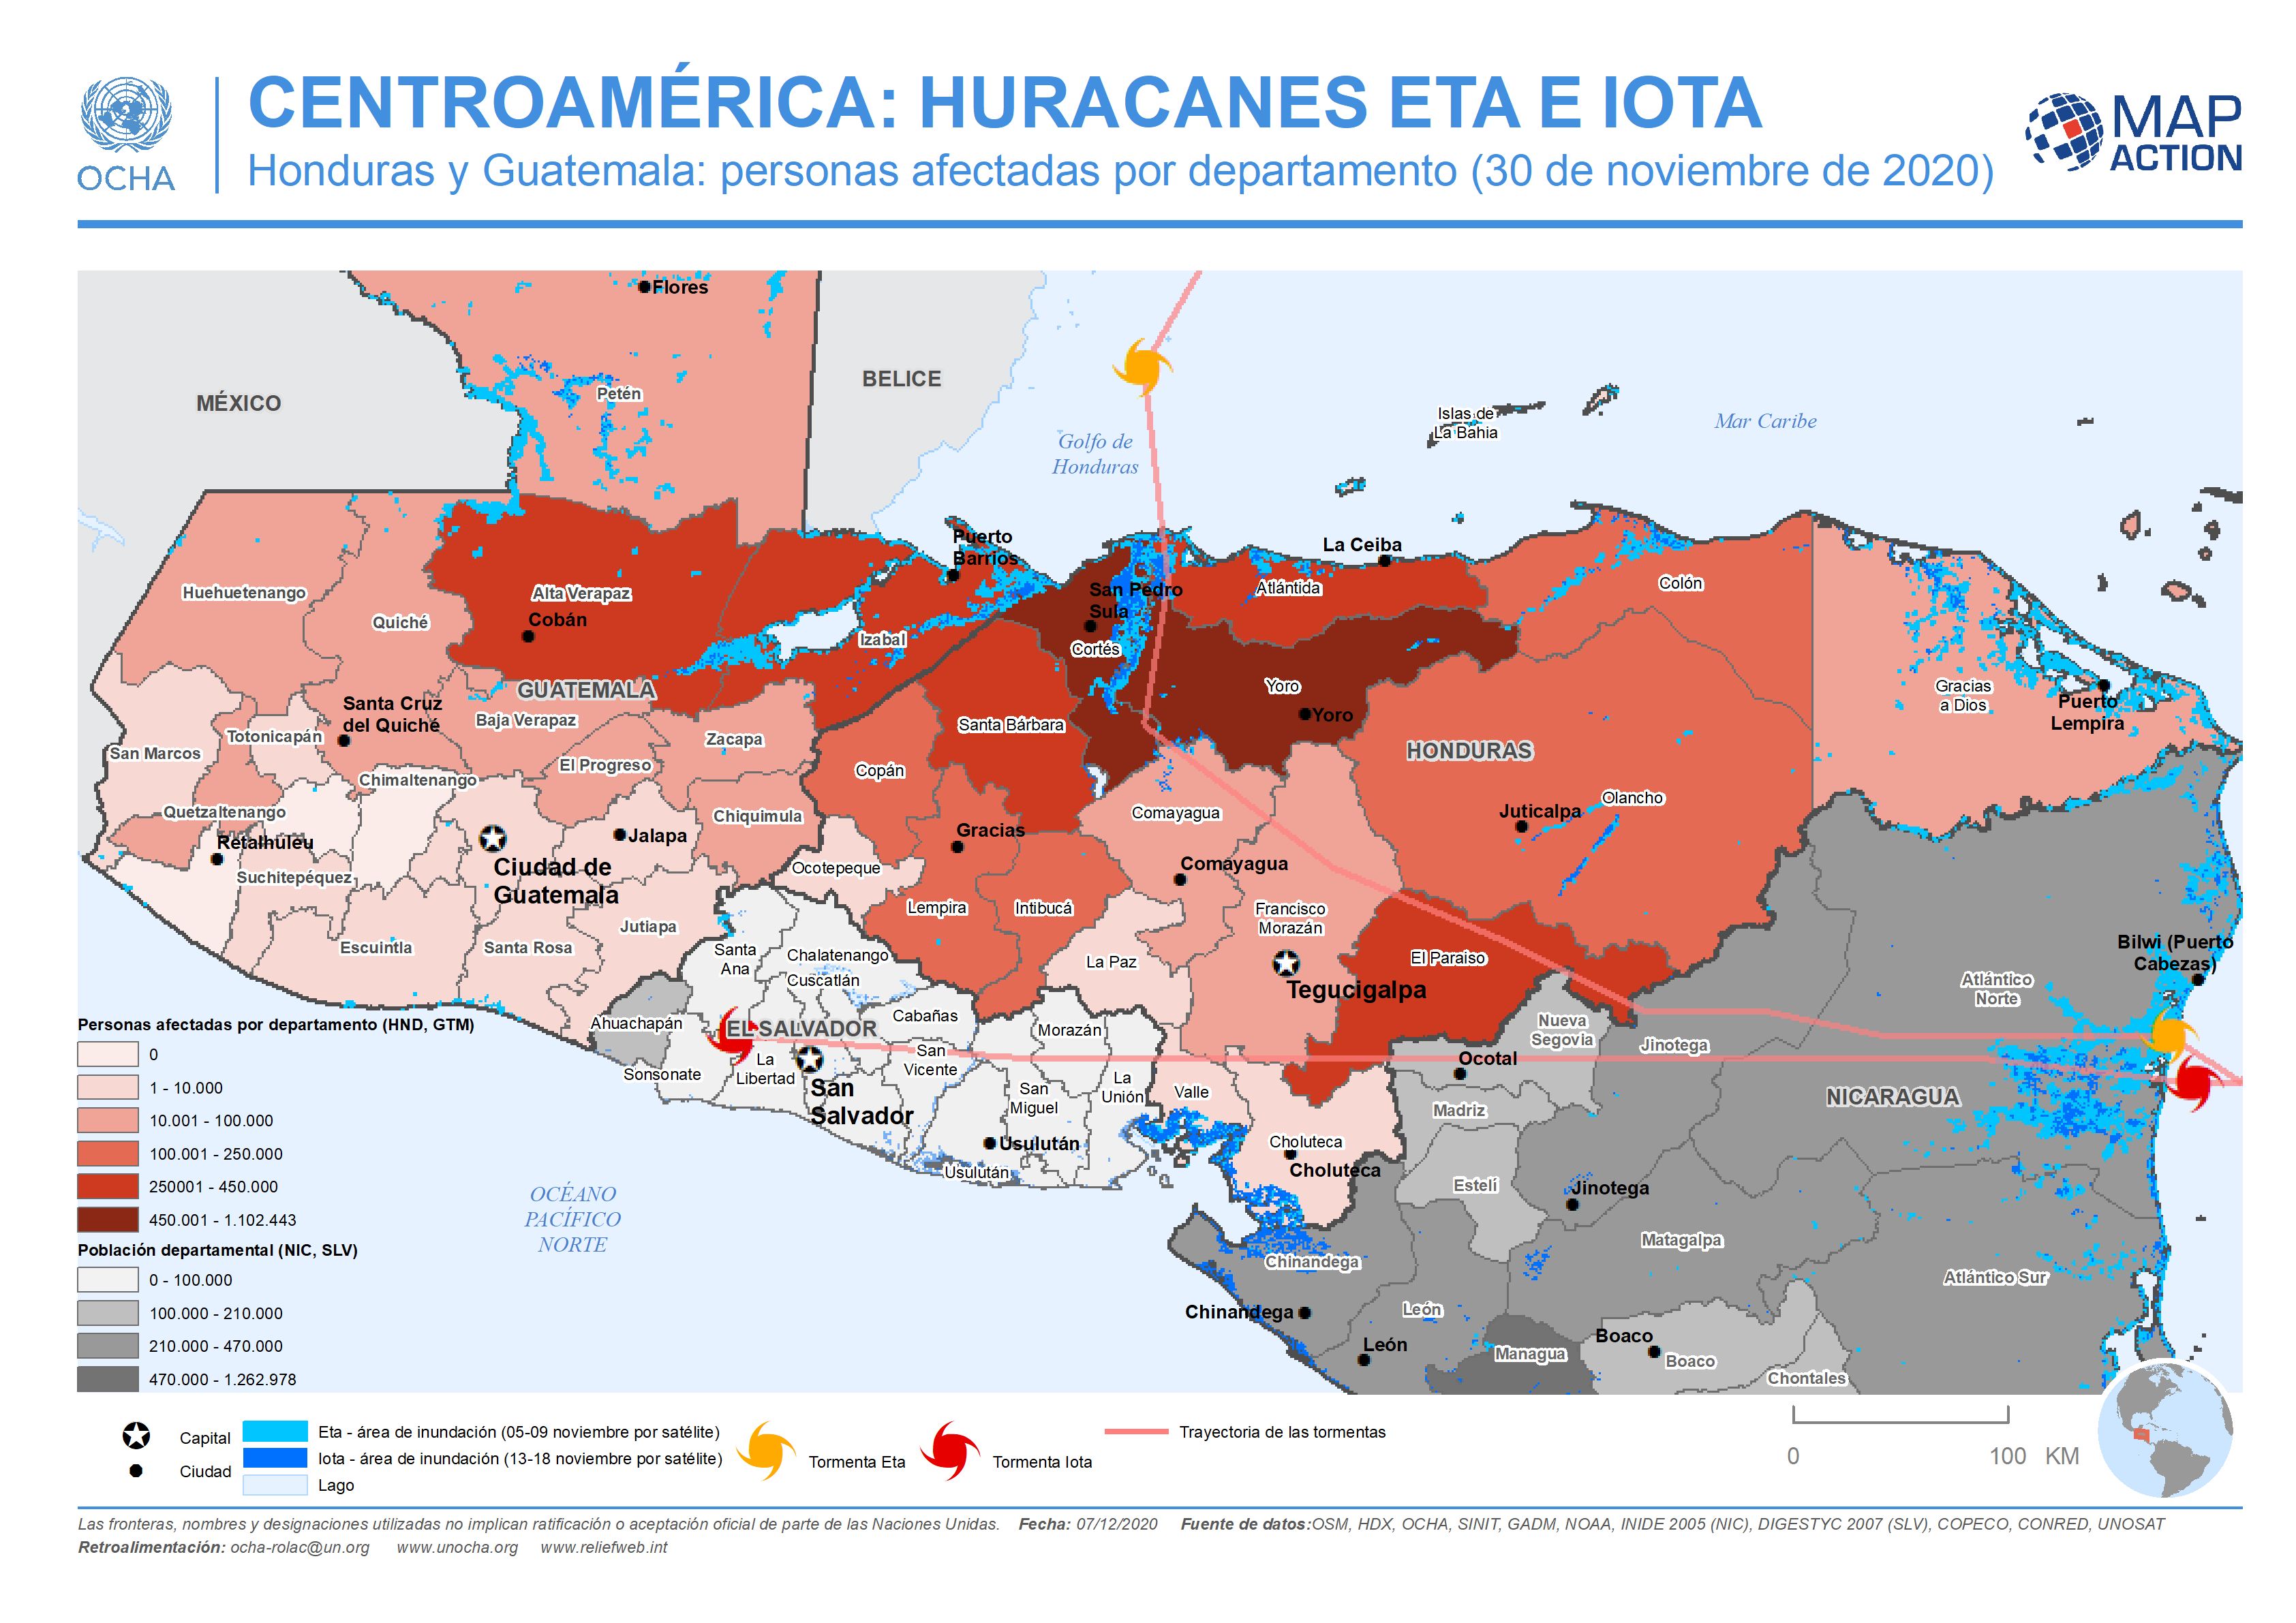
CENTROAMÉRICA: HURACANES ETA E IOTA - Honduras y Guatemala: personas afectada...
This map shows the storm tracks and flood extents for hurricane Eta and Iota. It also shows estimated affected population at administrative 1 departmental level for Honduras and... -
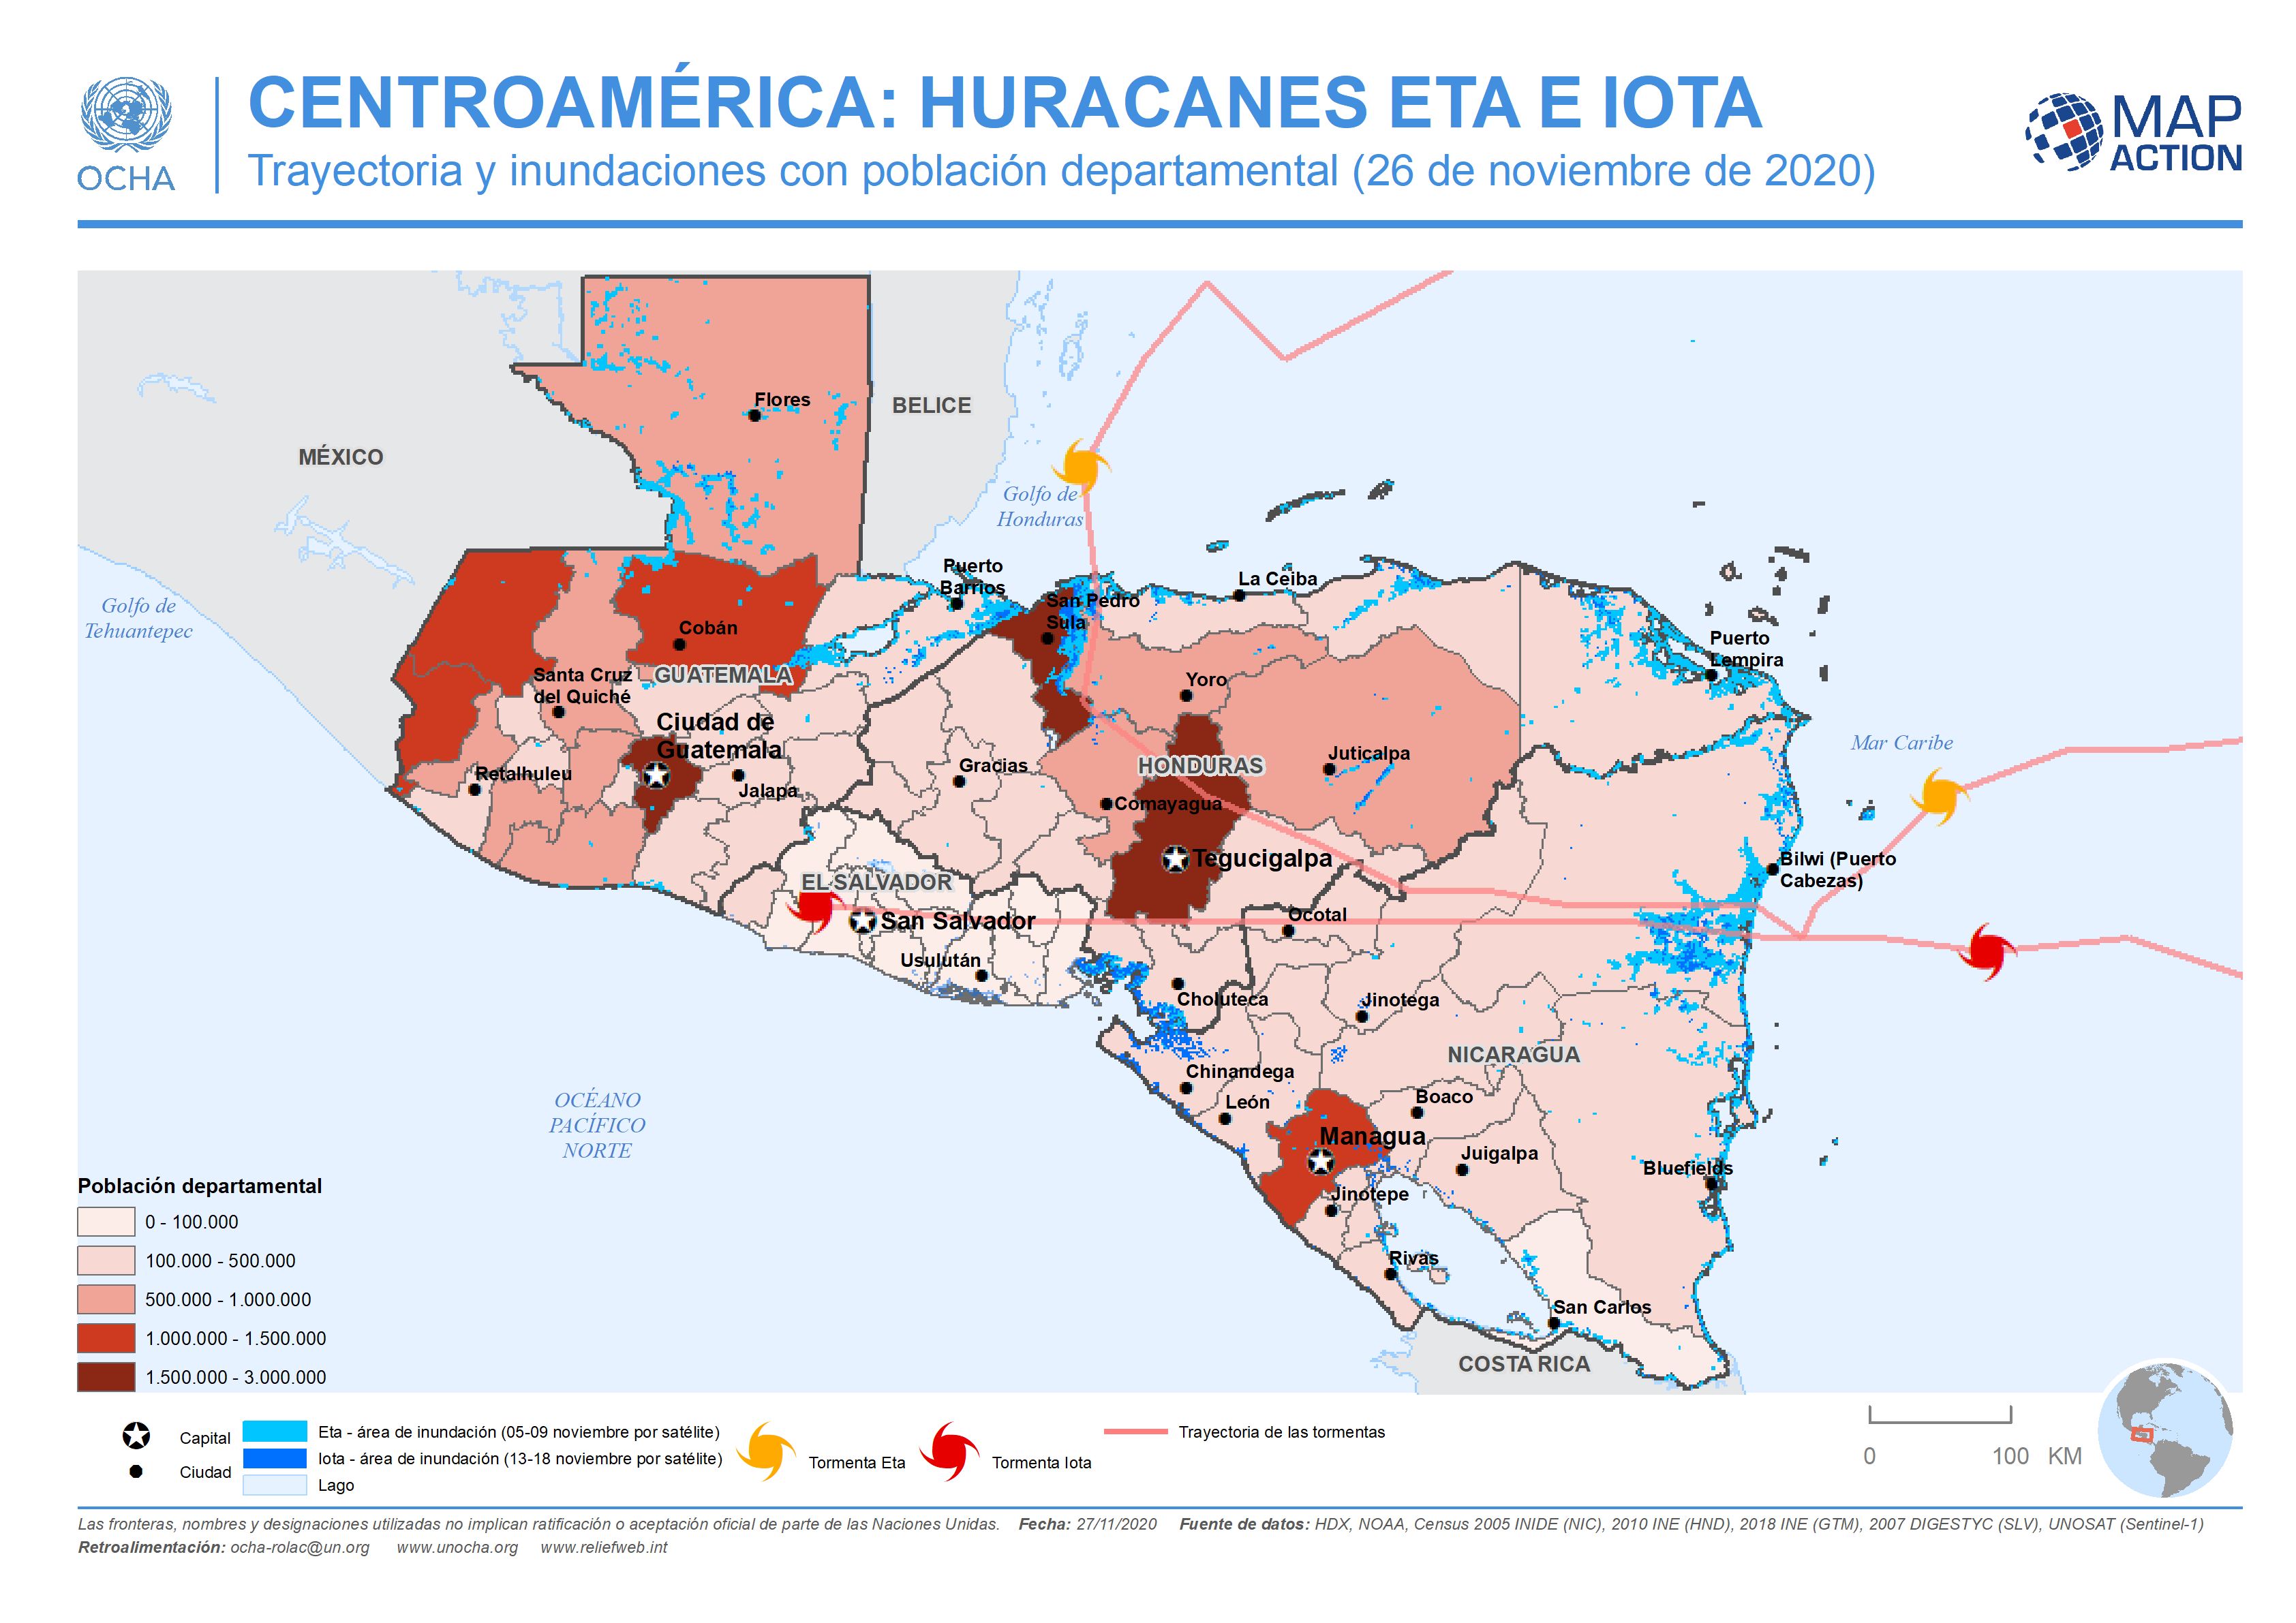
CENTROAMÉRICA: HURACANES ETA E IOTA - Trayectoria y inundaciones con població...
This map shows the storm tracks and flood extents for hurricane Eta and Iota, with baseline administrative 1 level departmental population figures across the affected region... -

CENTRAL AMERICA: HURRICANES ETA AND IOTA Honduras and Guatemala: affected pop...
This map shows the storm tracks and flood extents for hurricane Eta and Iota. It also shows estimated affected population figures at administrative 1 departmental level for... -

HONDURAS: TORMENTAS TROPICALS ETA - Noroeste municipios afectados y personas ...
This map shows the affected administration level 2 municipalities for north-west Honduras, population by 30m square (facebook), flood extents (satellite data from 5-9 and 13-17... -

Honduras: Tormentas Tropicals ETA - Noroeste municipios afectados y personas ...
This map shows the affected administration level 2 municipalities for north-west Honduras, population by 30m square (facebook), flood extents (satellite data from 5-9 and 13-17... -

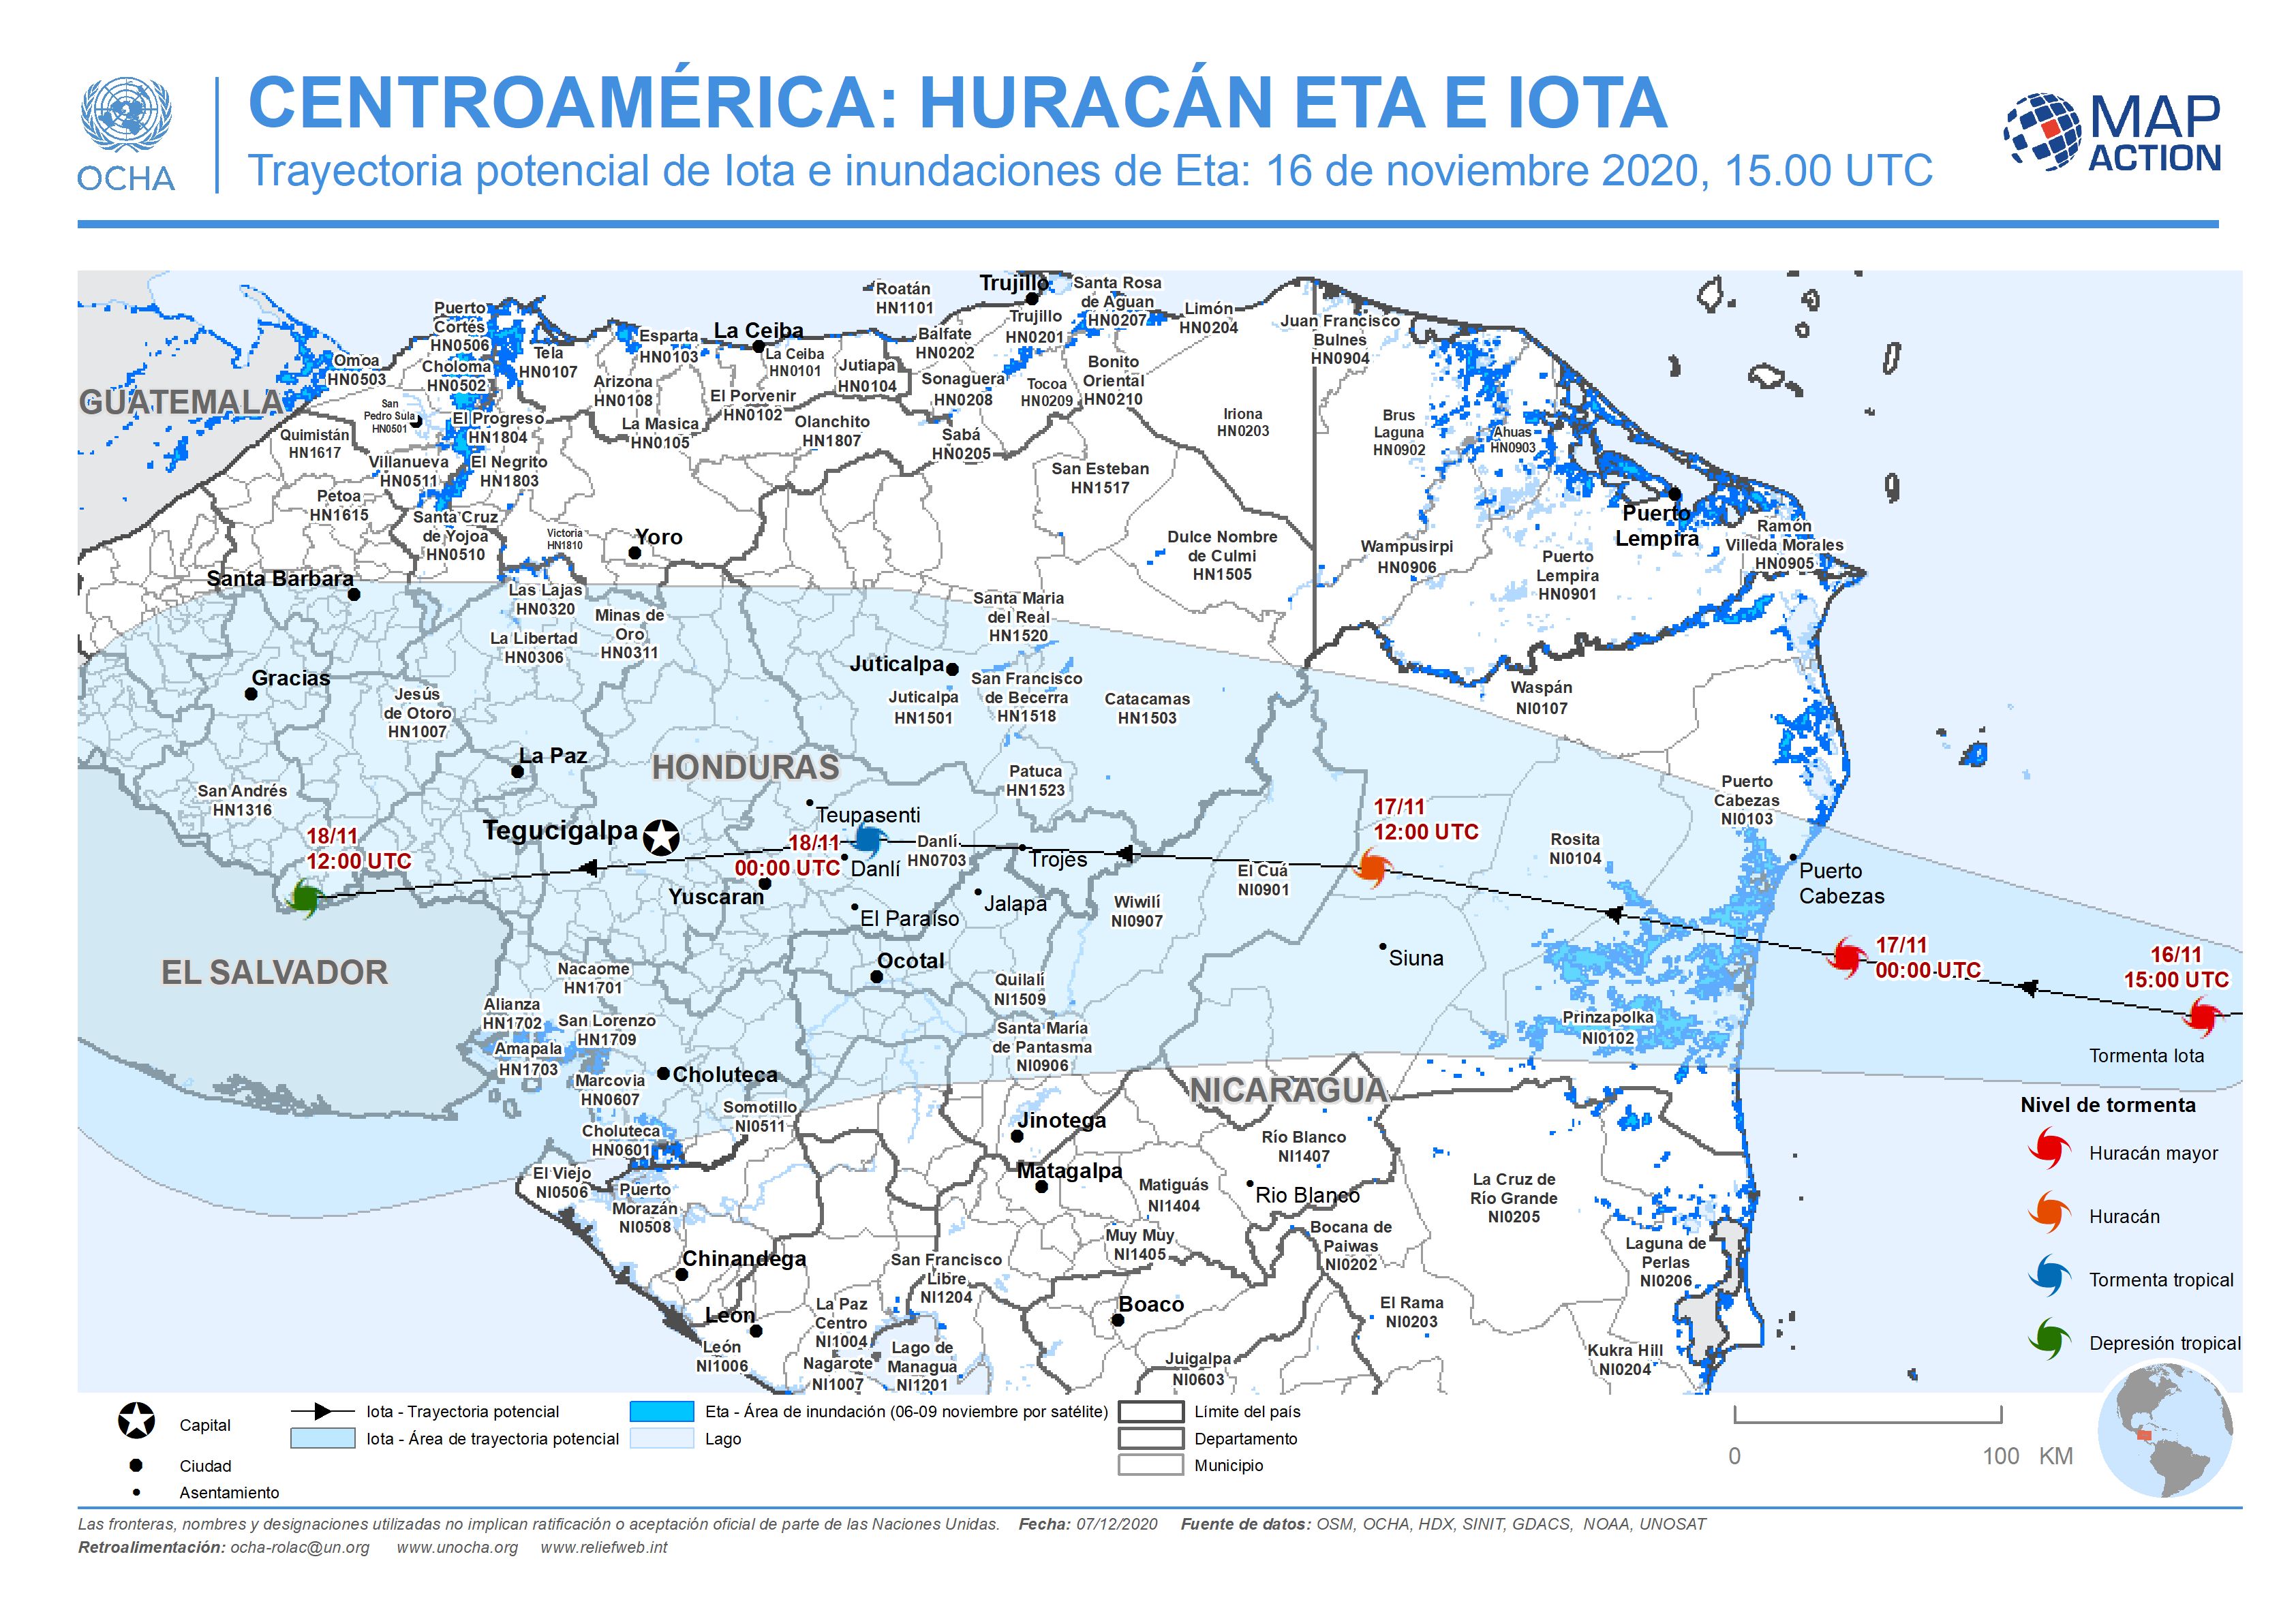
CENTROAMÉRICA: HURACÁN ETA E IOTA - Trayectoria potencial de Iota e inundacio...
This map shows the affected administration level 2 municipalities for Nicaragua and Honduras by flooding from hurricane Eta, with predicted path and potential path cone for... -

CENTROAMÉRICA: HURACÁN IOTA - Trayectoria potencial y poblaciones departament...
This map shows the potentially affected administration level 1 departments, with departmental population for Nicaragua and Honduras, and the predicted hurricane path cone. -
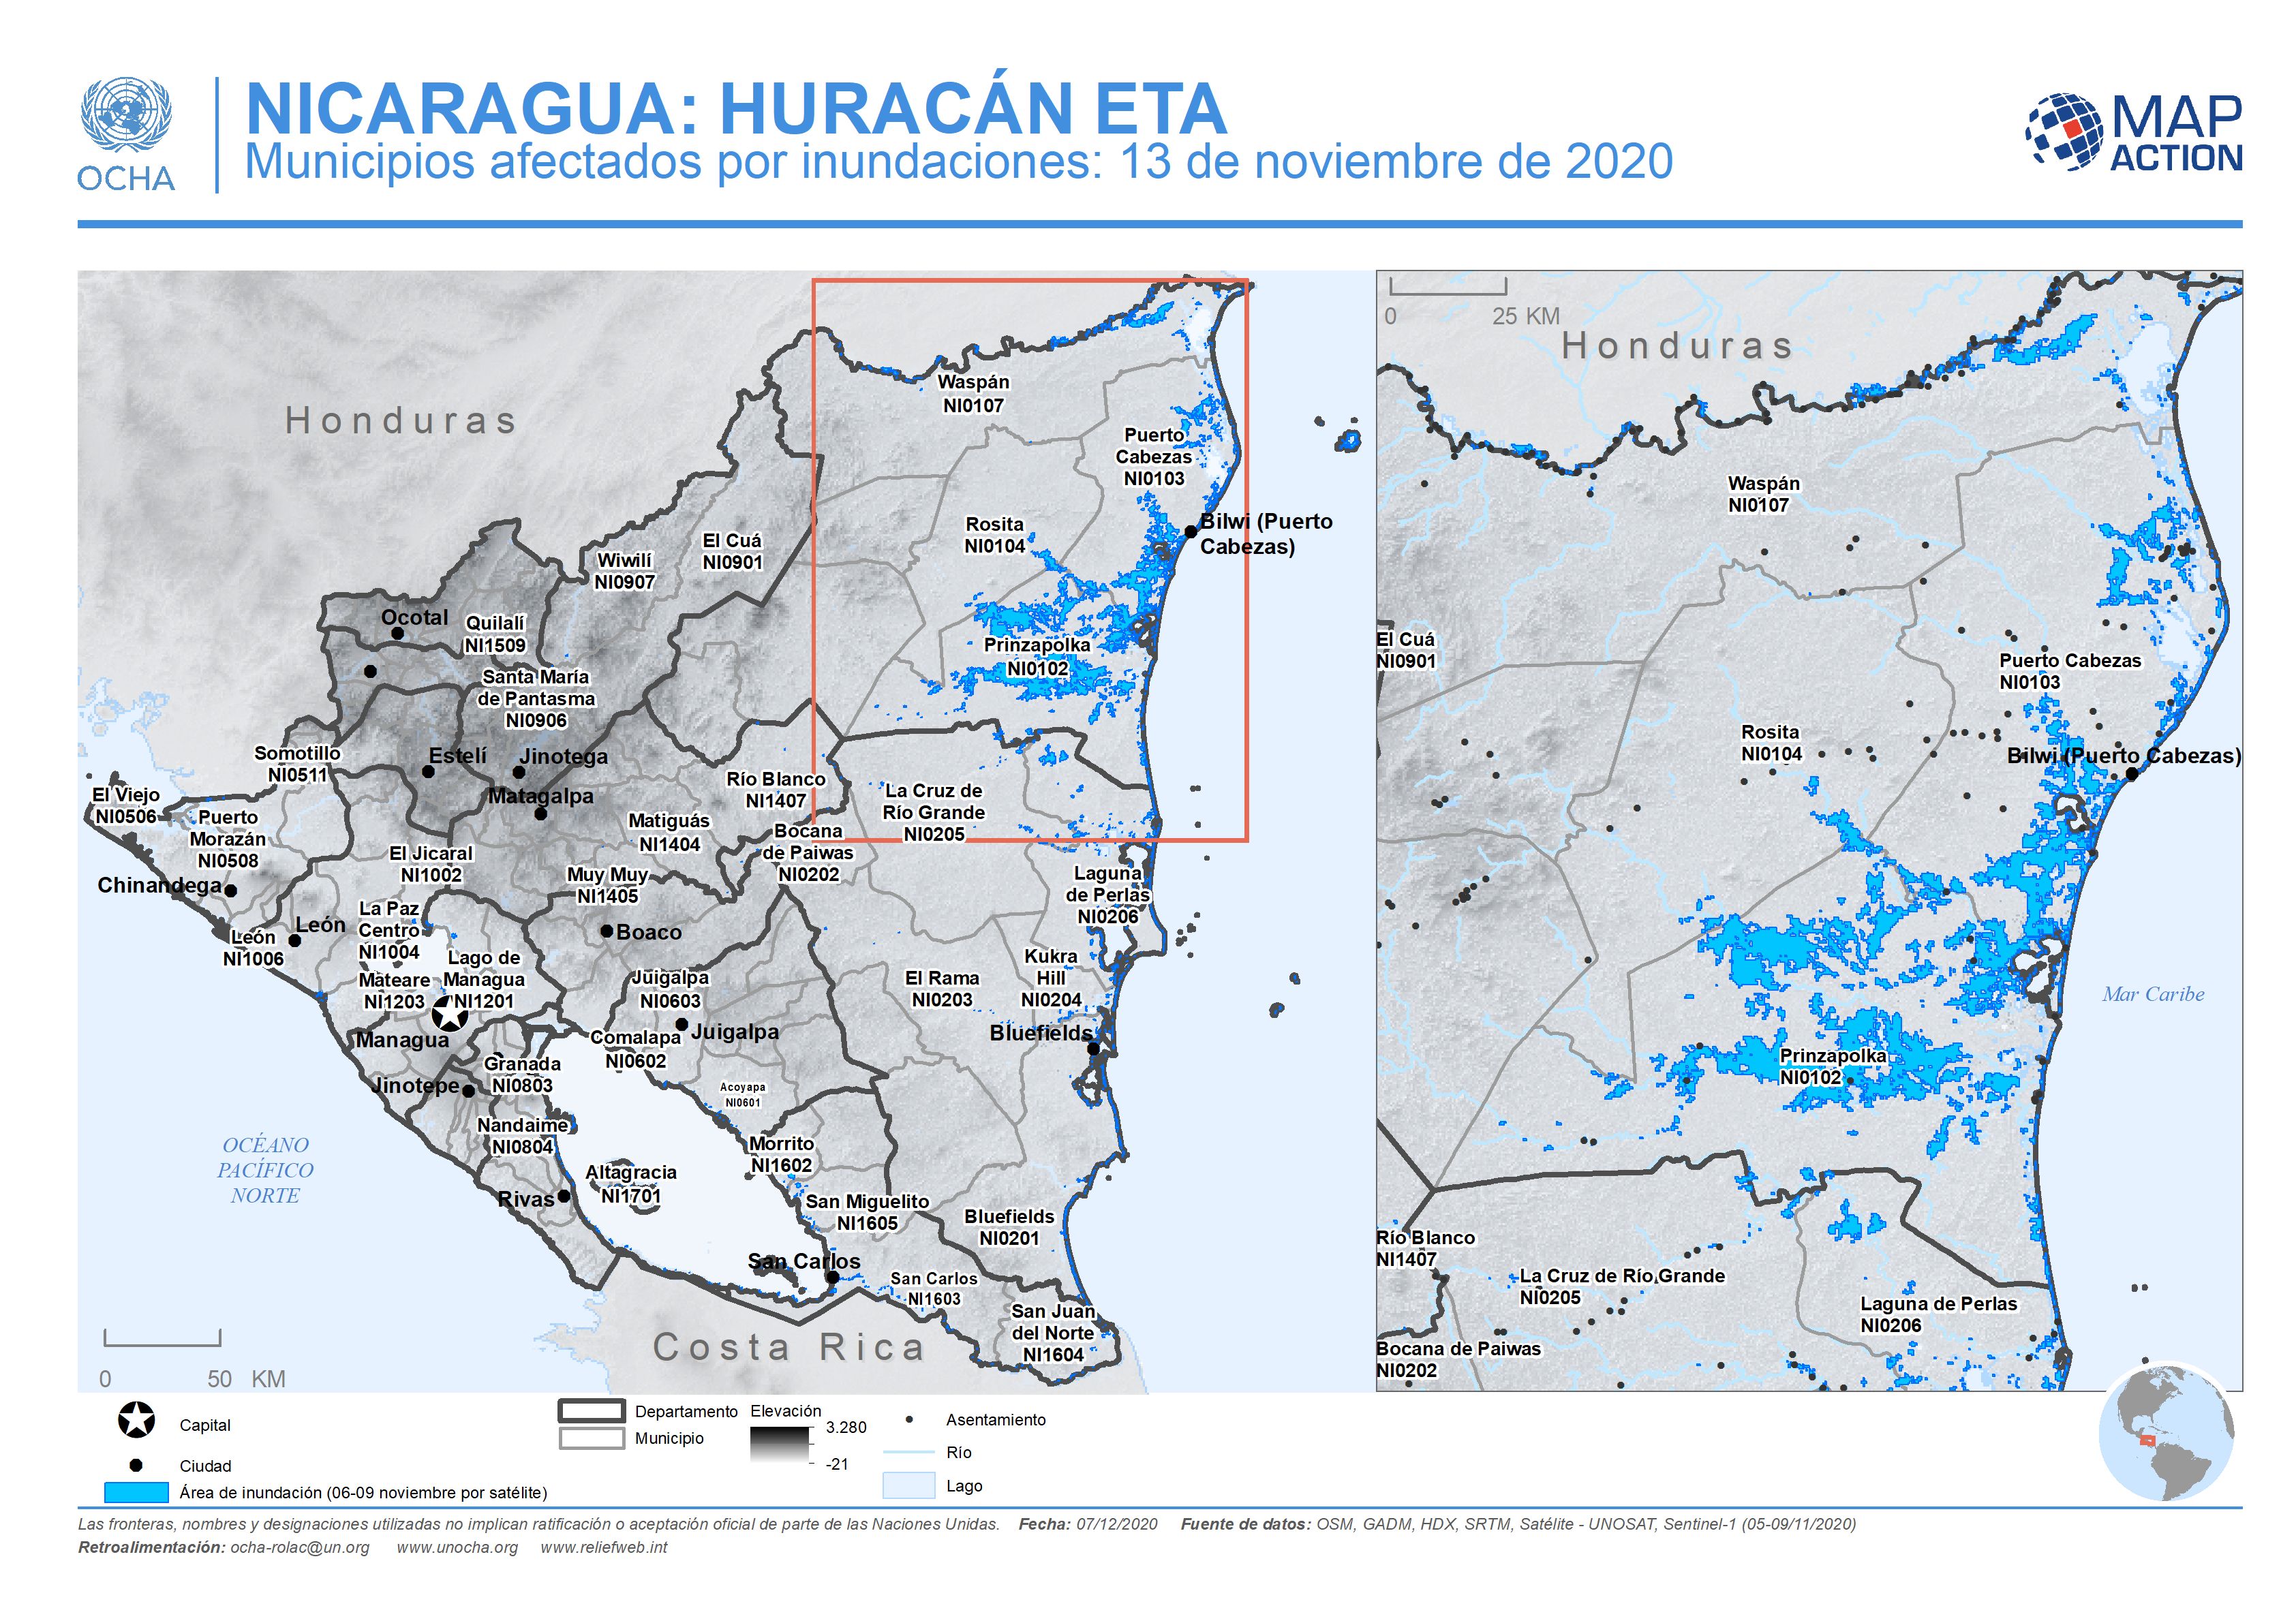
NICARAGUA: HURACÁN ETA - Municipios afectados por inundaciones: 13 de noviemb...
This map shows the administration level 2 municipalities for Nicaragua. Named municipalities are those affected by flood extents, derived from satellite imagery (6-9 November...