-
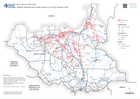
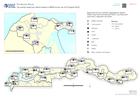
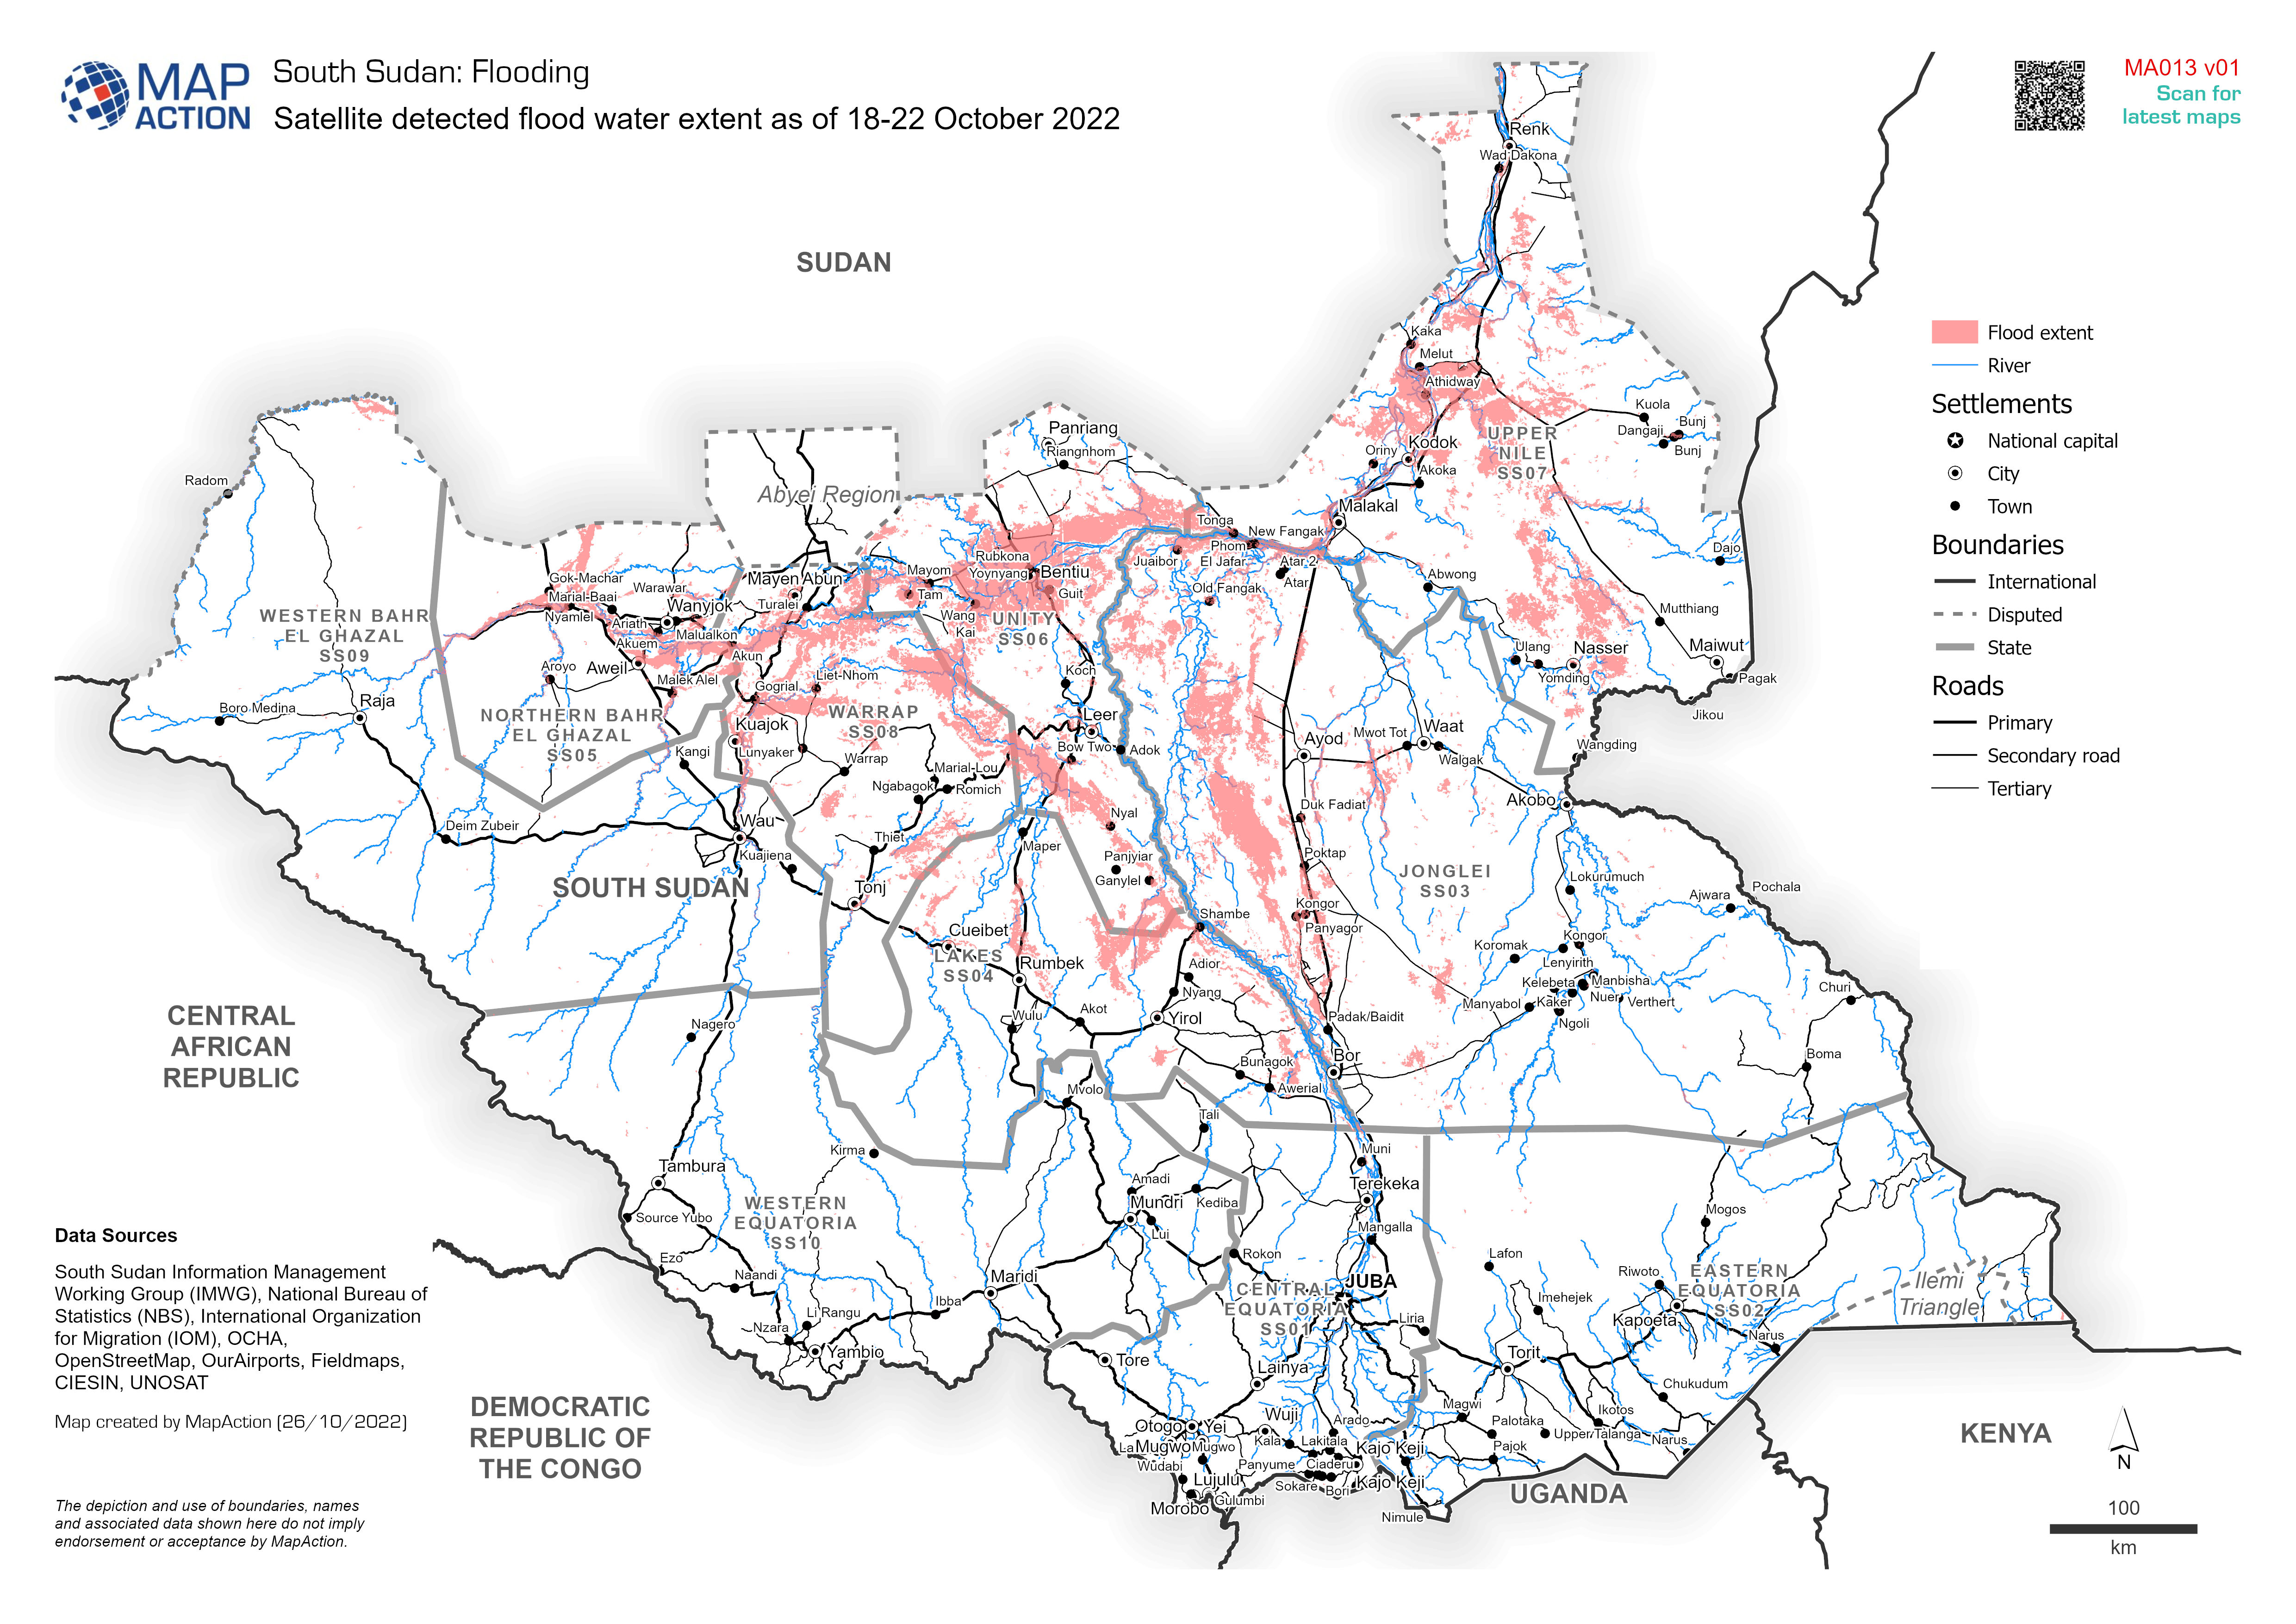
Satellite detected flood water extent as of 18-22 October 2022
Satellite detected flood water extent as of 18-22 October 2022, based on UNOSAT data -

Population density and Flood extents 01 - 29 August for affected provinces
Map shows the maximum extent of known flooding from satellite images on 1-29 Aug 2022 against world population for the most affected provinces. -
Population density and Flood extents 01 - 29 August per district
Flood extents for 01 - 29 August as detected by UNOSAT and estimates of population affected based upon Worldpop data for 2020 One atlas per province impacted by flooding, with... -

Flood extents and affected population estimates for 12 - 21 July and 01 - 29 ...
Flood extents for 12 - 21 July and 01 - 29 August as detected by UNOSAT and estimates of population affected based upon Worldpop data for 2020 -

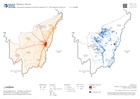
Maximum severity index score per district (as of 26 August 2022)
Maximum severity index score per district (as of 26 Aguust 2022) -

Mean severity index per district (as of 26 August 2022)
Mean severity index per district (as of 26 Aguust 2022) -
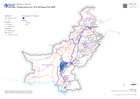
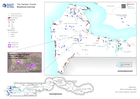
Flooded areas from 15 to 30 August from GFM
Flooded areas from 15 to 30 from GFM show with main cities, roads and railways -
Severity index scores for Upper River region (as of 25 August 2022)
Severity index scores for Upper River region (as of 25 August 2022). Showing mean and maximum aggregated scores -

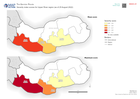
Maximum severity index score per district (as of 25 August 2022)
Maximum severity index score per district (as of 25 Aguust 2022) -

Mean severity index per district (as of 25 August 2022)
Mean severity index per district (as of 25 Aguust 2022) -
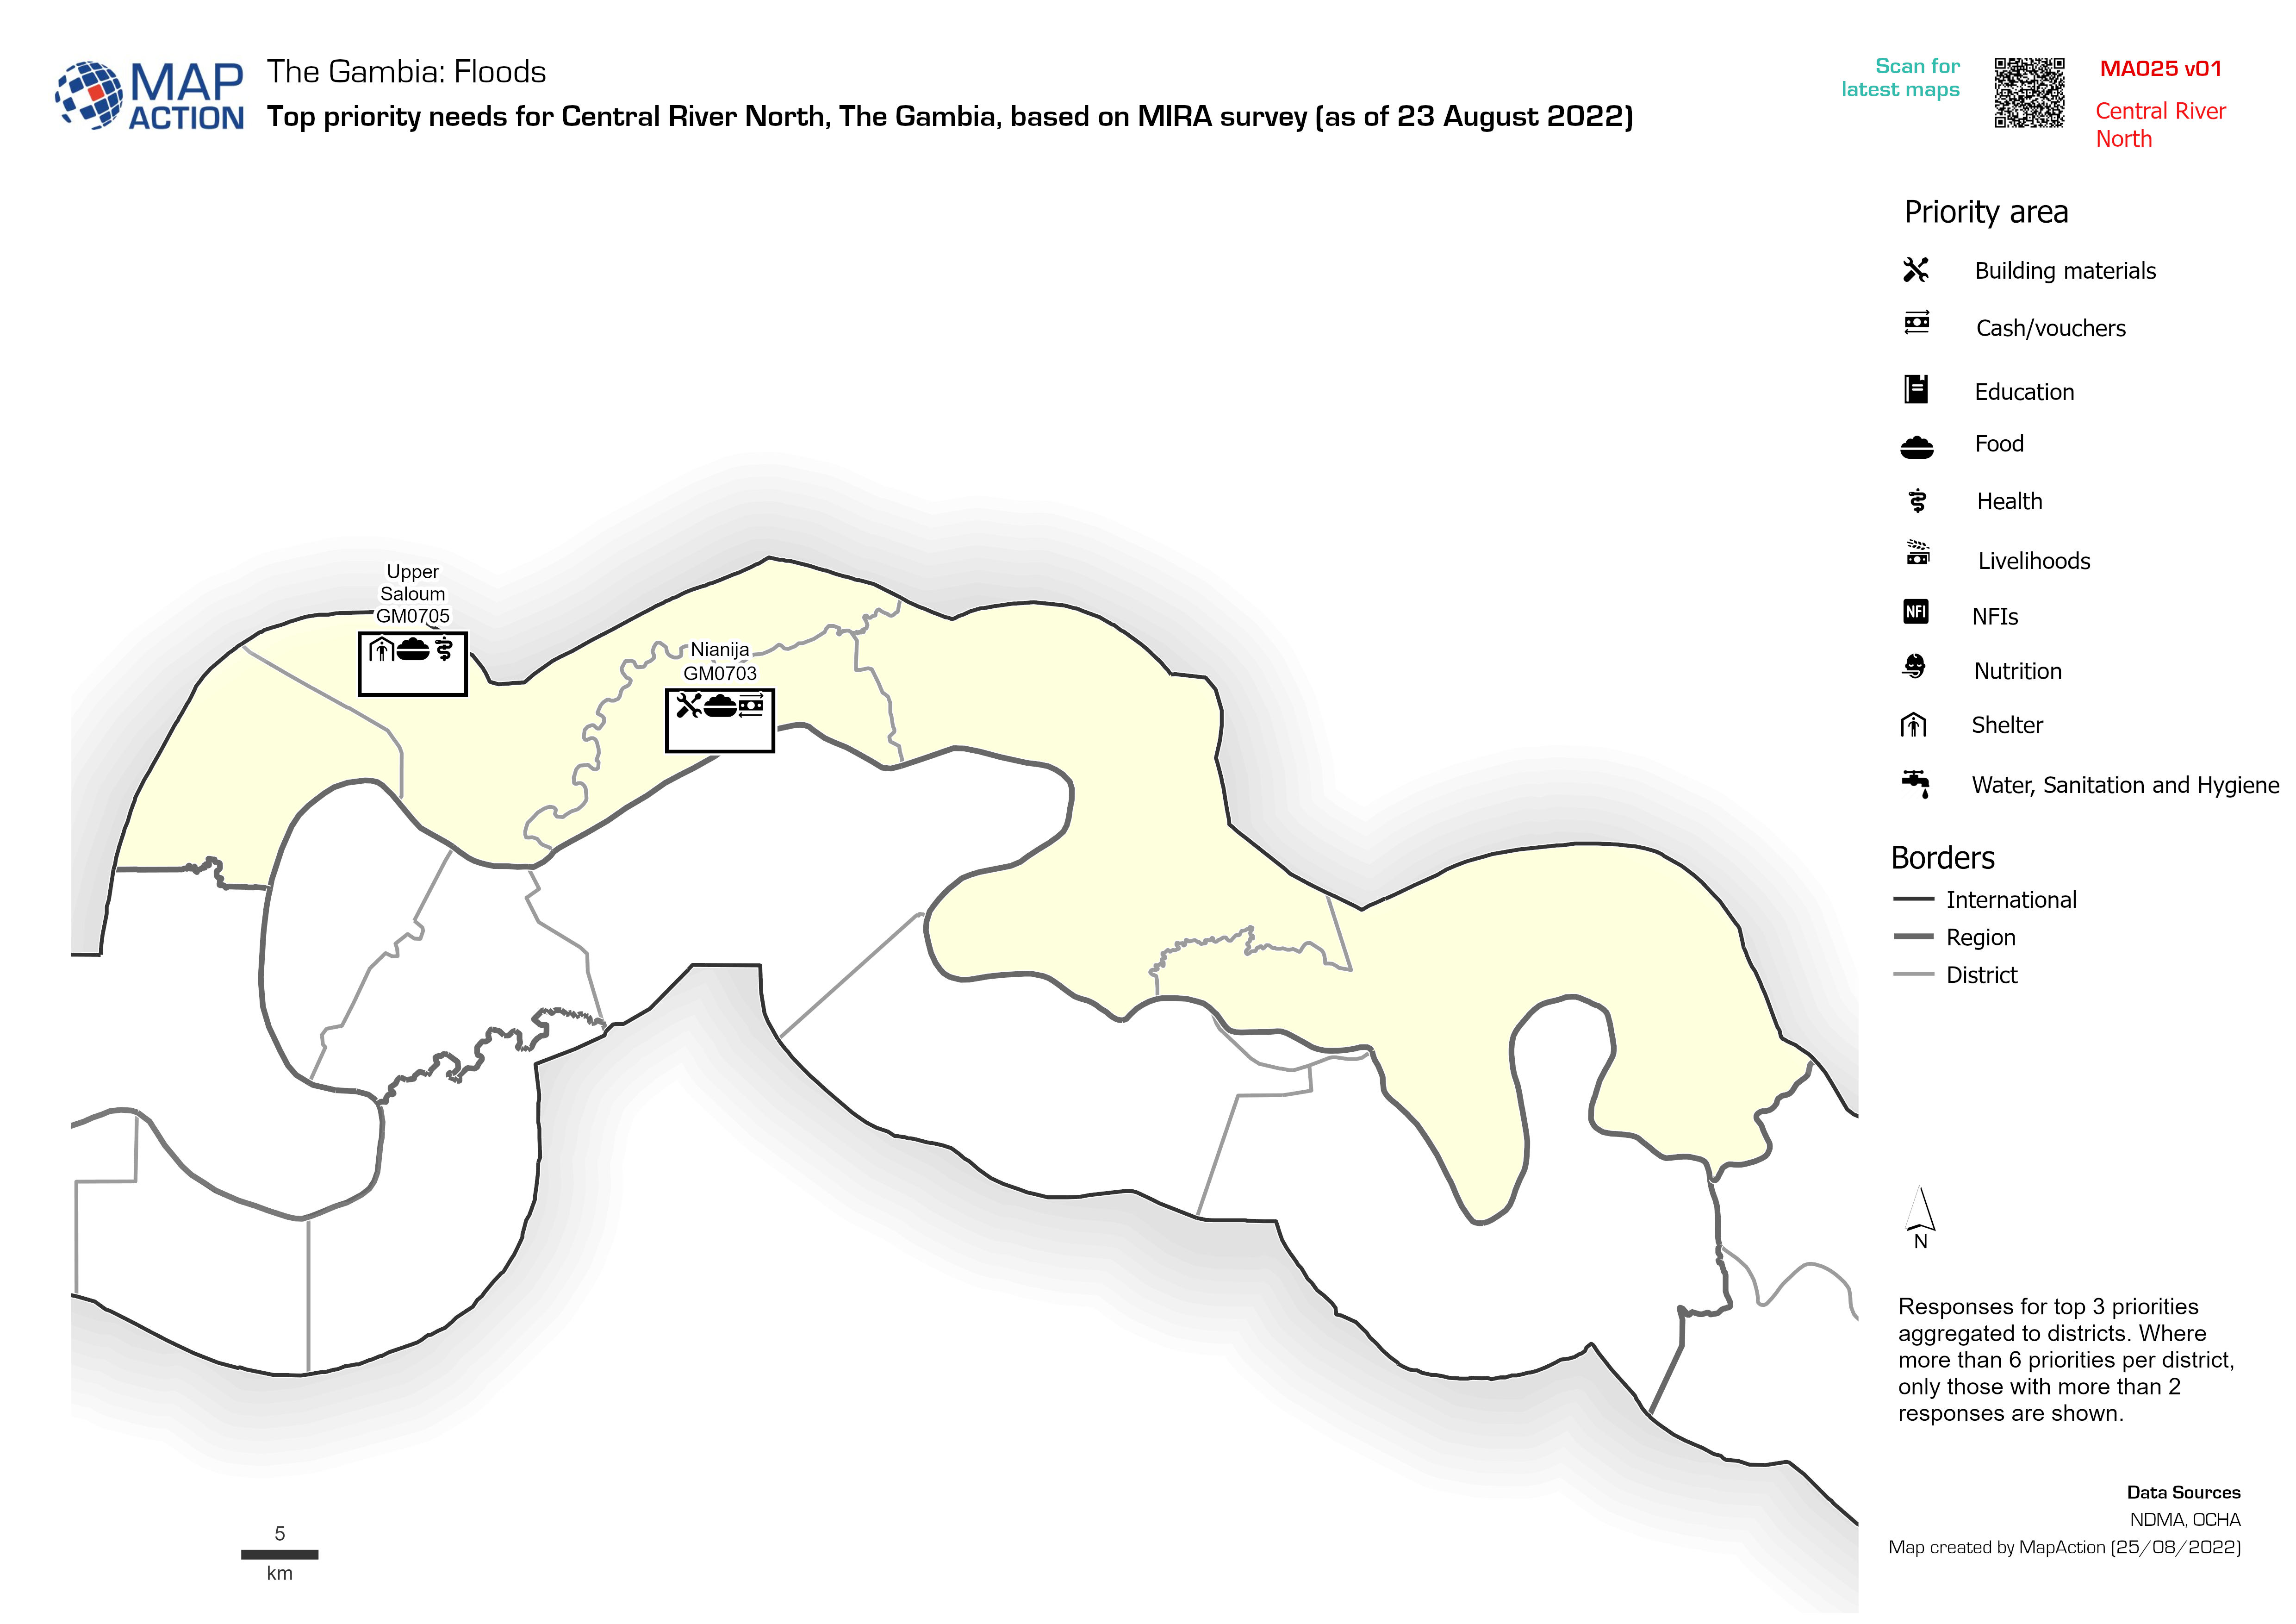
Top priority needs per district based on MIRA survey (as of 23 August 2022)
Responses for top 3 priorities aggregated to districts. Where more than 6 priorities per district, only those with more than 2 responses are shown. -

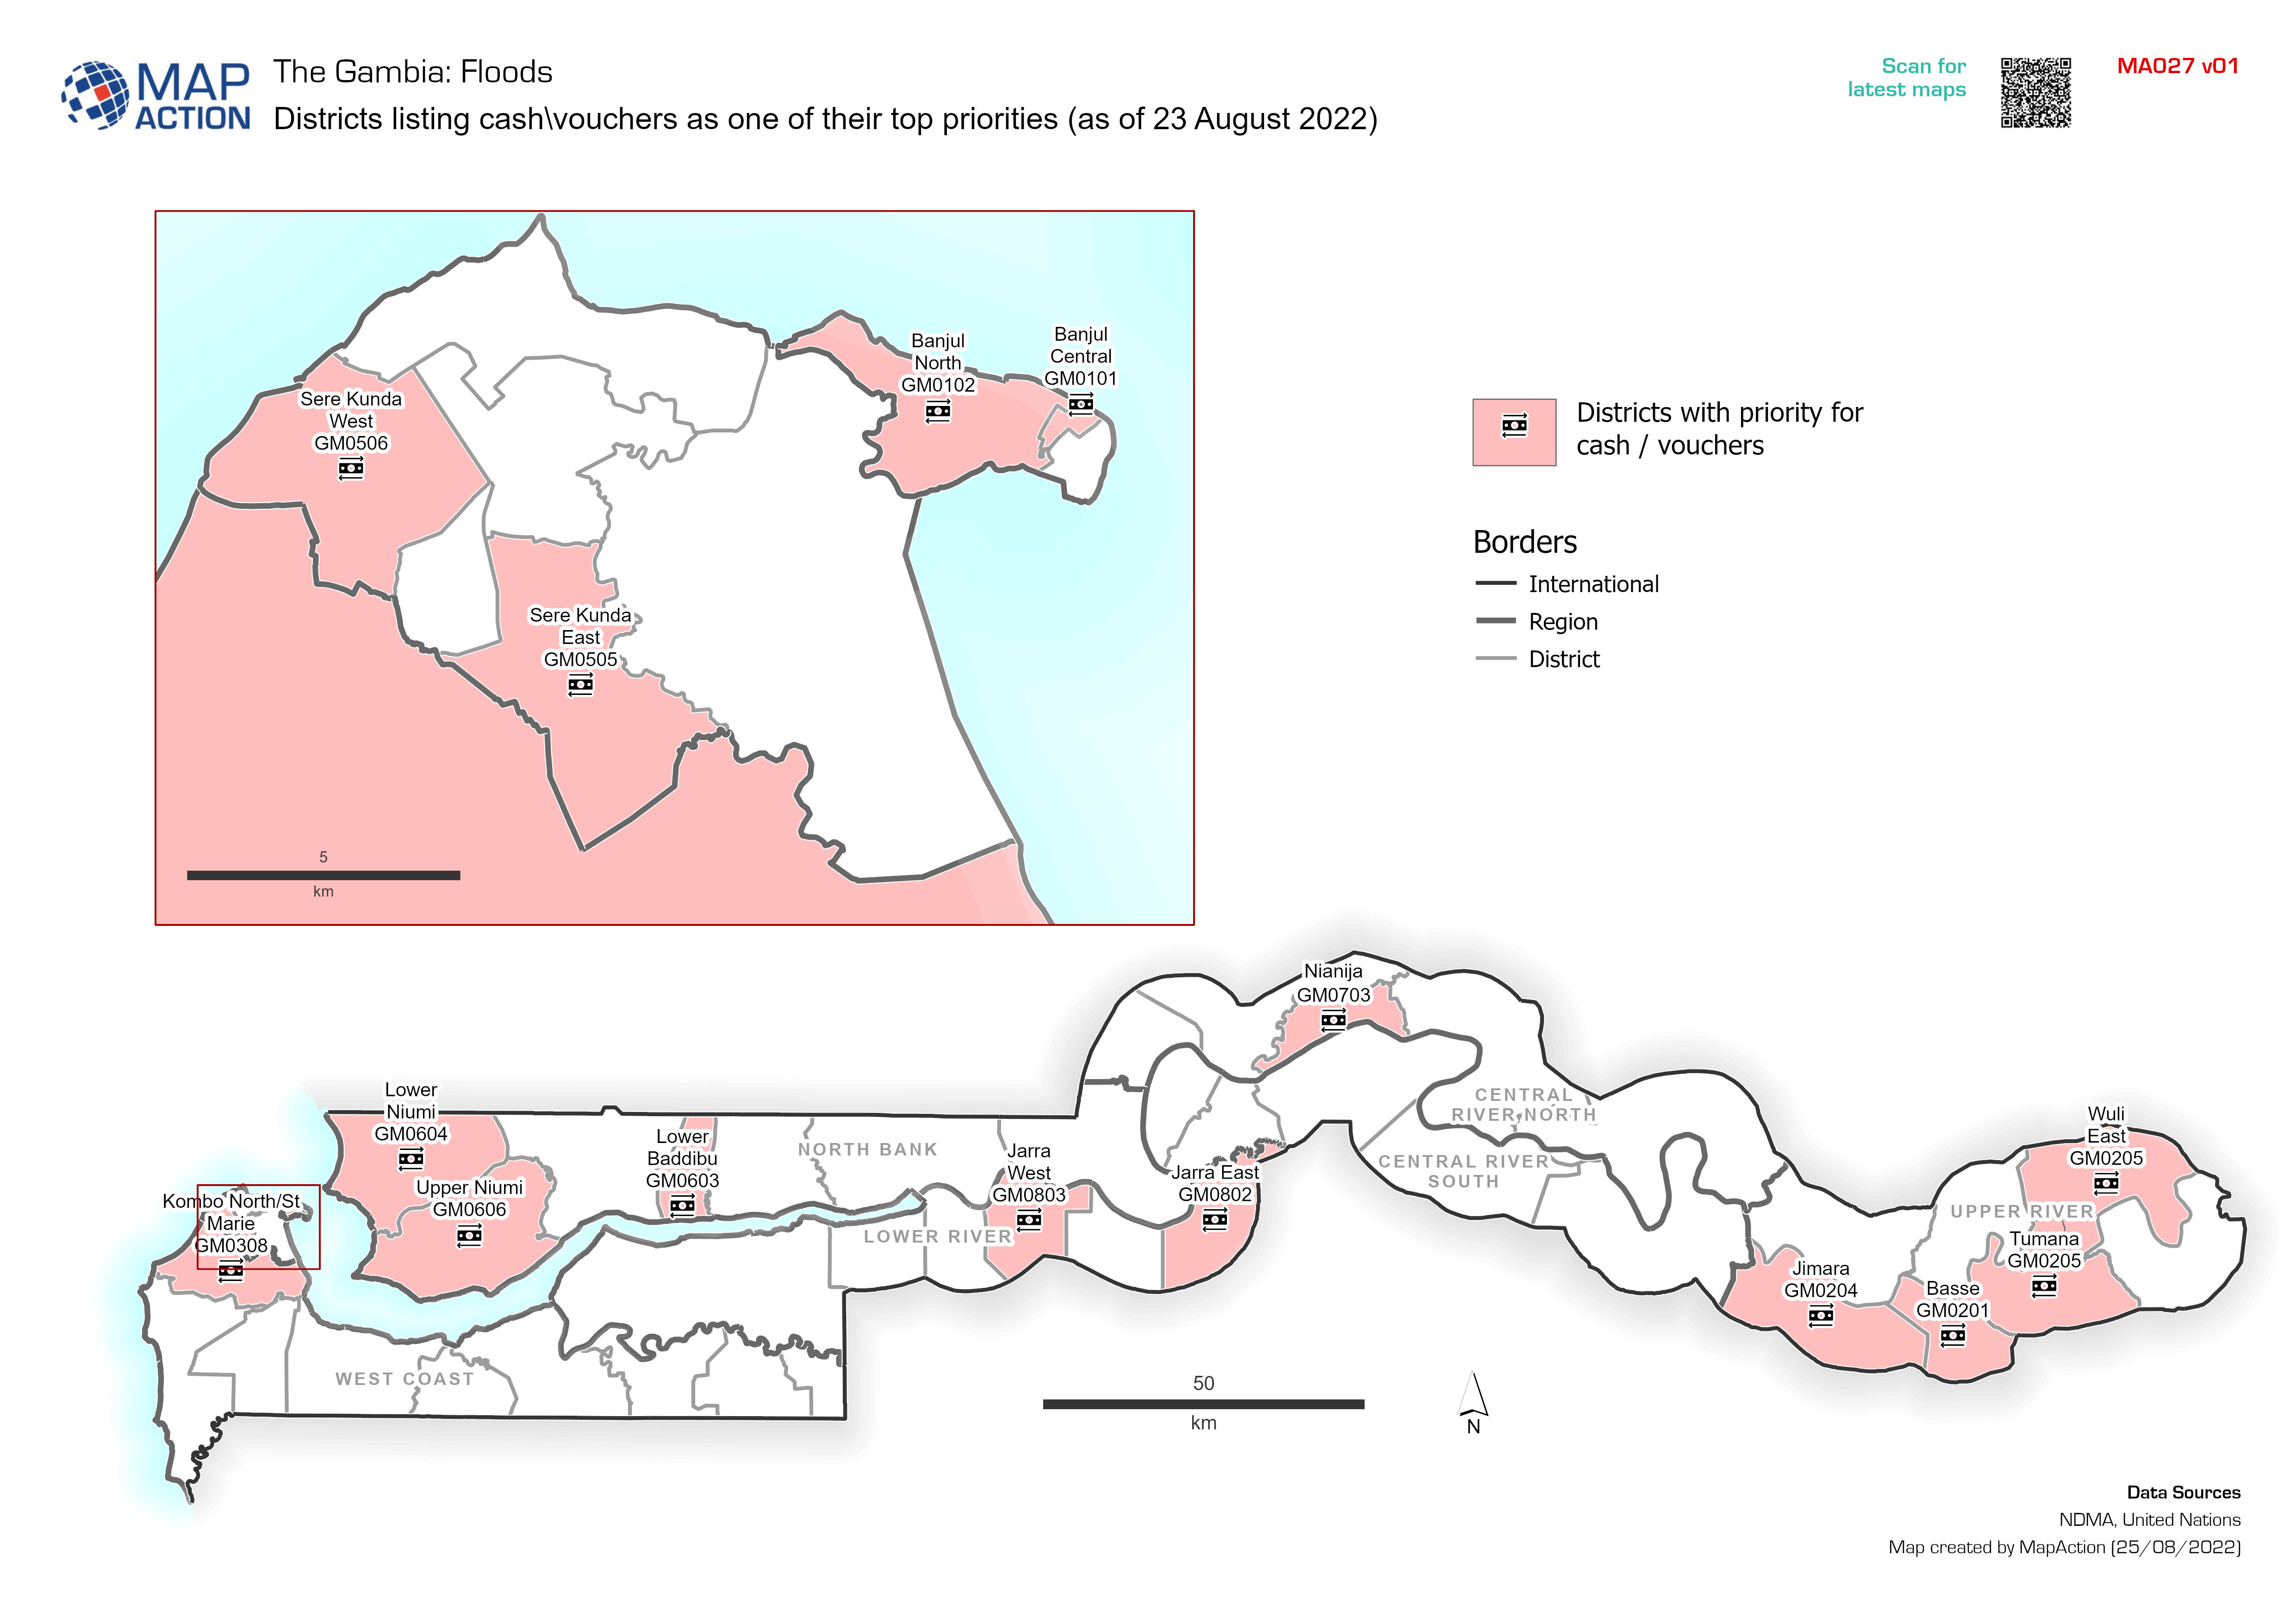
Districts listing cash\vouchers as one of their top priorities (as of 23 Augu...
Districts citing cash\vouchers as one of their top priorities (as of 23 August 2022). Data taken from MIRA -
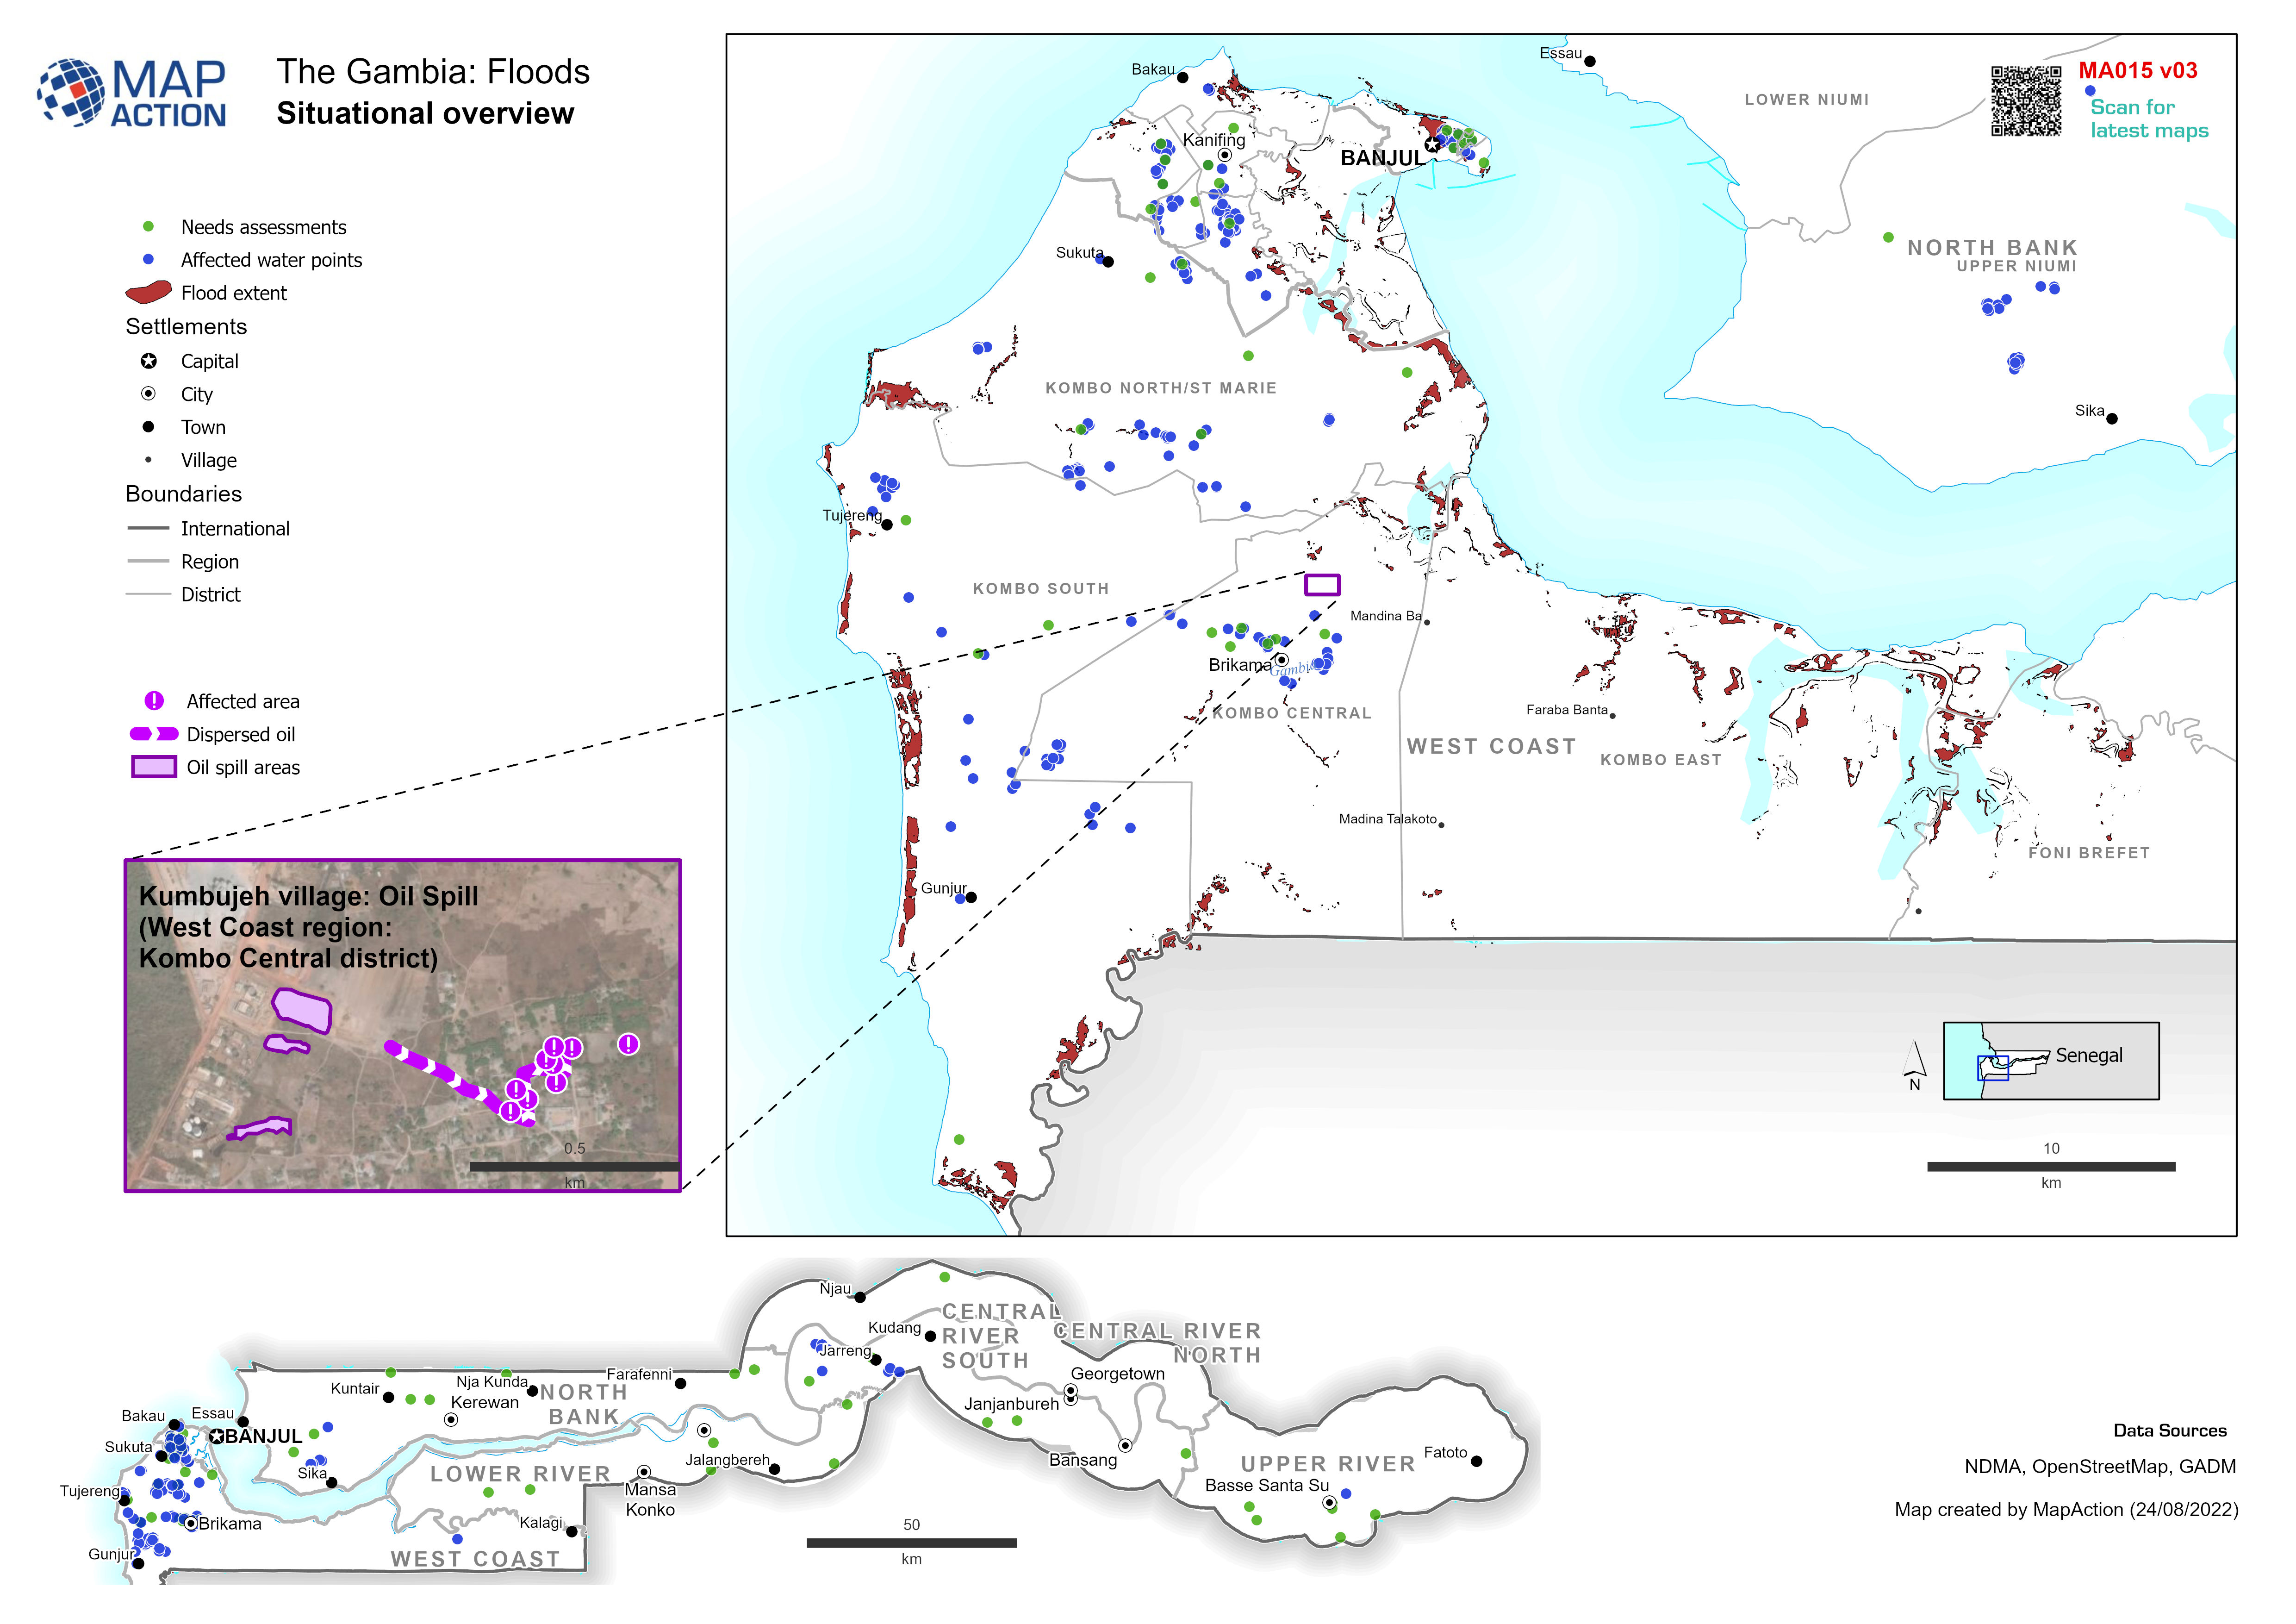
Situational overview
Example: Map shows the extent of known flooding from satellite images on 1 Jan 2012. -

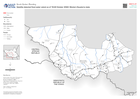
Vatovavy Fitovinany Region (South) - Health Facility Situation
Count and details of damaged health facilities in Vatovavy Fitovinany (South) -

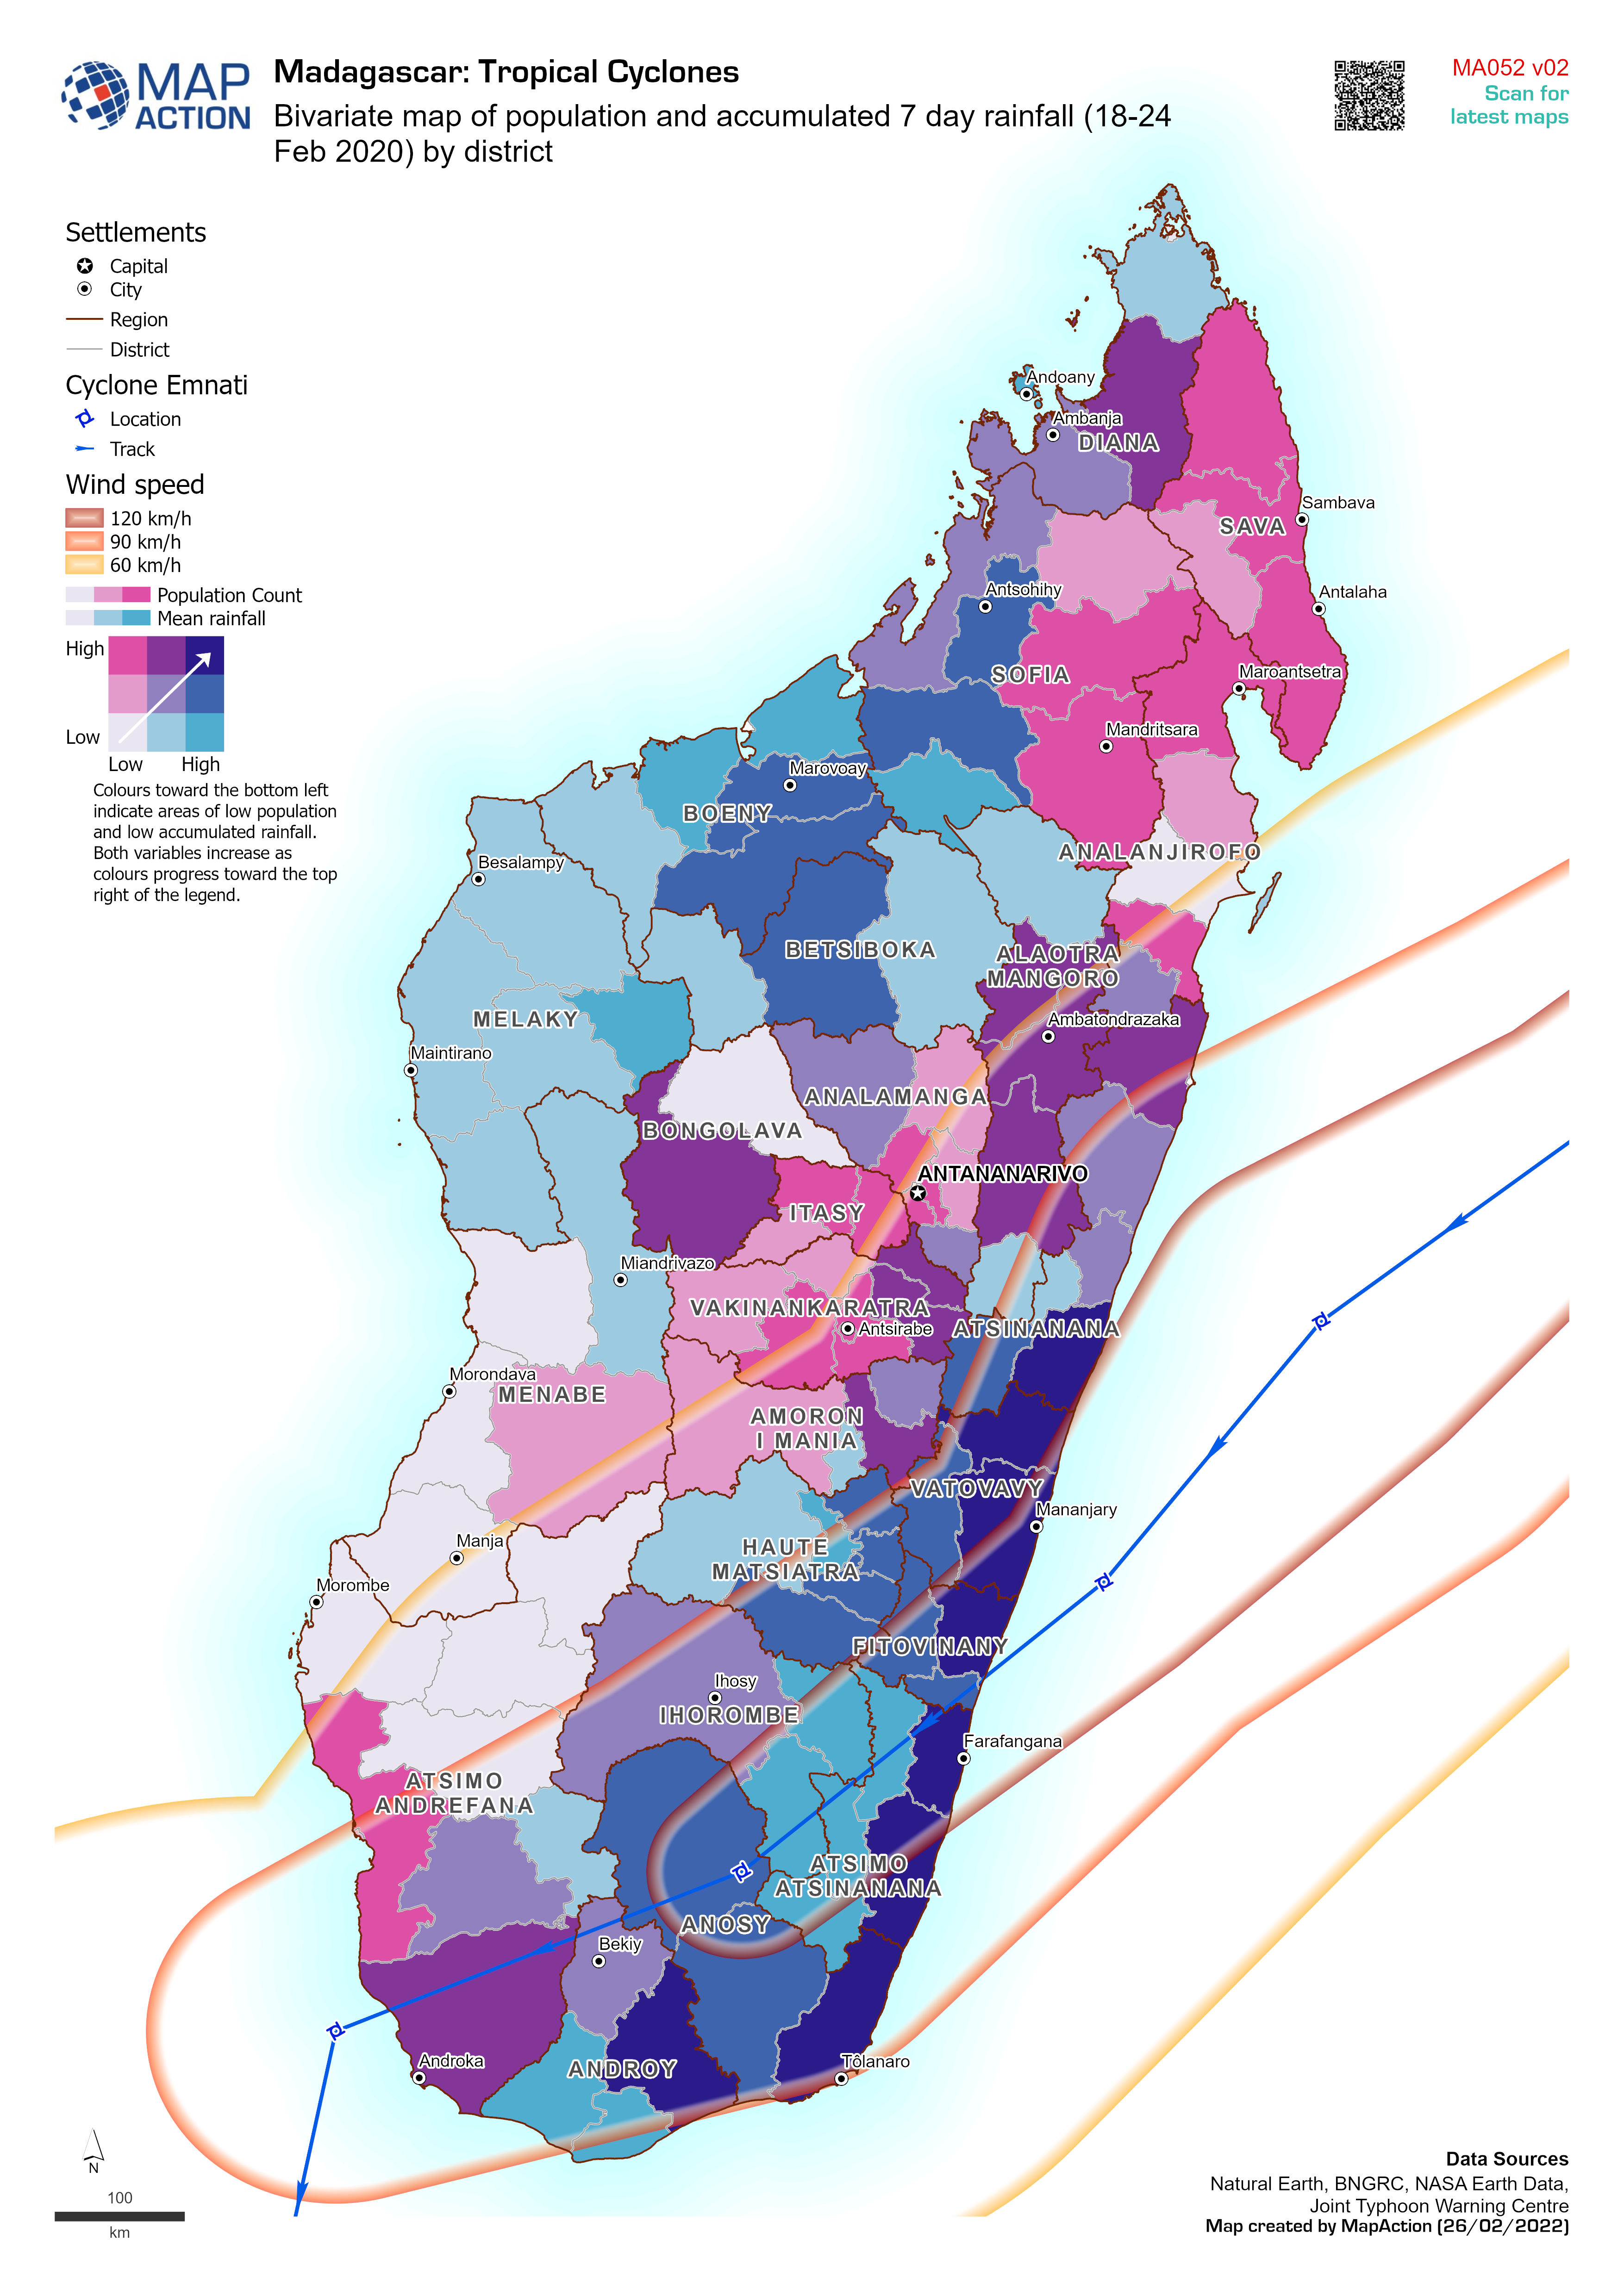
Bivariate map of population and accumulated 7 day rainfall (18-24 Feb 2020) b...
Bivariate map of population (2018 estimate) and accumulated 7 day rainfall (18-24 Feb 2022) by district. Storm track for cyclone Emnati is based on Joint Typhoon Warning Centre... -

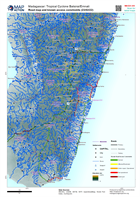
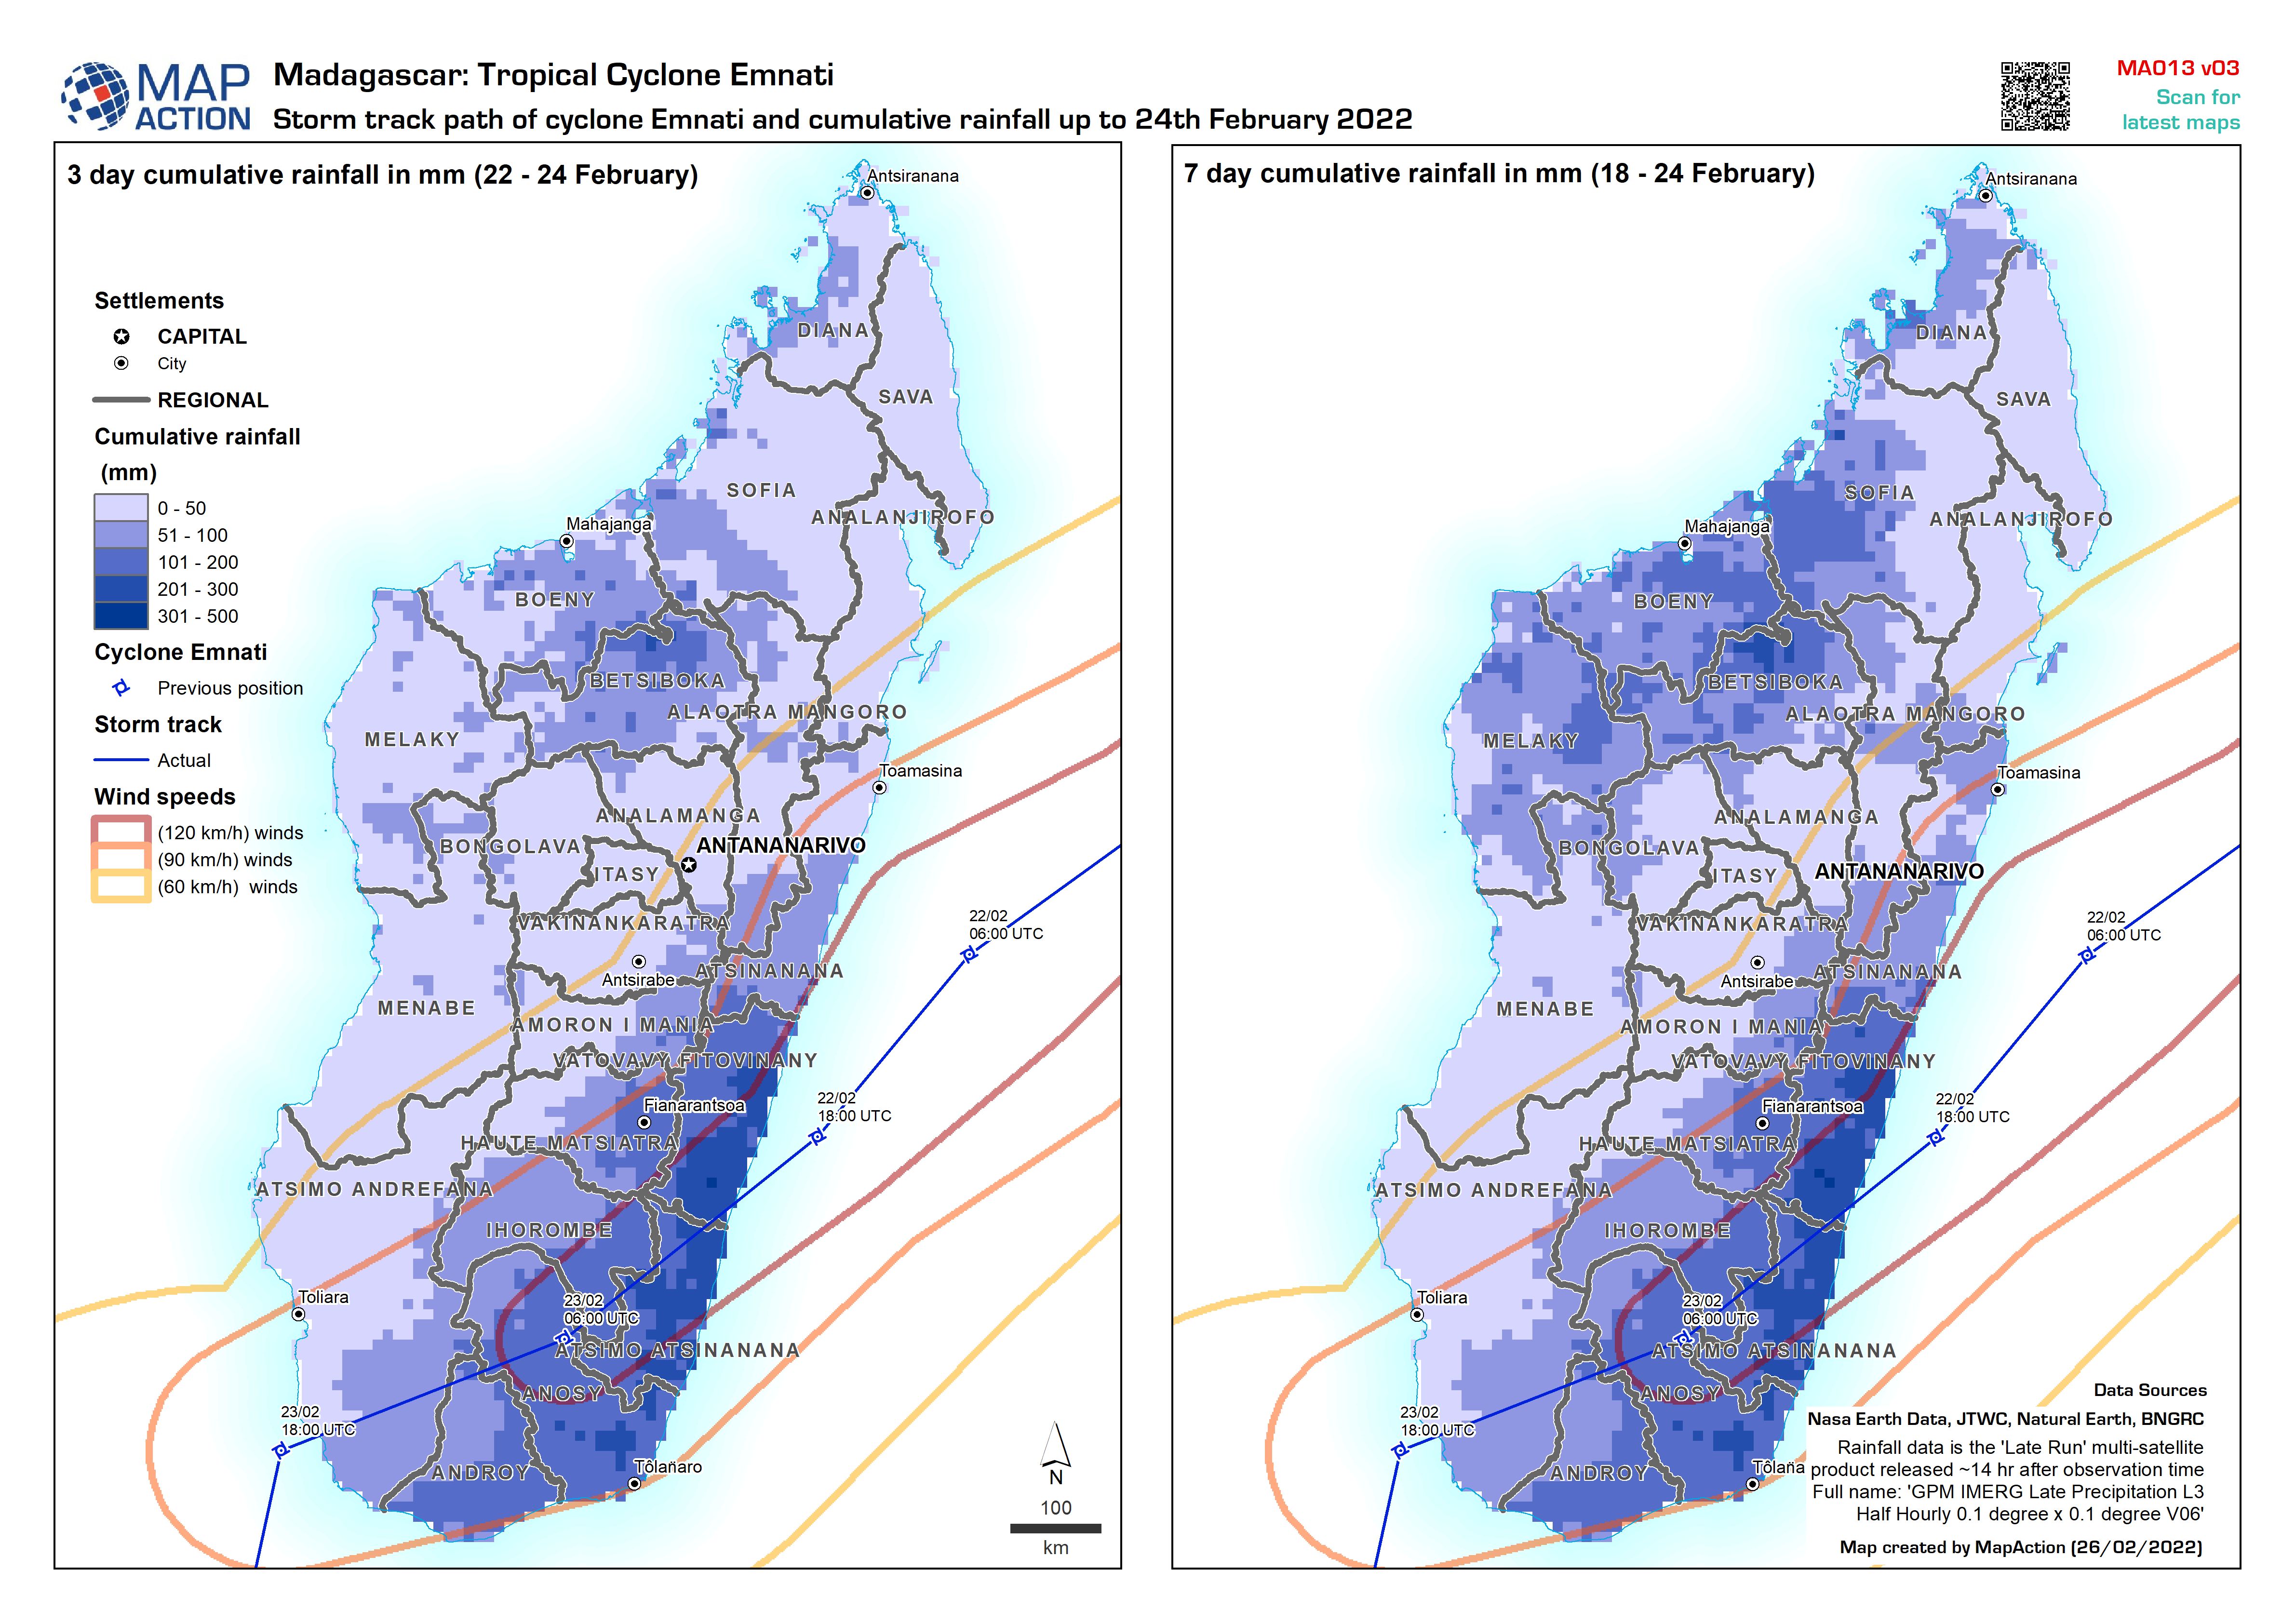
Storm track path of cyclone Emnati and cumulative rainfall up to 24th Februar...
Storm track path of cyclone Emnati (as recorded on 24 Feb 2022) and cumulative 3 day and 7 day rainfall up to 24th February 2022 -
Road map and known access constraints (23/02/22)
Map shows major settlements, transport links, known road access constraints and physical features of Madagascar.

