-

Población impactada con respecto a la poblacion total 2022: Lambayeque - (dat...
Representación de la población impactada por inundación entre Abril y Junio 2023 en los departamentos de Tumbes, Lambayeque y Piura. -

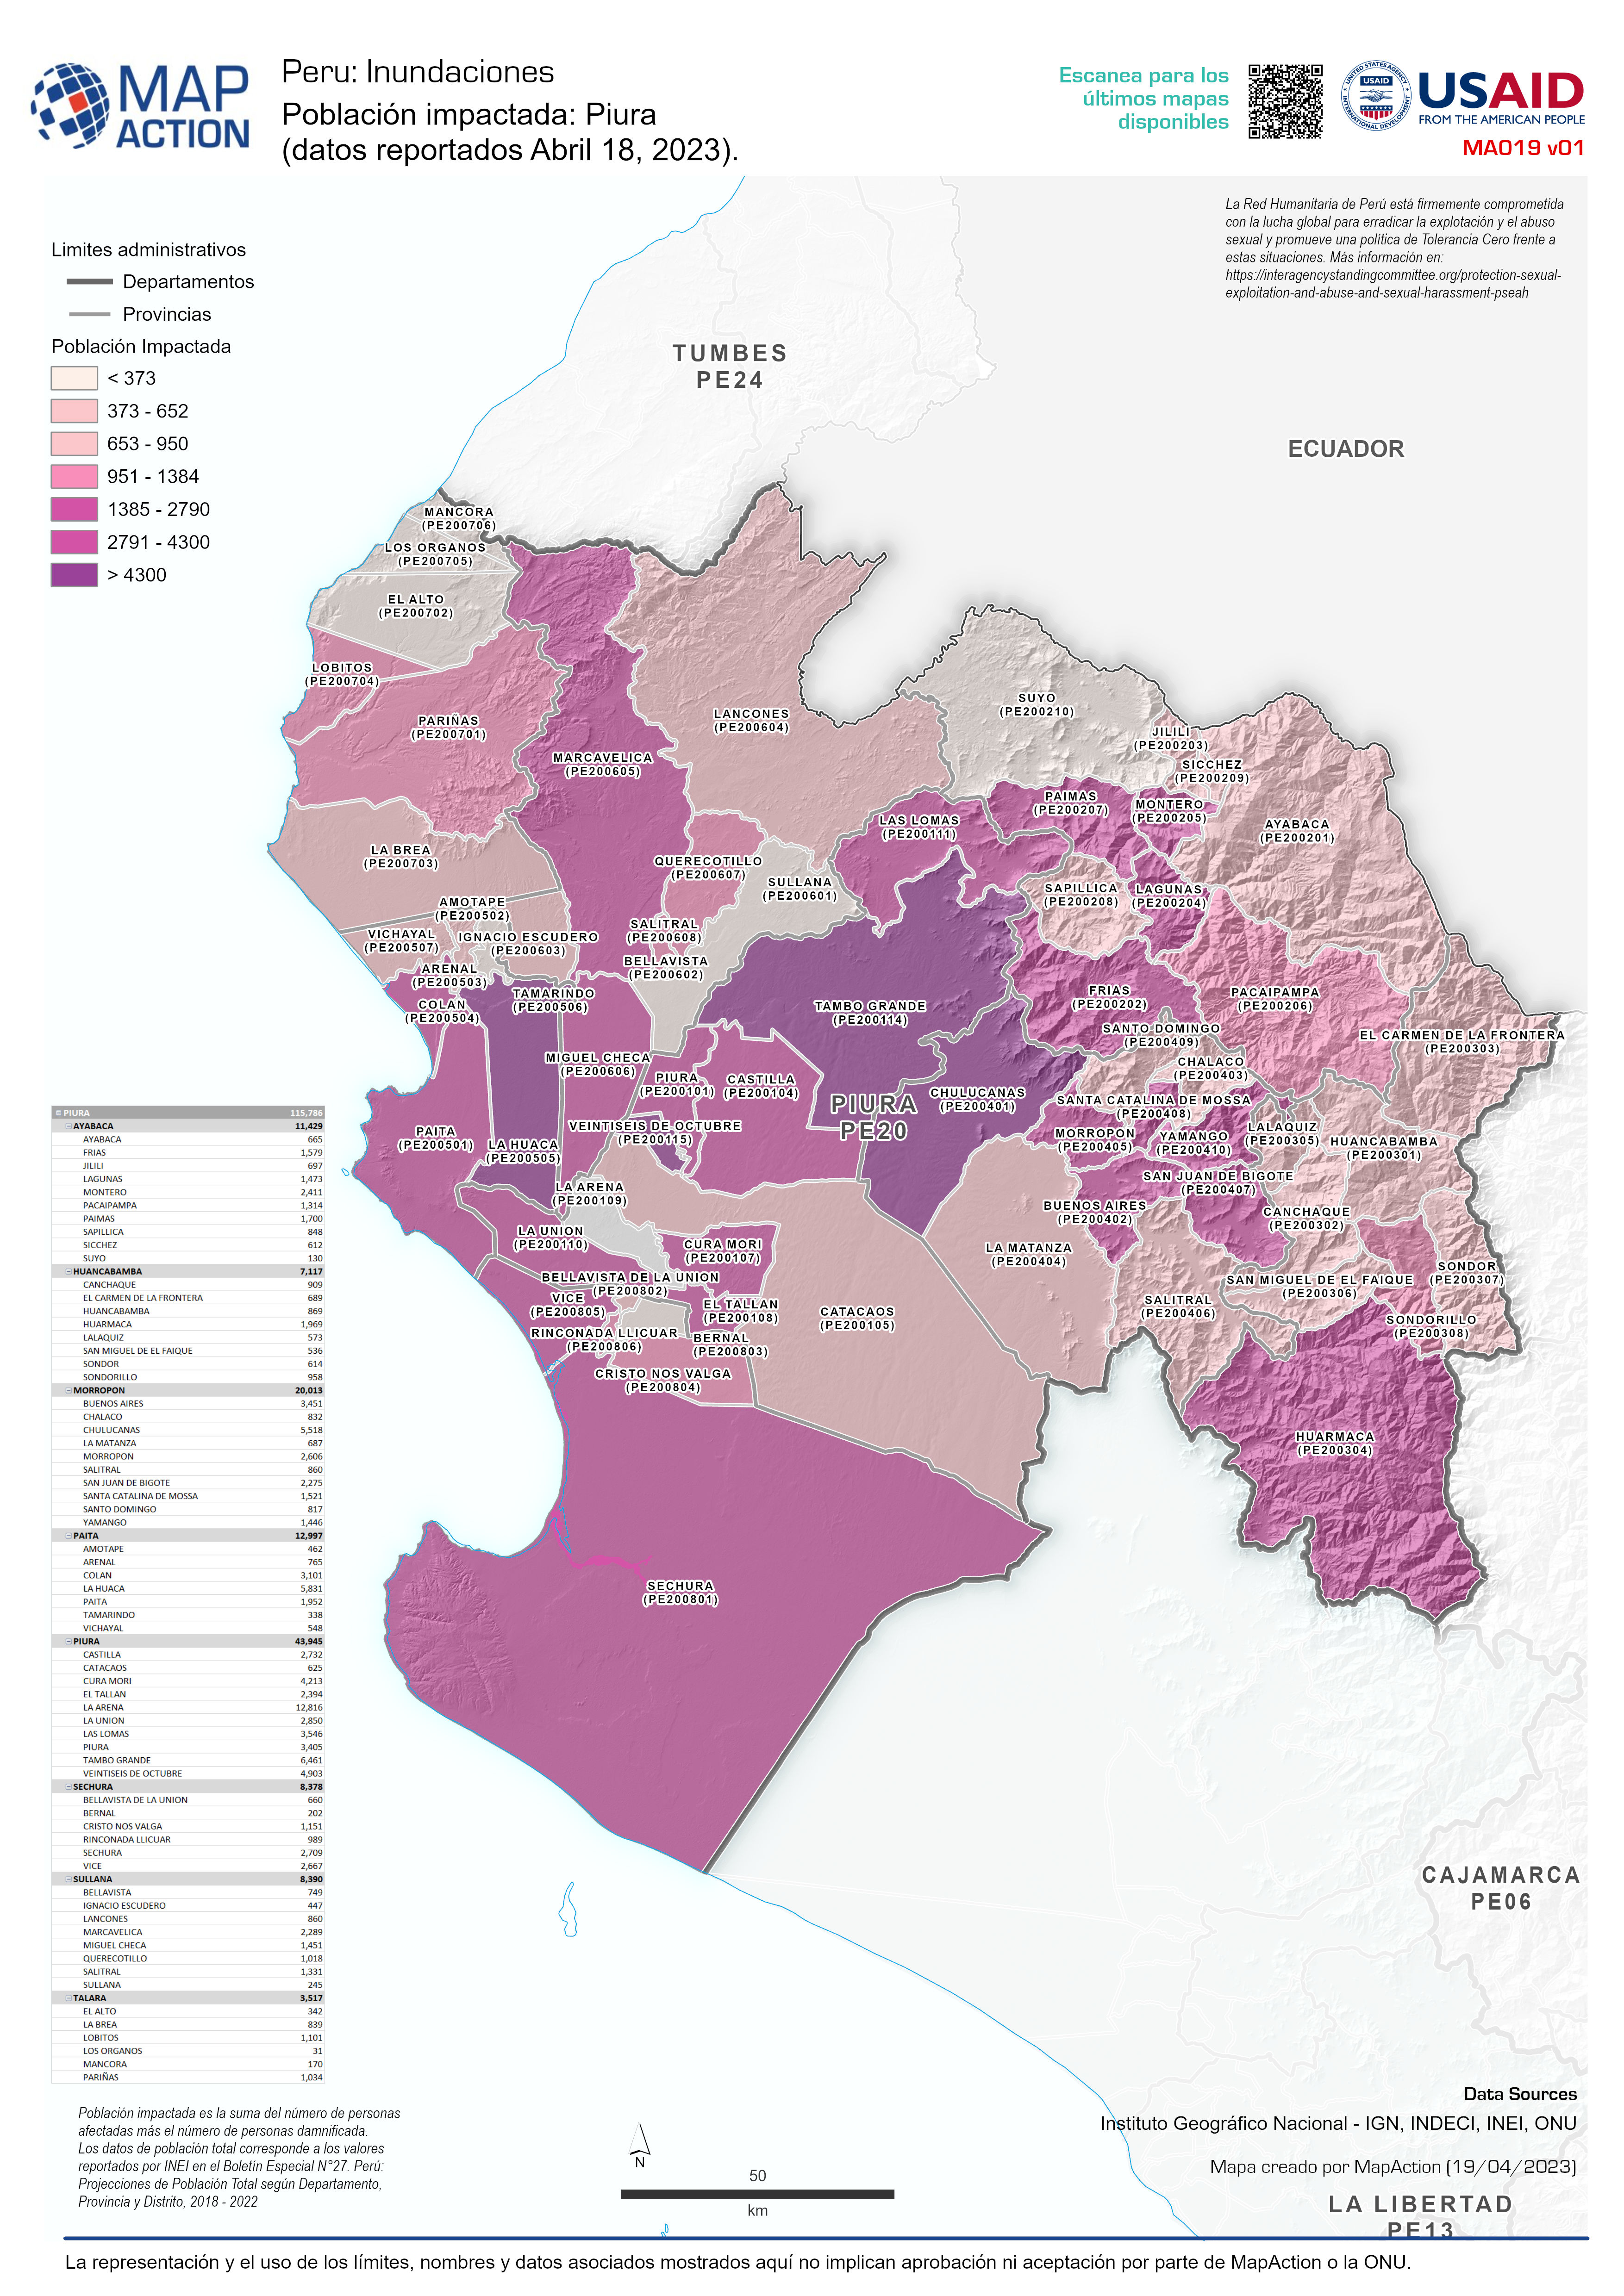
Población impactada: Piura (datos reportados Abril 18, 2023).
Representación de la población impactada por inundación entre Abril y Junio 2023 en los departamentos de Piura. -

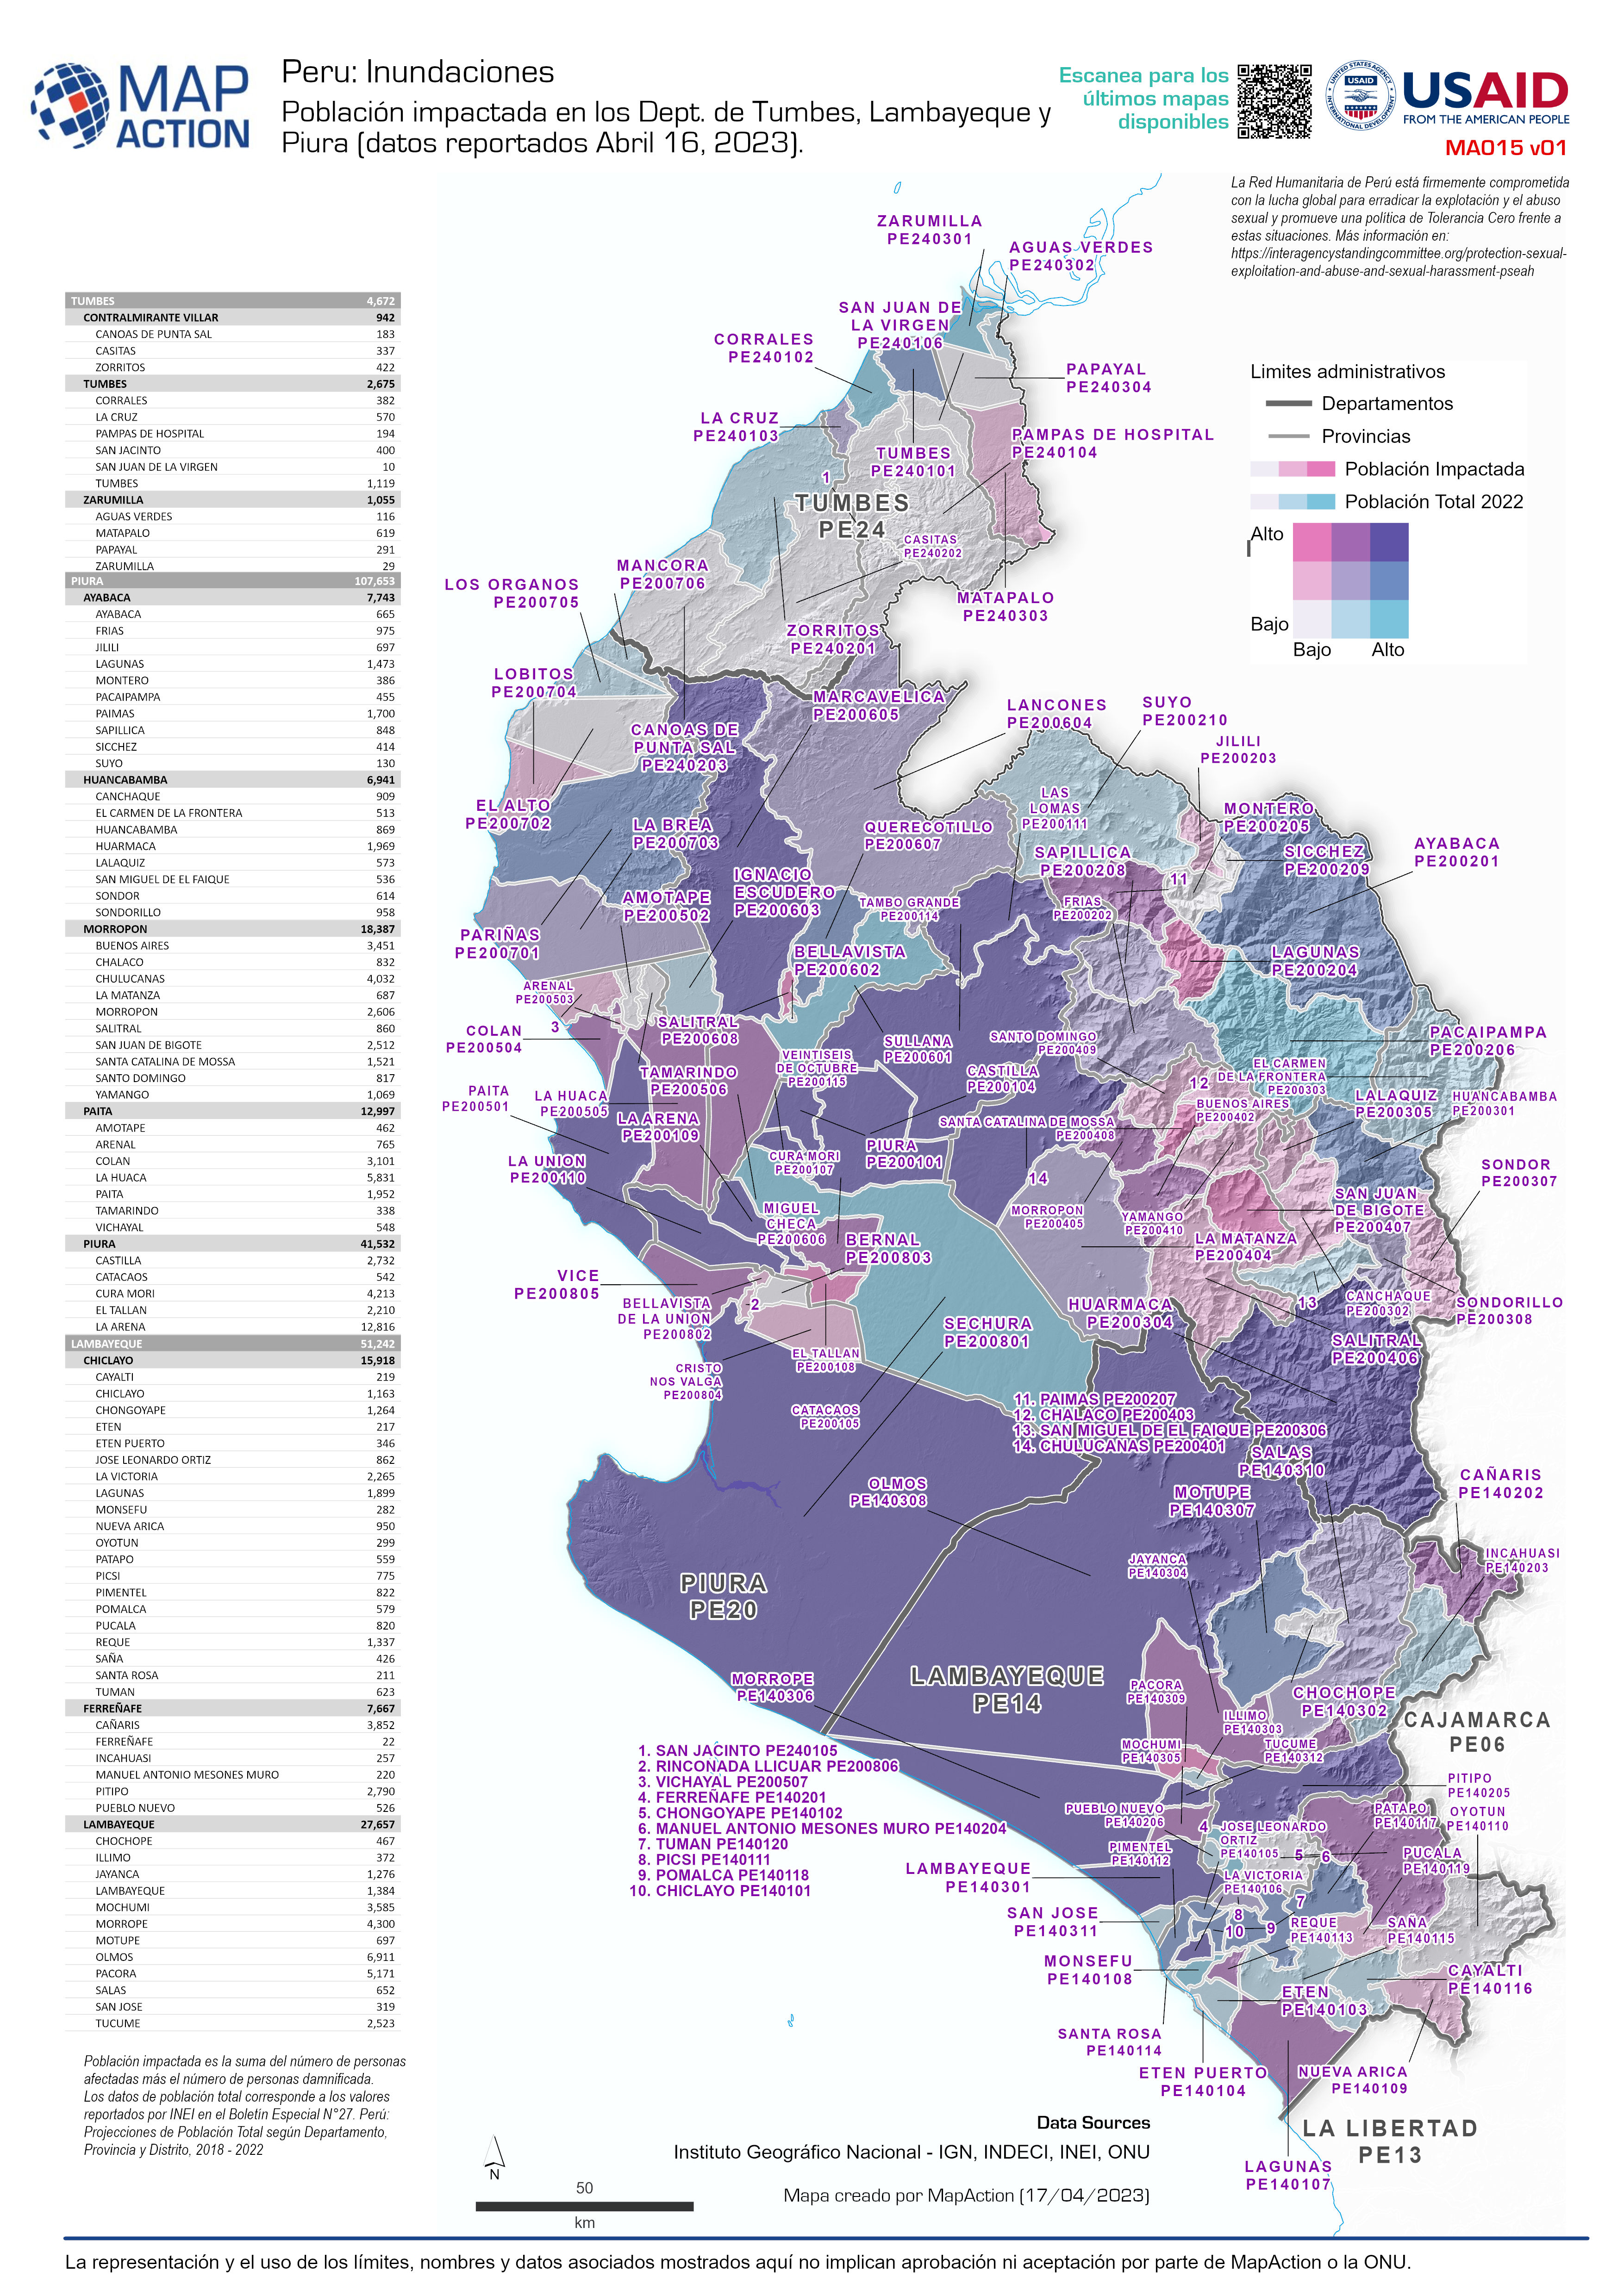
Población impactada en los Dept. de Tumbes, Lambayeque y Piura (datos reporta...
Representación de la población impactada por inundación entre Abril y Junio 2023 en los departamentos de Tumbes, Lambayeque y Piura. -

Población impactada en los Dept. de Tumbes, Lambayeque y Piura (datos reporta...
Representación de la población impactada por inundación entre Abril y Junio 2023 en los departamentos de Tumbes, Lambayeque y Piura. -

Southern Region: Schools acting as IDP camps with total IDP population per TA...
Southern Region: Schools acting as IDP camps with total IDP population per TA. -

Cumulative Rainfall (1st - 13th March 2023), and affected population. MA019
Southern Region: Total Rainfall (1st - 15th March 2023), and affected population per Traditional Authority -

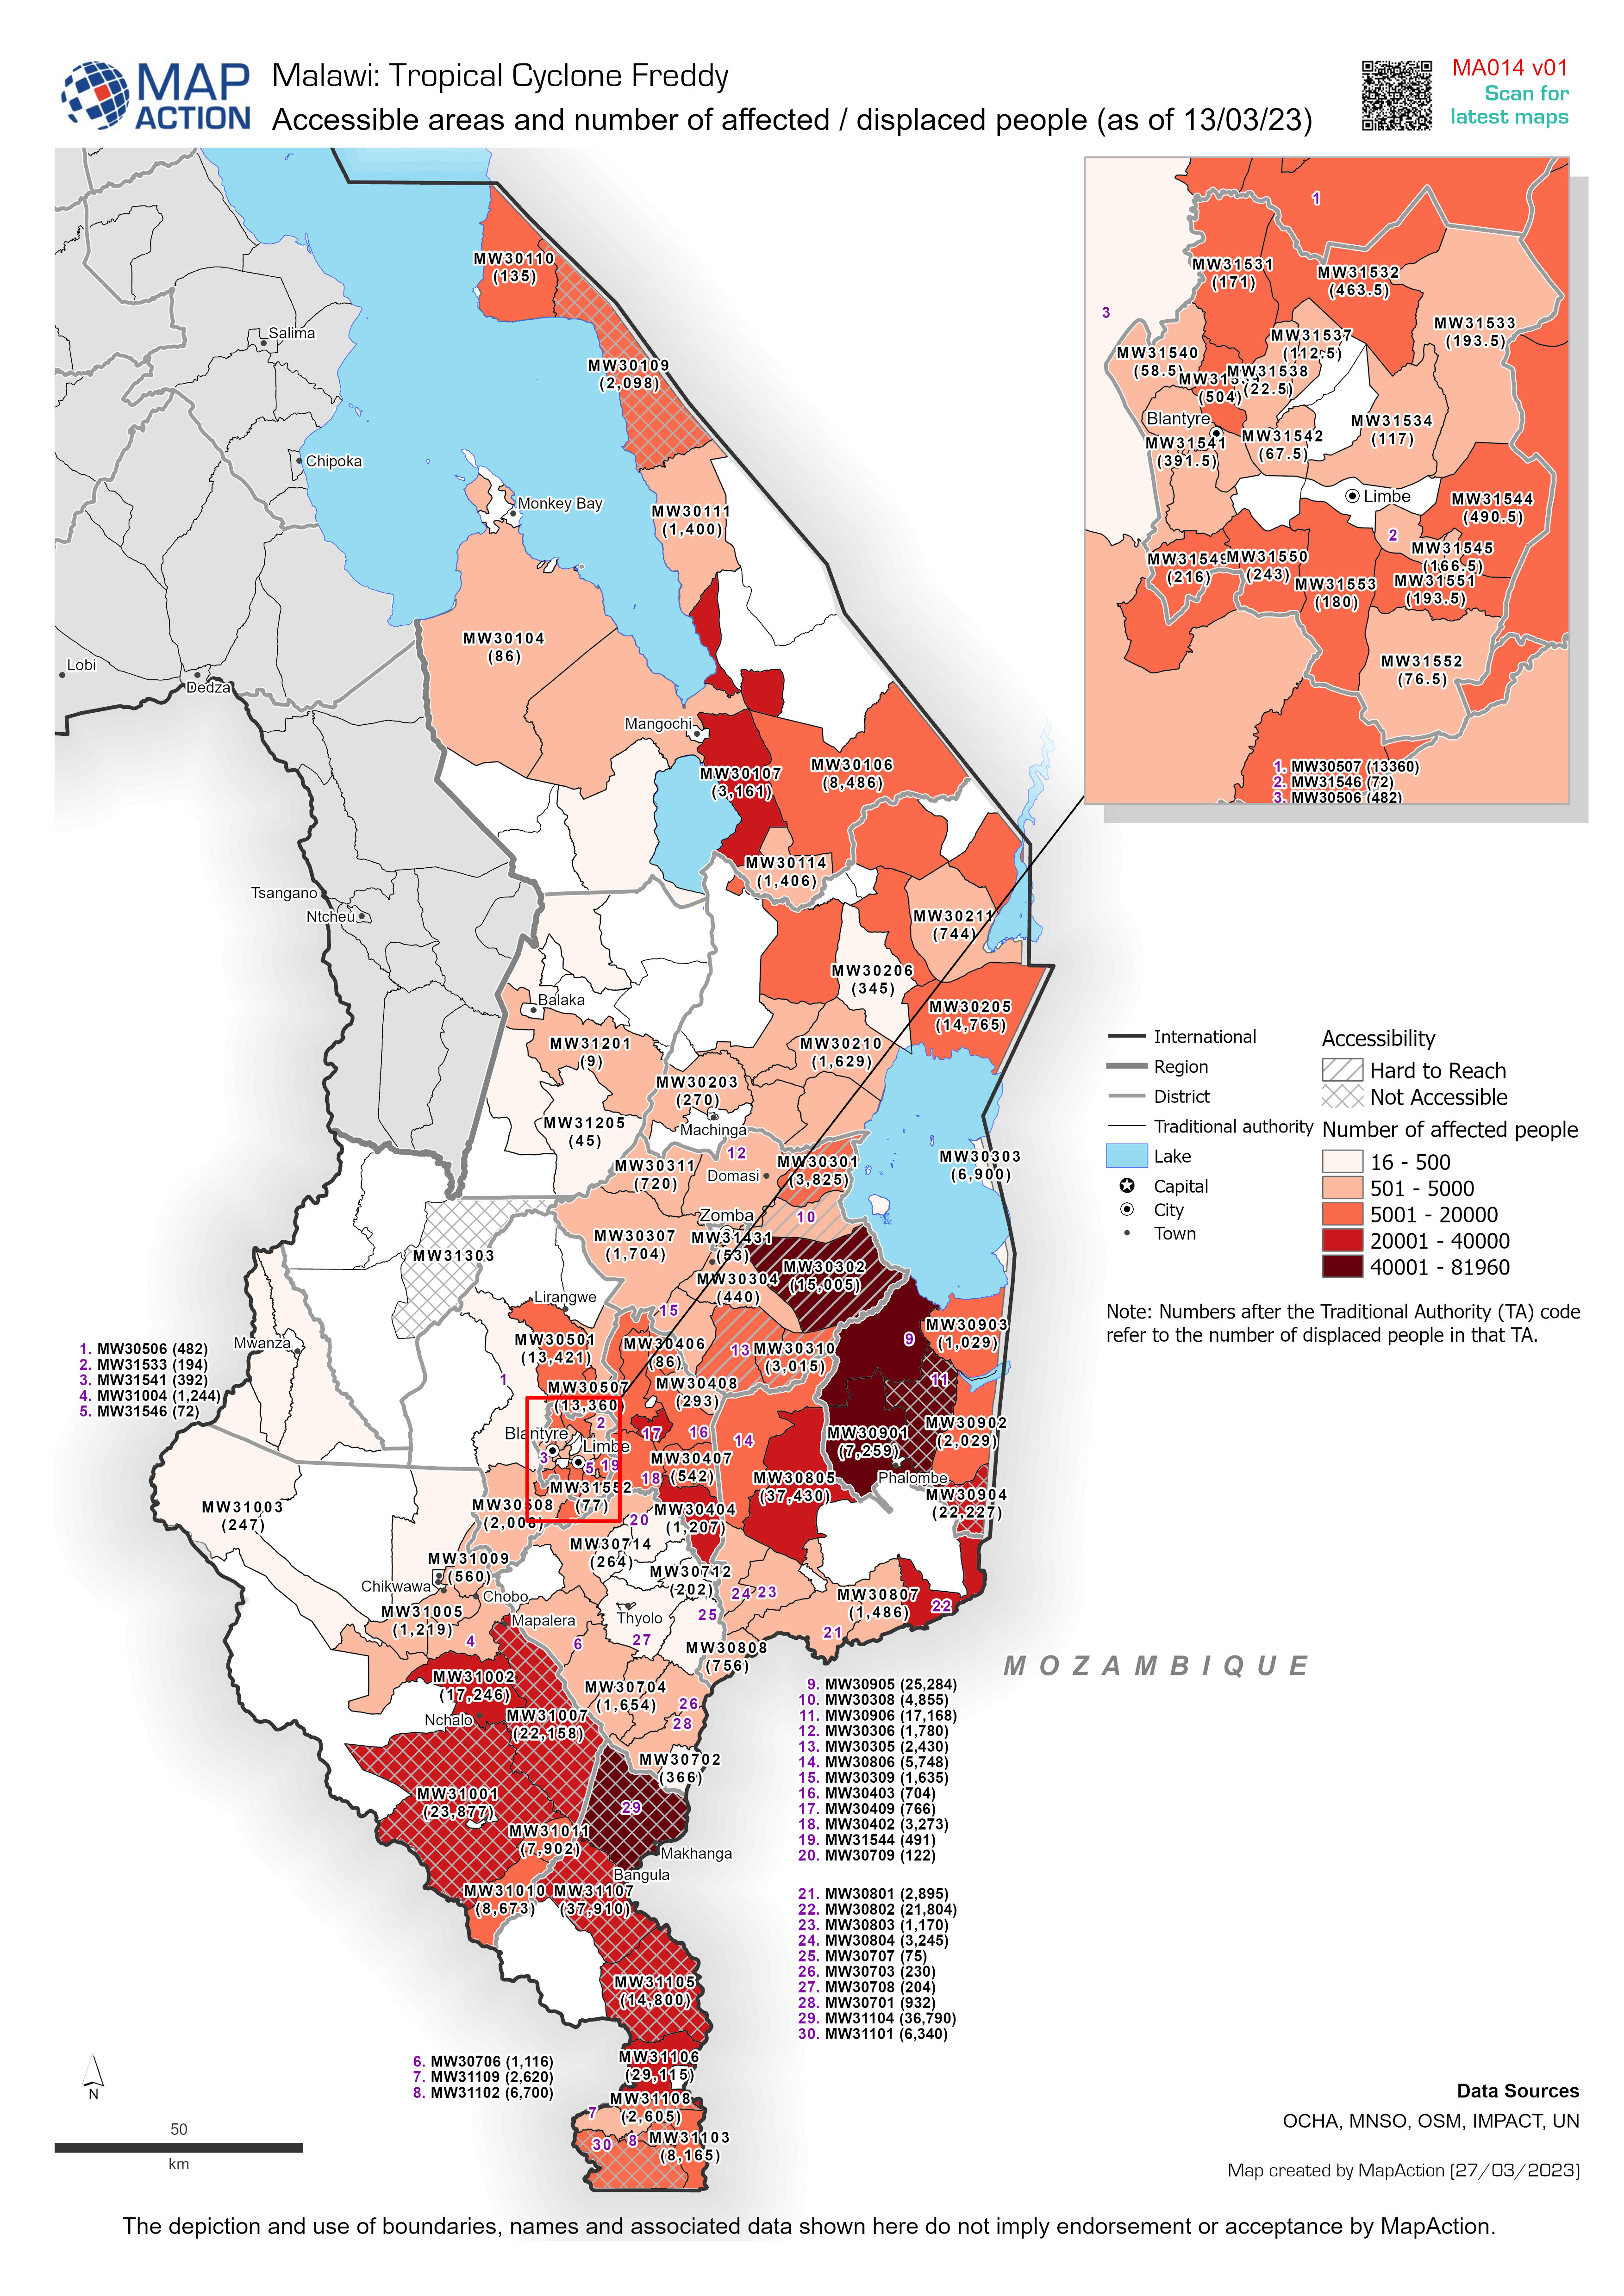
Accessible areas and number of affected / displaced people (as of 13/03/23)
Accessible areas and number of affected and displaced people (as of 13/03/23) -

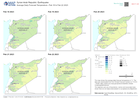
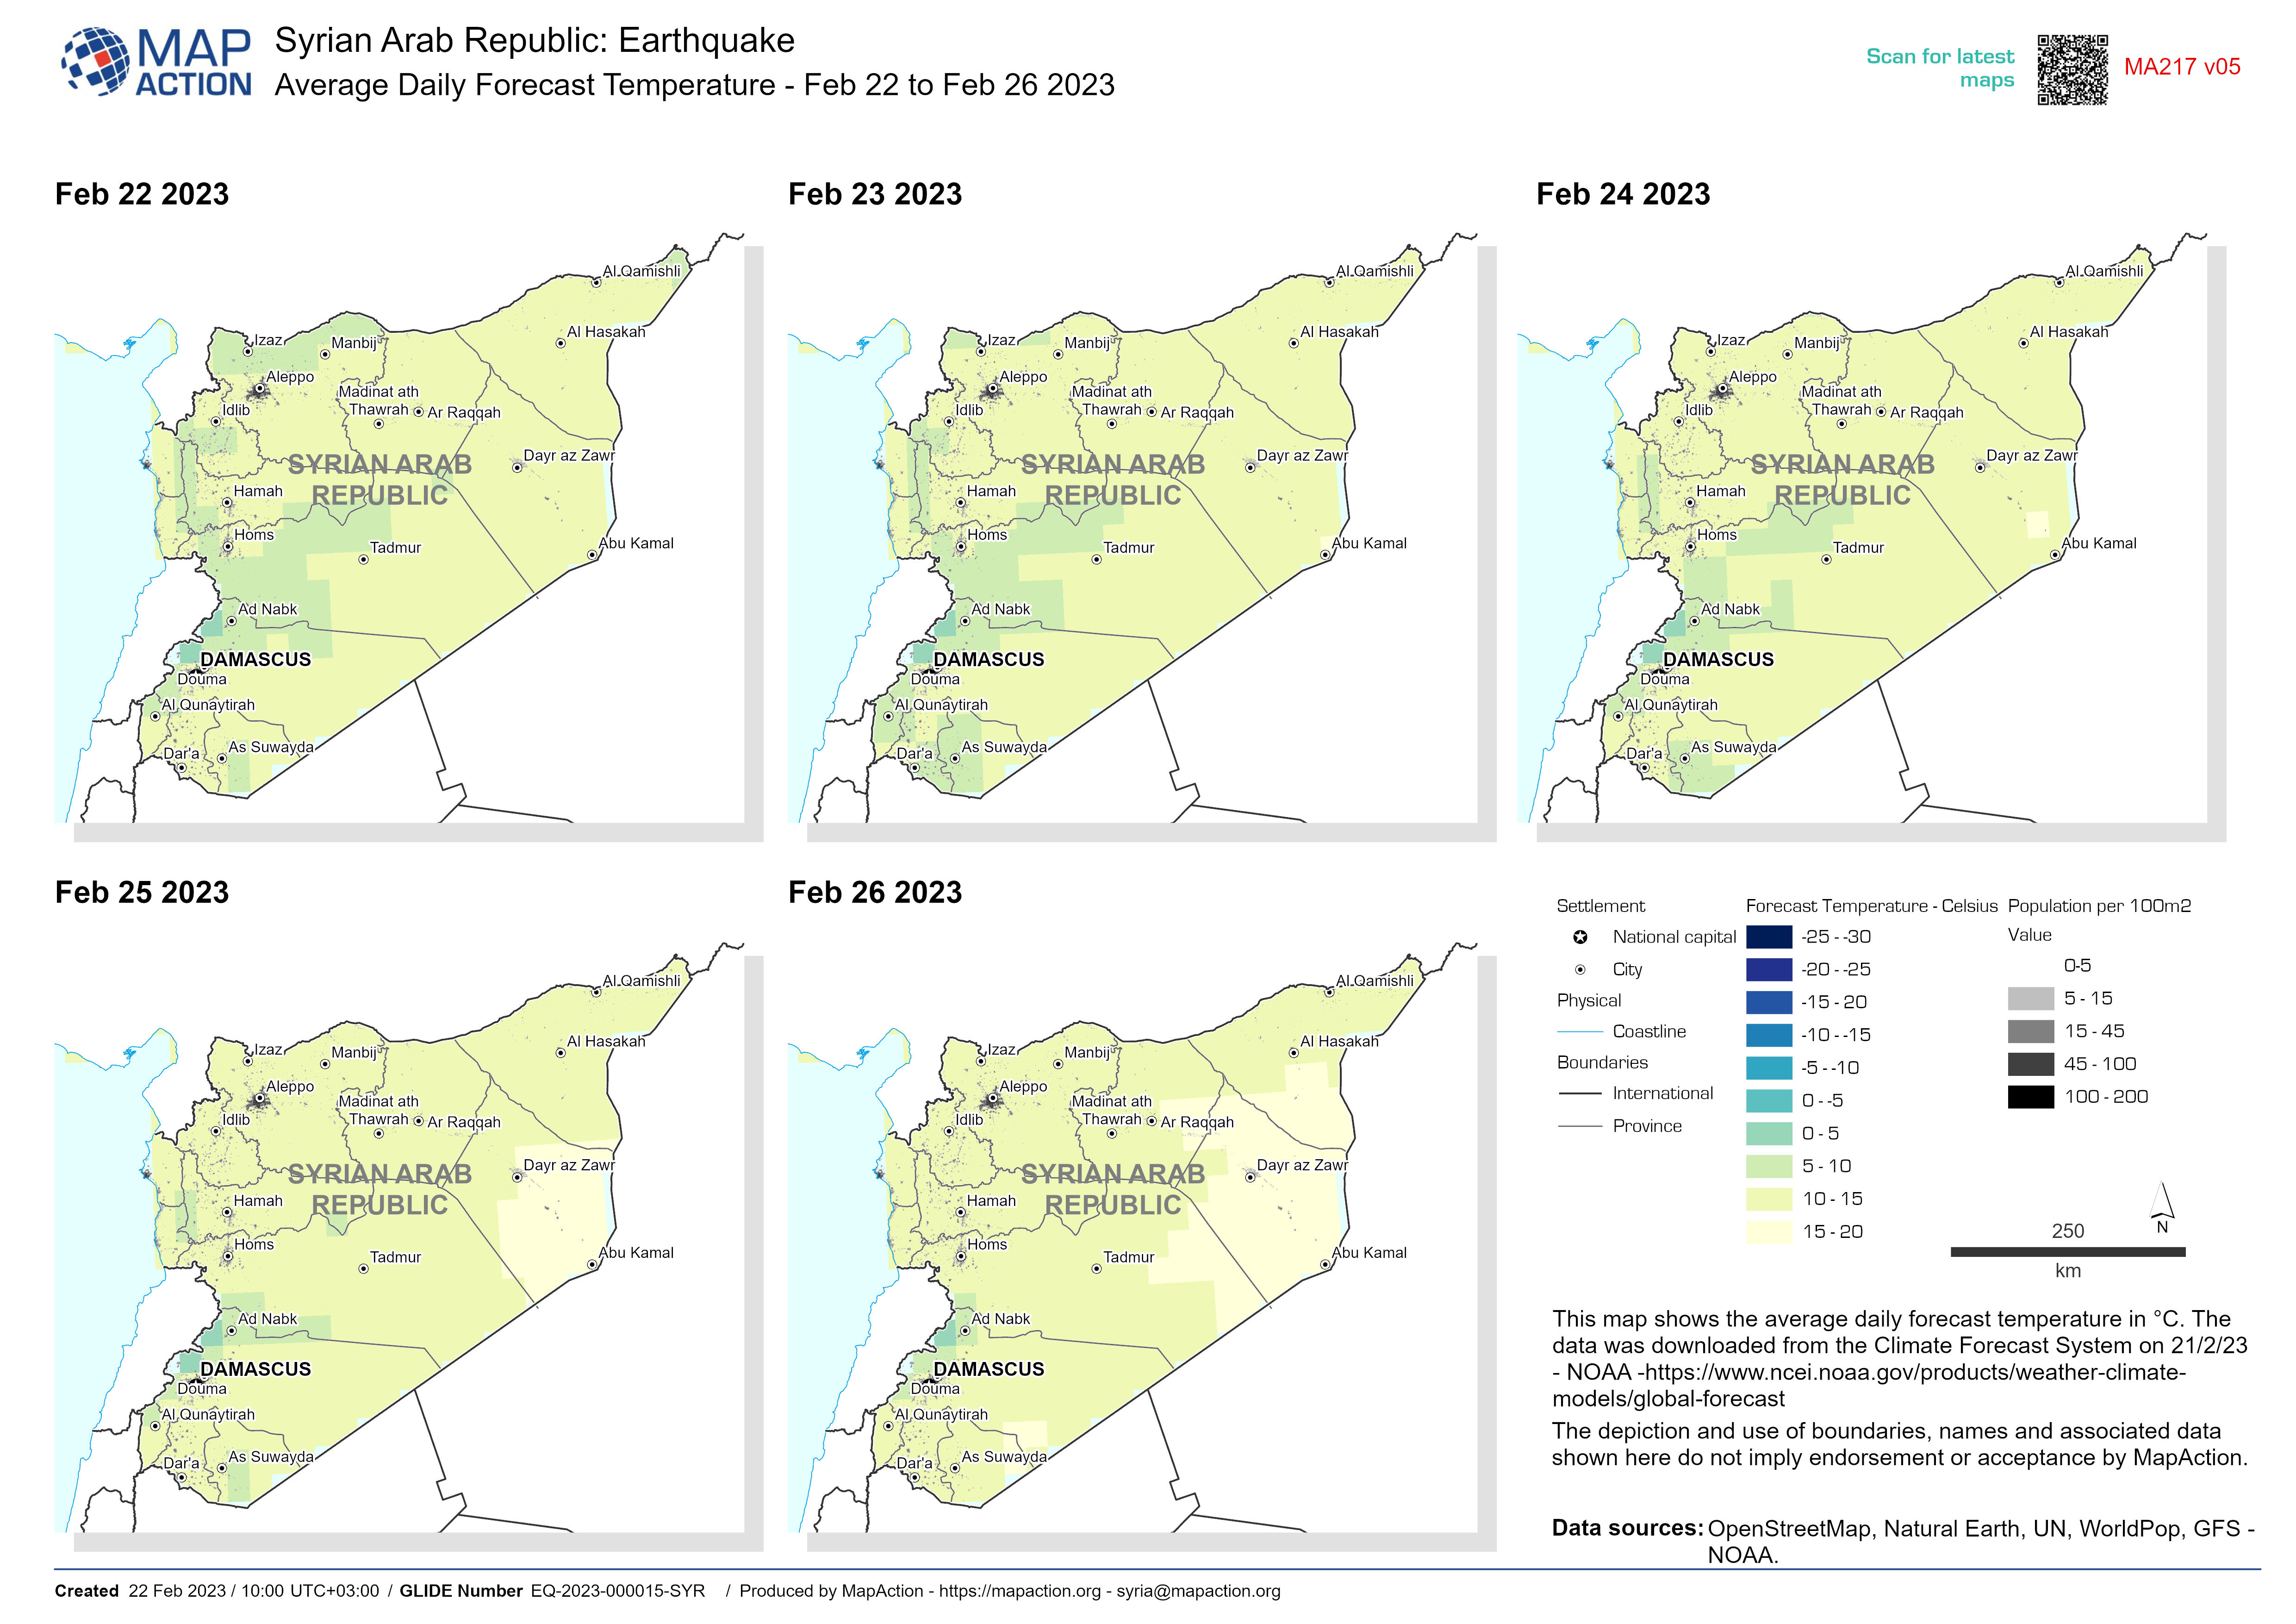
Average Daily Forecast Temperature - Feb 22 to Feb 26 2023
This map shows the average daily forecast temperature in °C. The data was downloaded from the Climate Forecast System on 21/2/23 - NOAA... -

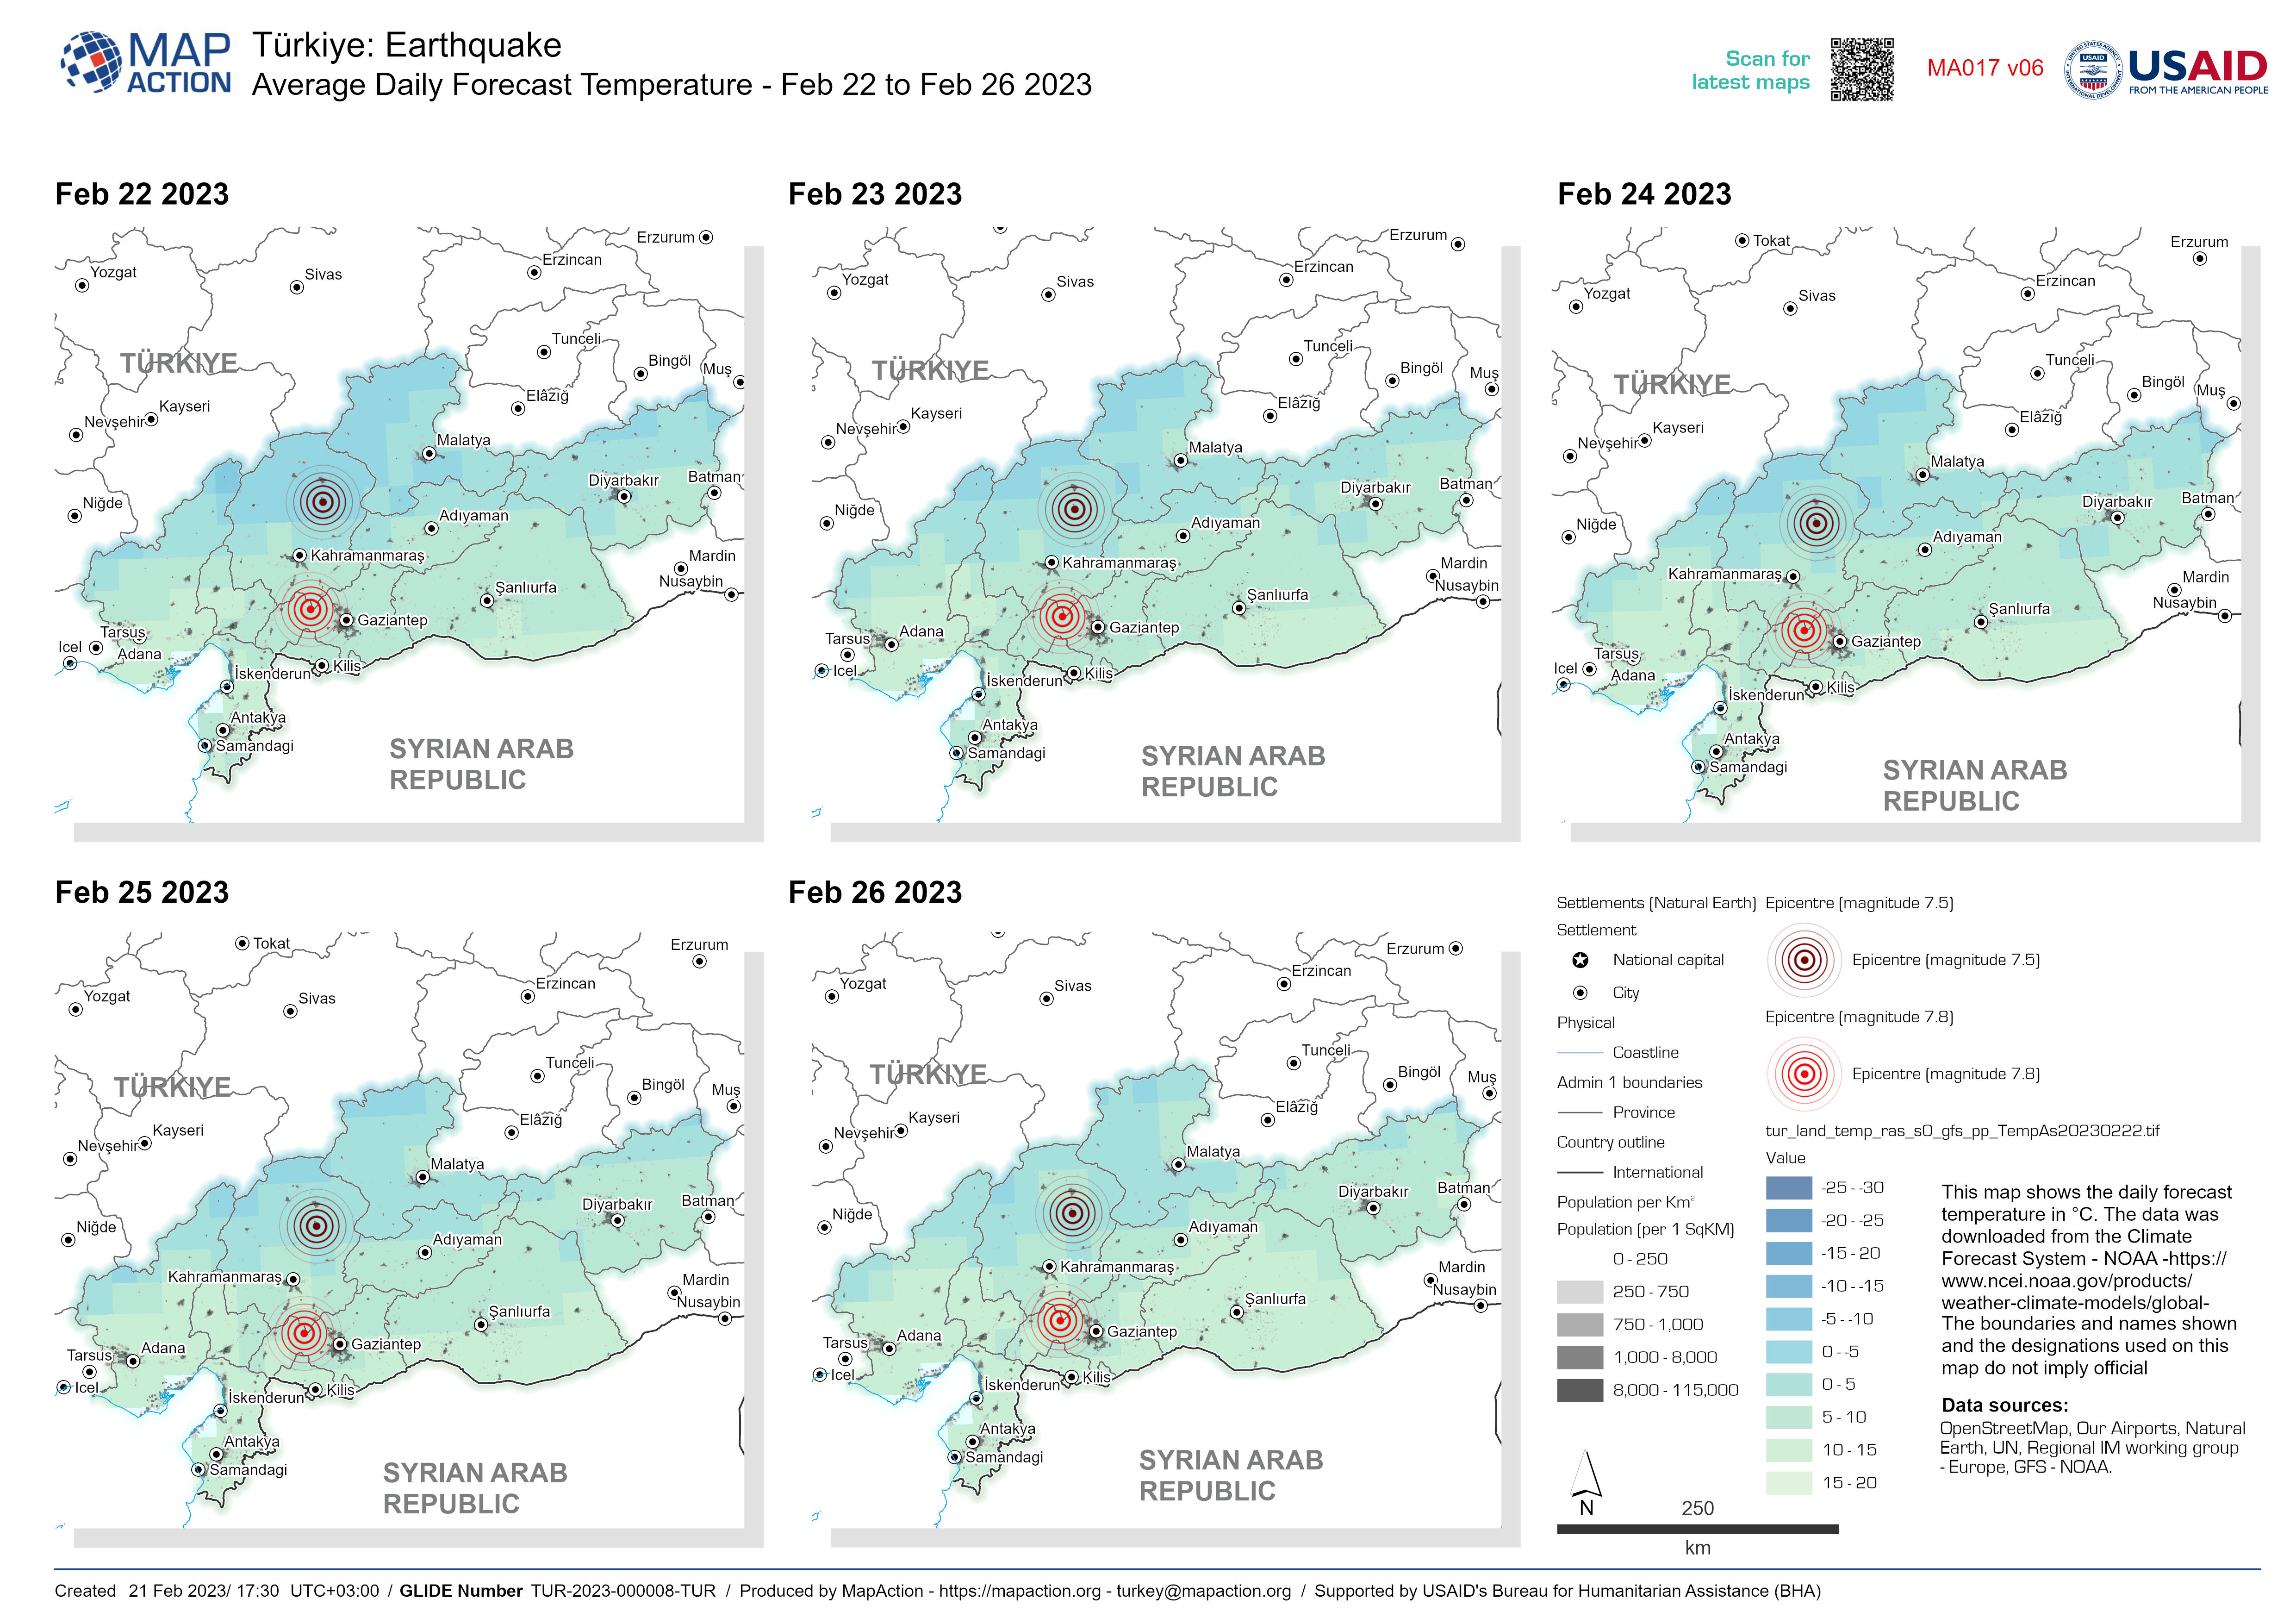
Average Daily Forecast Temperature - Feb 22 to Feb 26 2023
This map shows the daily forecast temperature in °C. The data was downloaded from the Climate Forecast System - NOAA... -
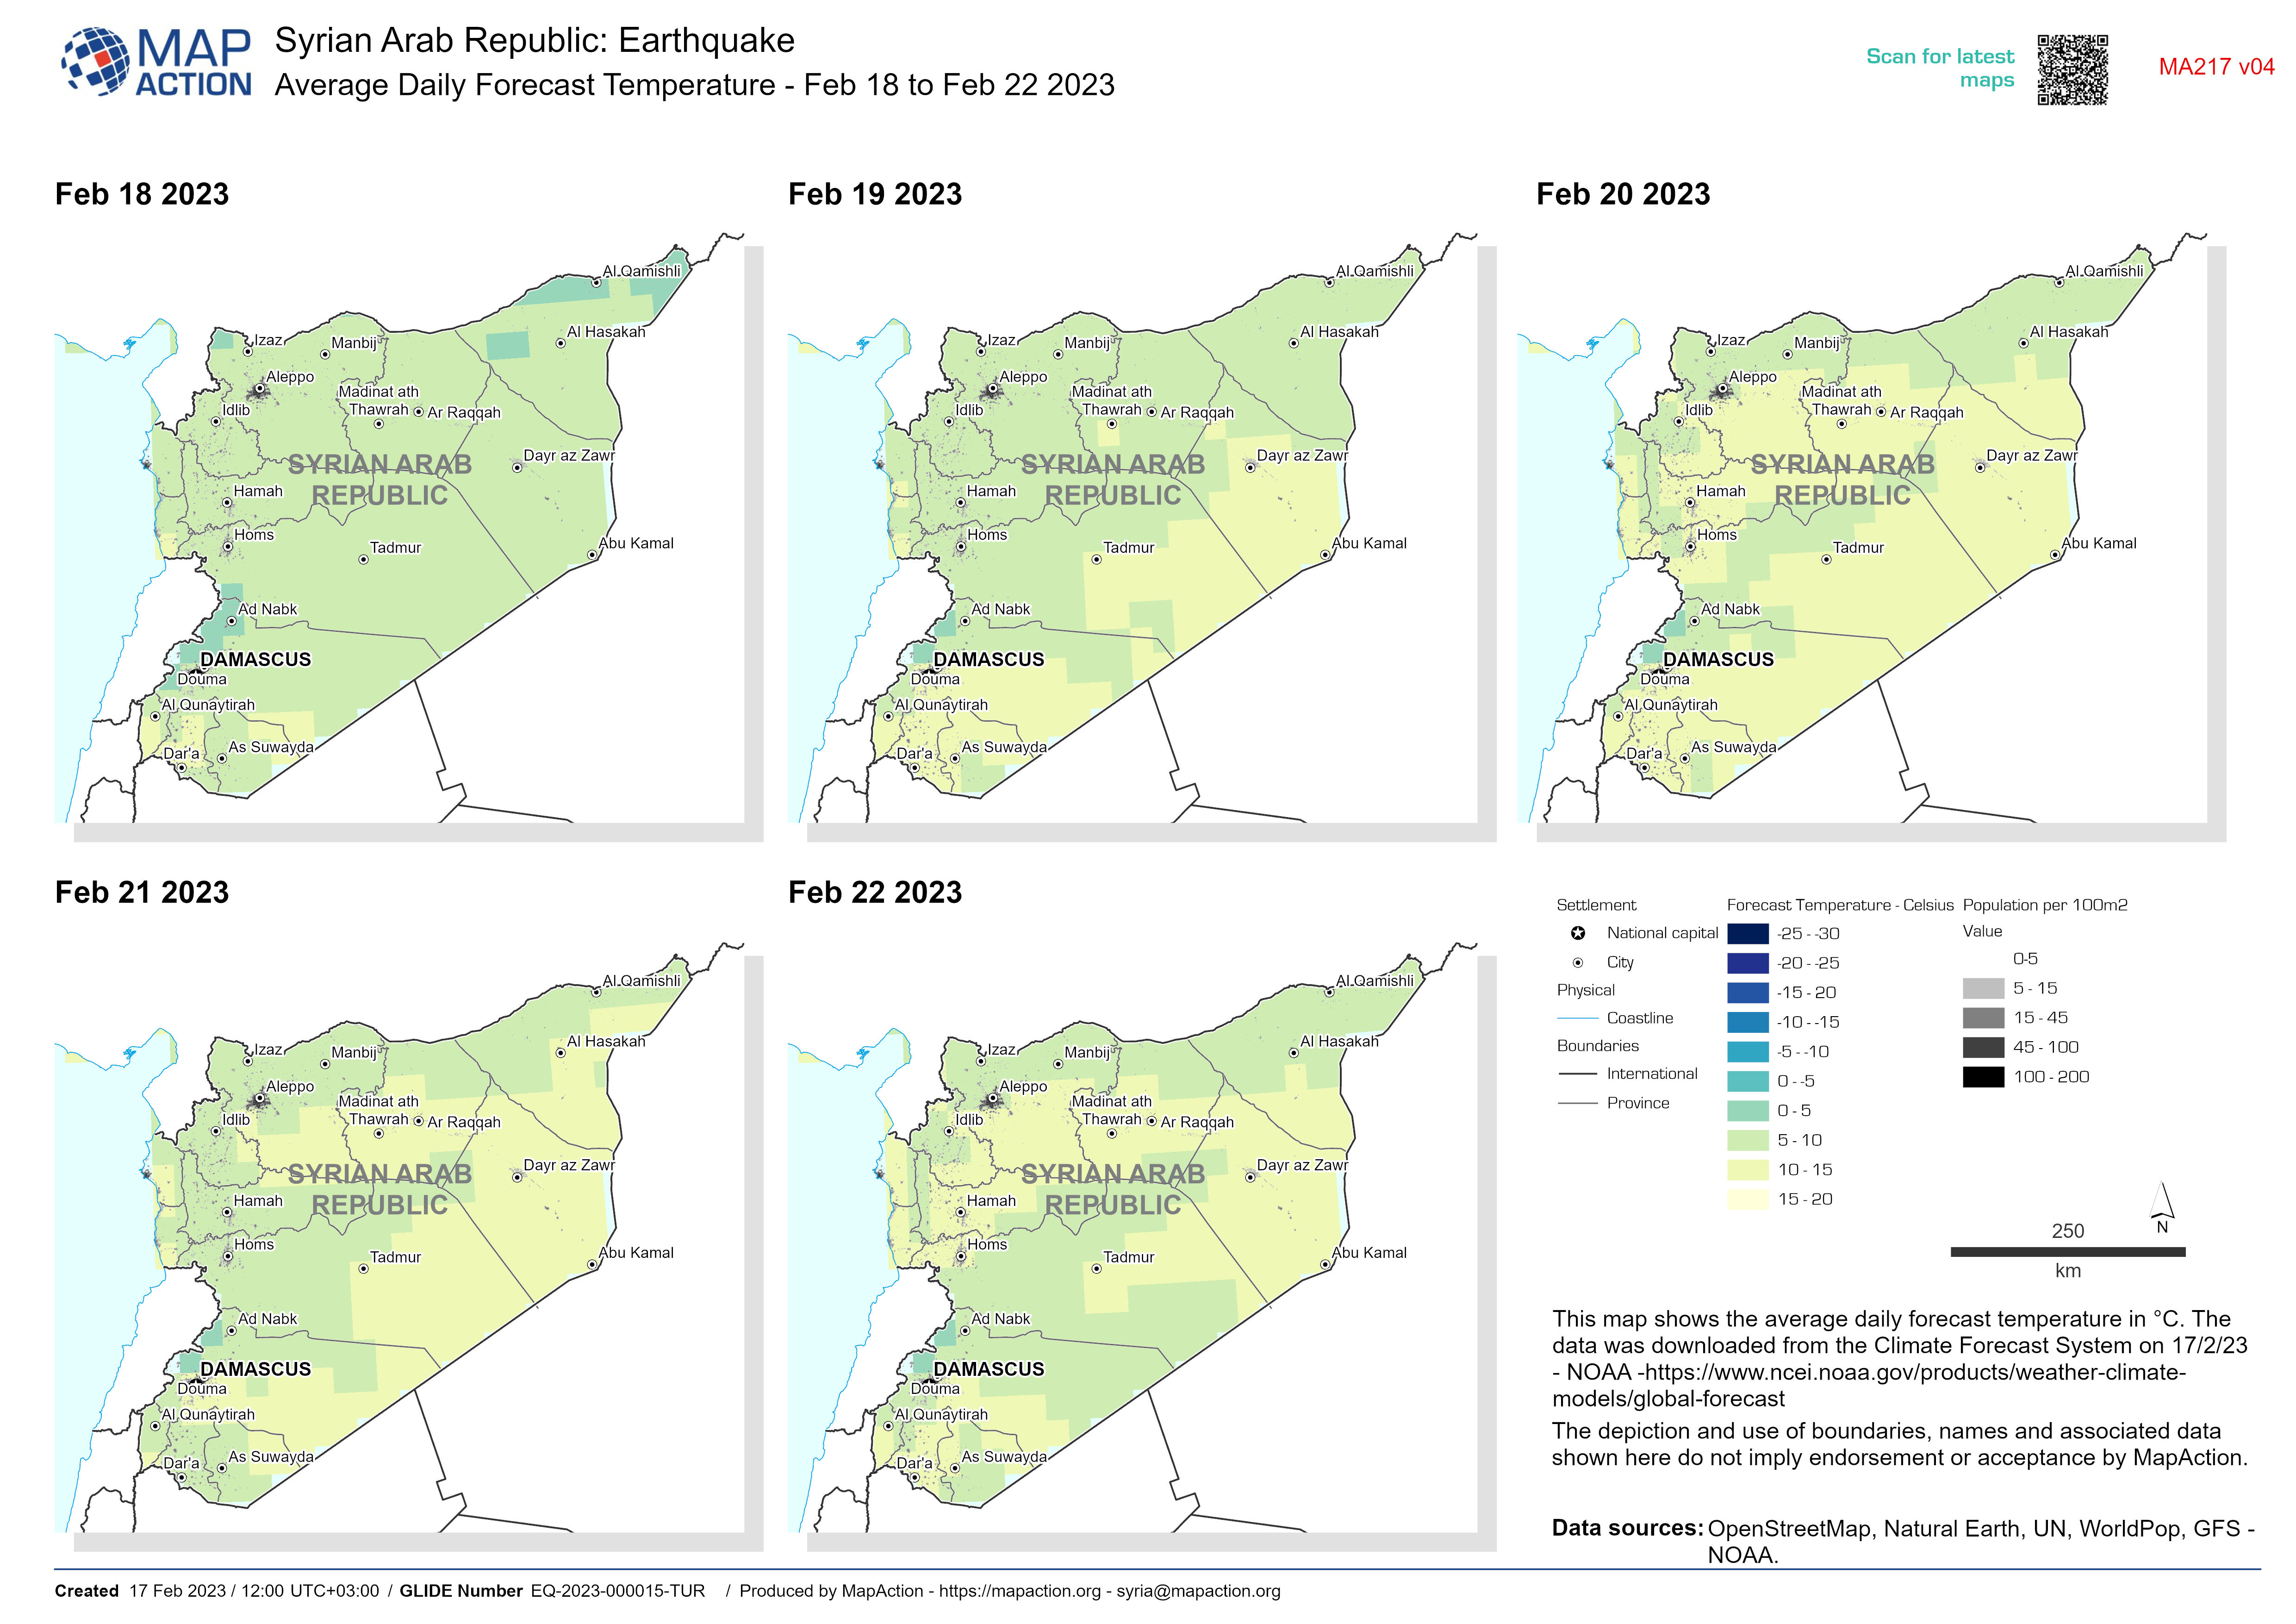
Average Daily Forecast Temperature - Feb 18 to Feb 22 2023
This map shows the average daily forecast temperature in °C. The data was downloaded from the Climate Forecast System on 17/2/23 - NOAA... -

Average Daily Forecast Temperature - Feb 18 to Feb 22 2023
This map shows the daily forecast temperature in °C. The data was downloaded from the Climate Forecast System - NOAA... -

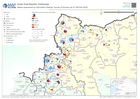
Active fault lines, earthquake epicentres, and aftershocks over 4.5 magnitude...
Map showing earthquake epicentre locations and subsequent M4.5 and over aftershocks up until the 14th Feb 13:00. Earthquake data downloaded form USGS. Active fault lines... -

Baseline Population and Shake Intensity showing Affected Area
Overview of baseline population (using 2020 estimates of density per 100m) within affected region of Syria due to earthquakes on 6th Feb 2023 -
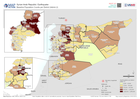
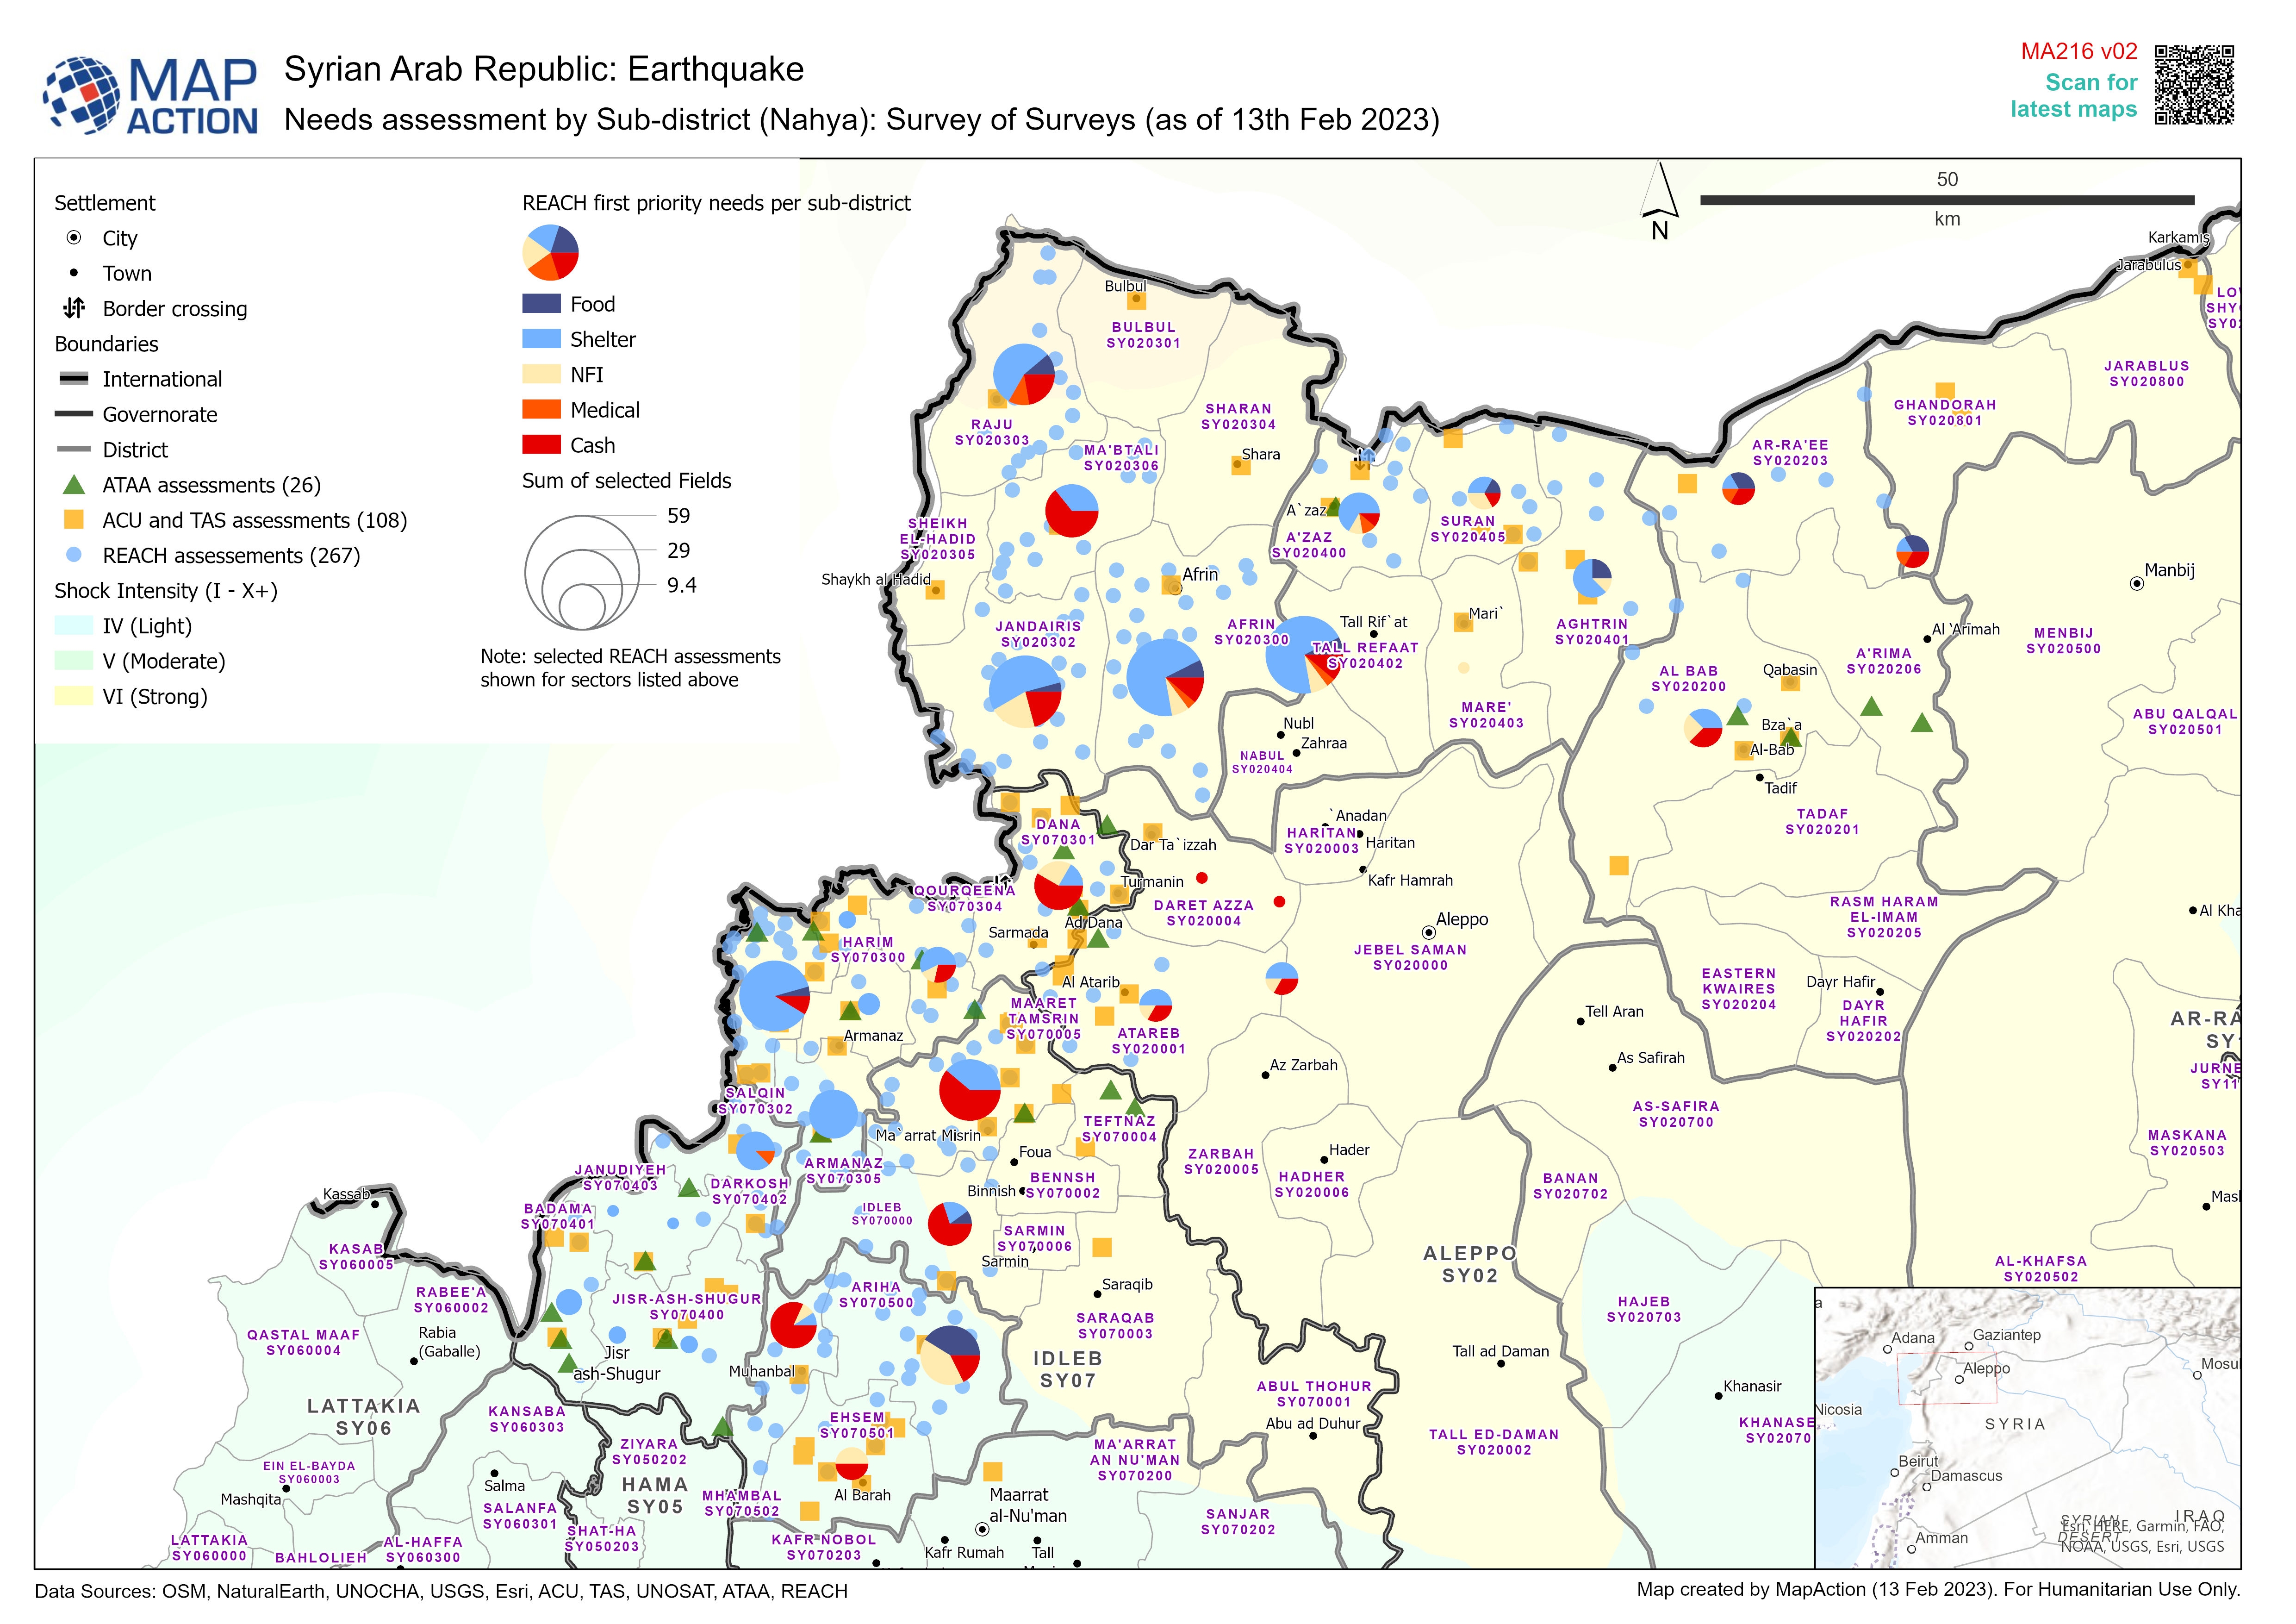
Needs assessment by Sub-district (Nahya): Survey of Surveys (as of 13th Feb 2...
Overview of Survey of Surveys for NW Syria. Basic needs assessment and damage on buildings. Data coming from multiple sources as of Feb 13th 2023. -
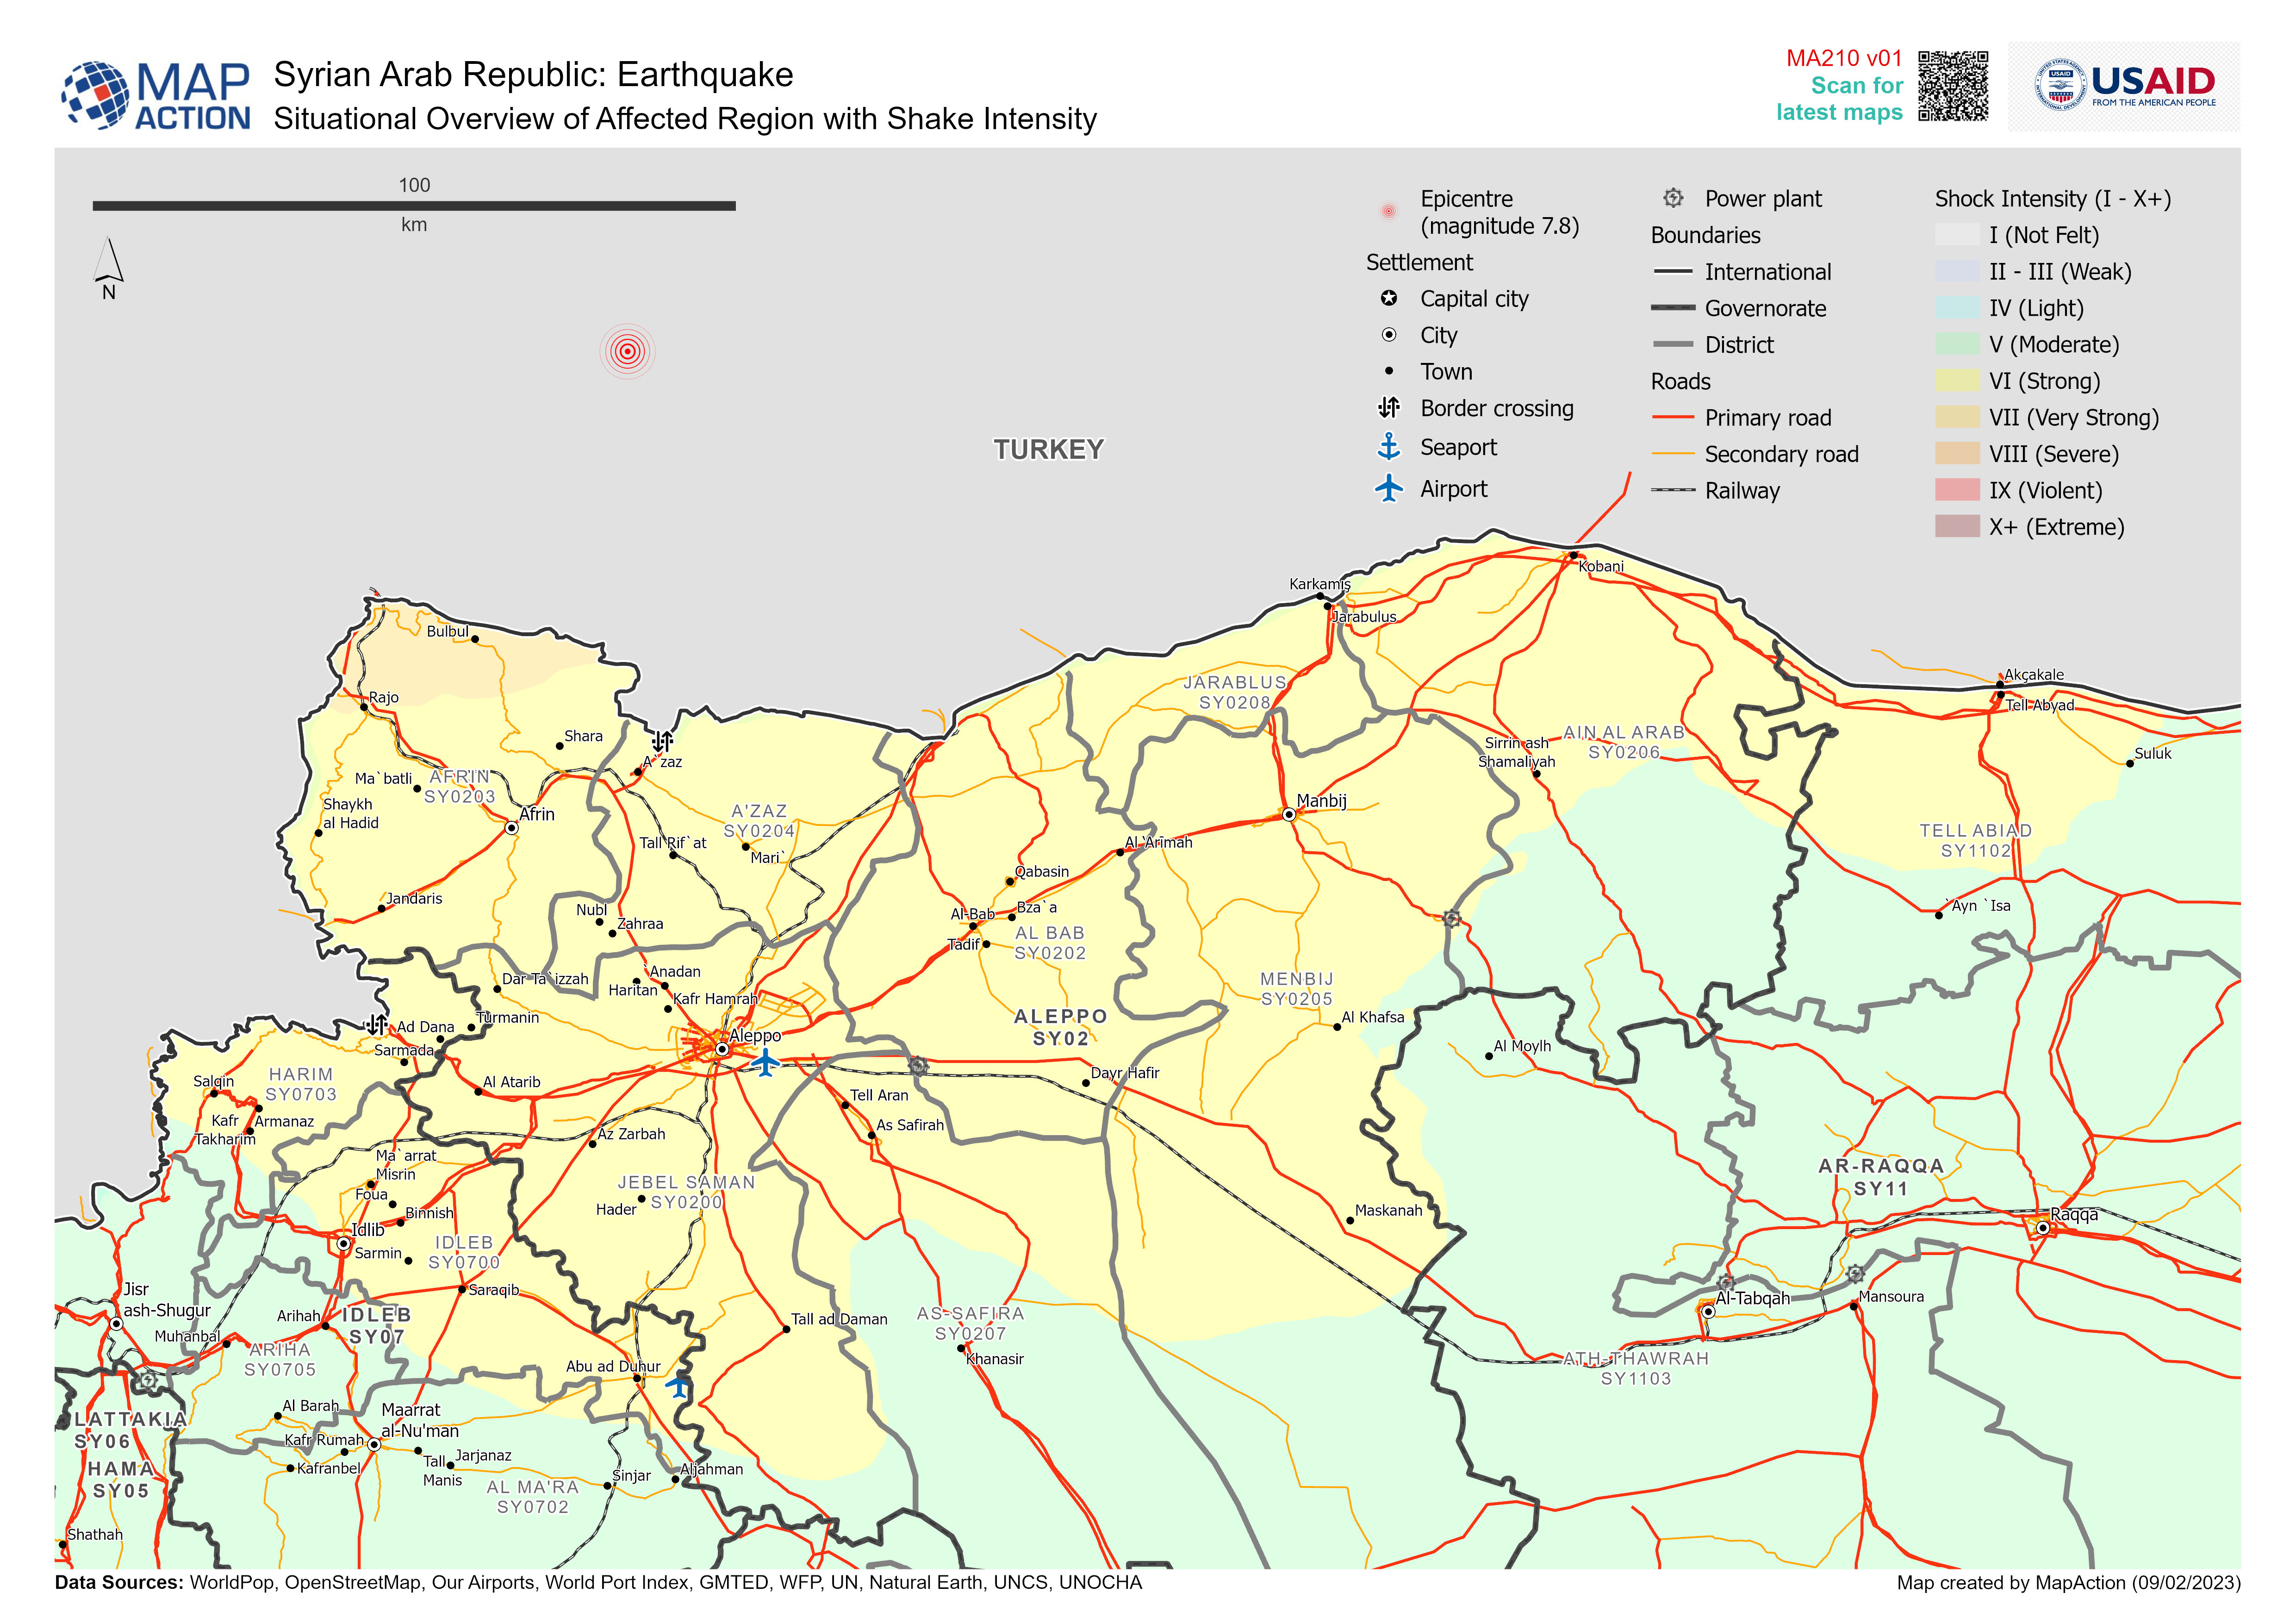
Situational Overview of Affected Region with Shake Intensity
Overview of baseline population (using 2020 estimates of density per 100m) within affected region of Syria due to earthquakes on 6th Feb 2023 -

Baseline Population and Shake Intensity Overview
Overview of baseline population (using 2020 estimates) within affected region of Syria due to earthquakes on 6th Feb 2023 -
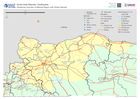
Baseline Population Counts per District (Admin 2)
Overview of baseline population (total number of people per District (Admin 2)) -

District (Level 2 Admin Boundaries) with Earthquake Intensity:
District (Level 2 Administrative Boundaries) with earthquake intensity from earthquakes on 6th Feb 2023 -
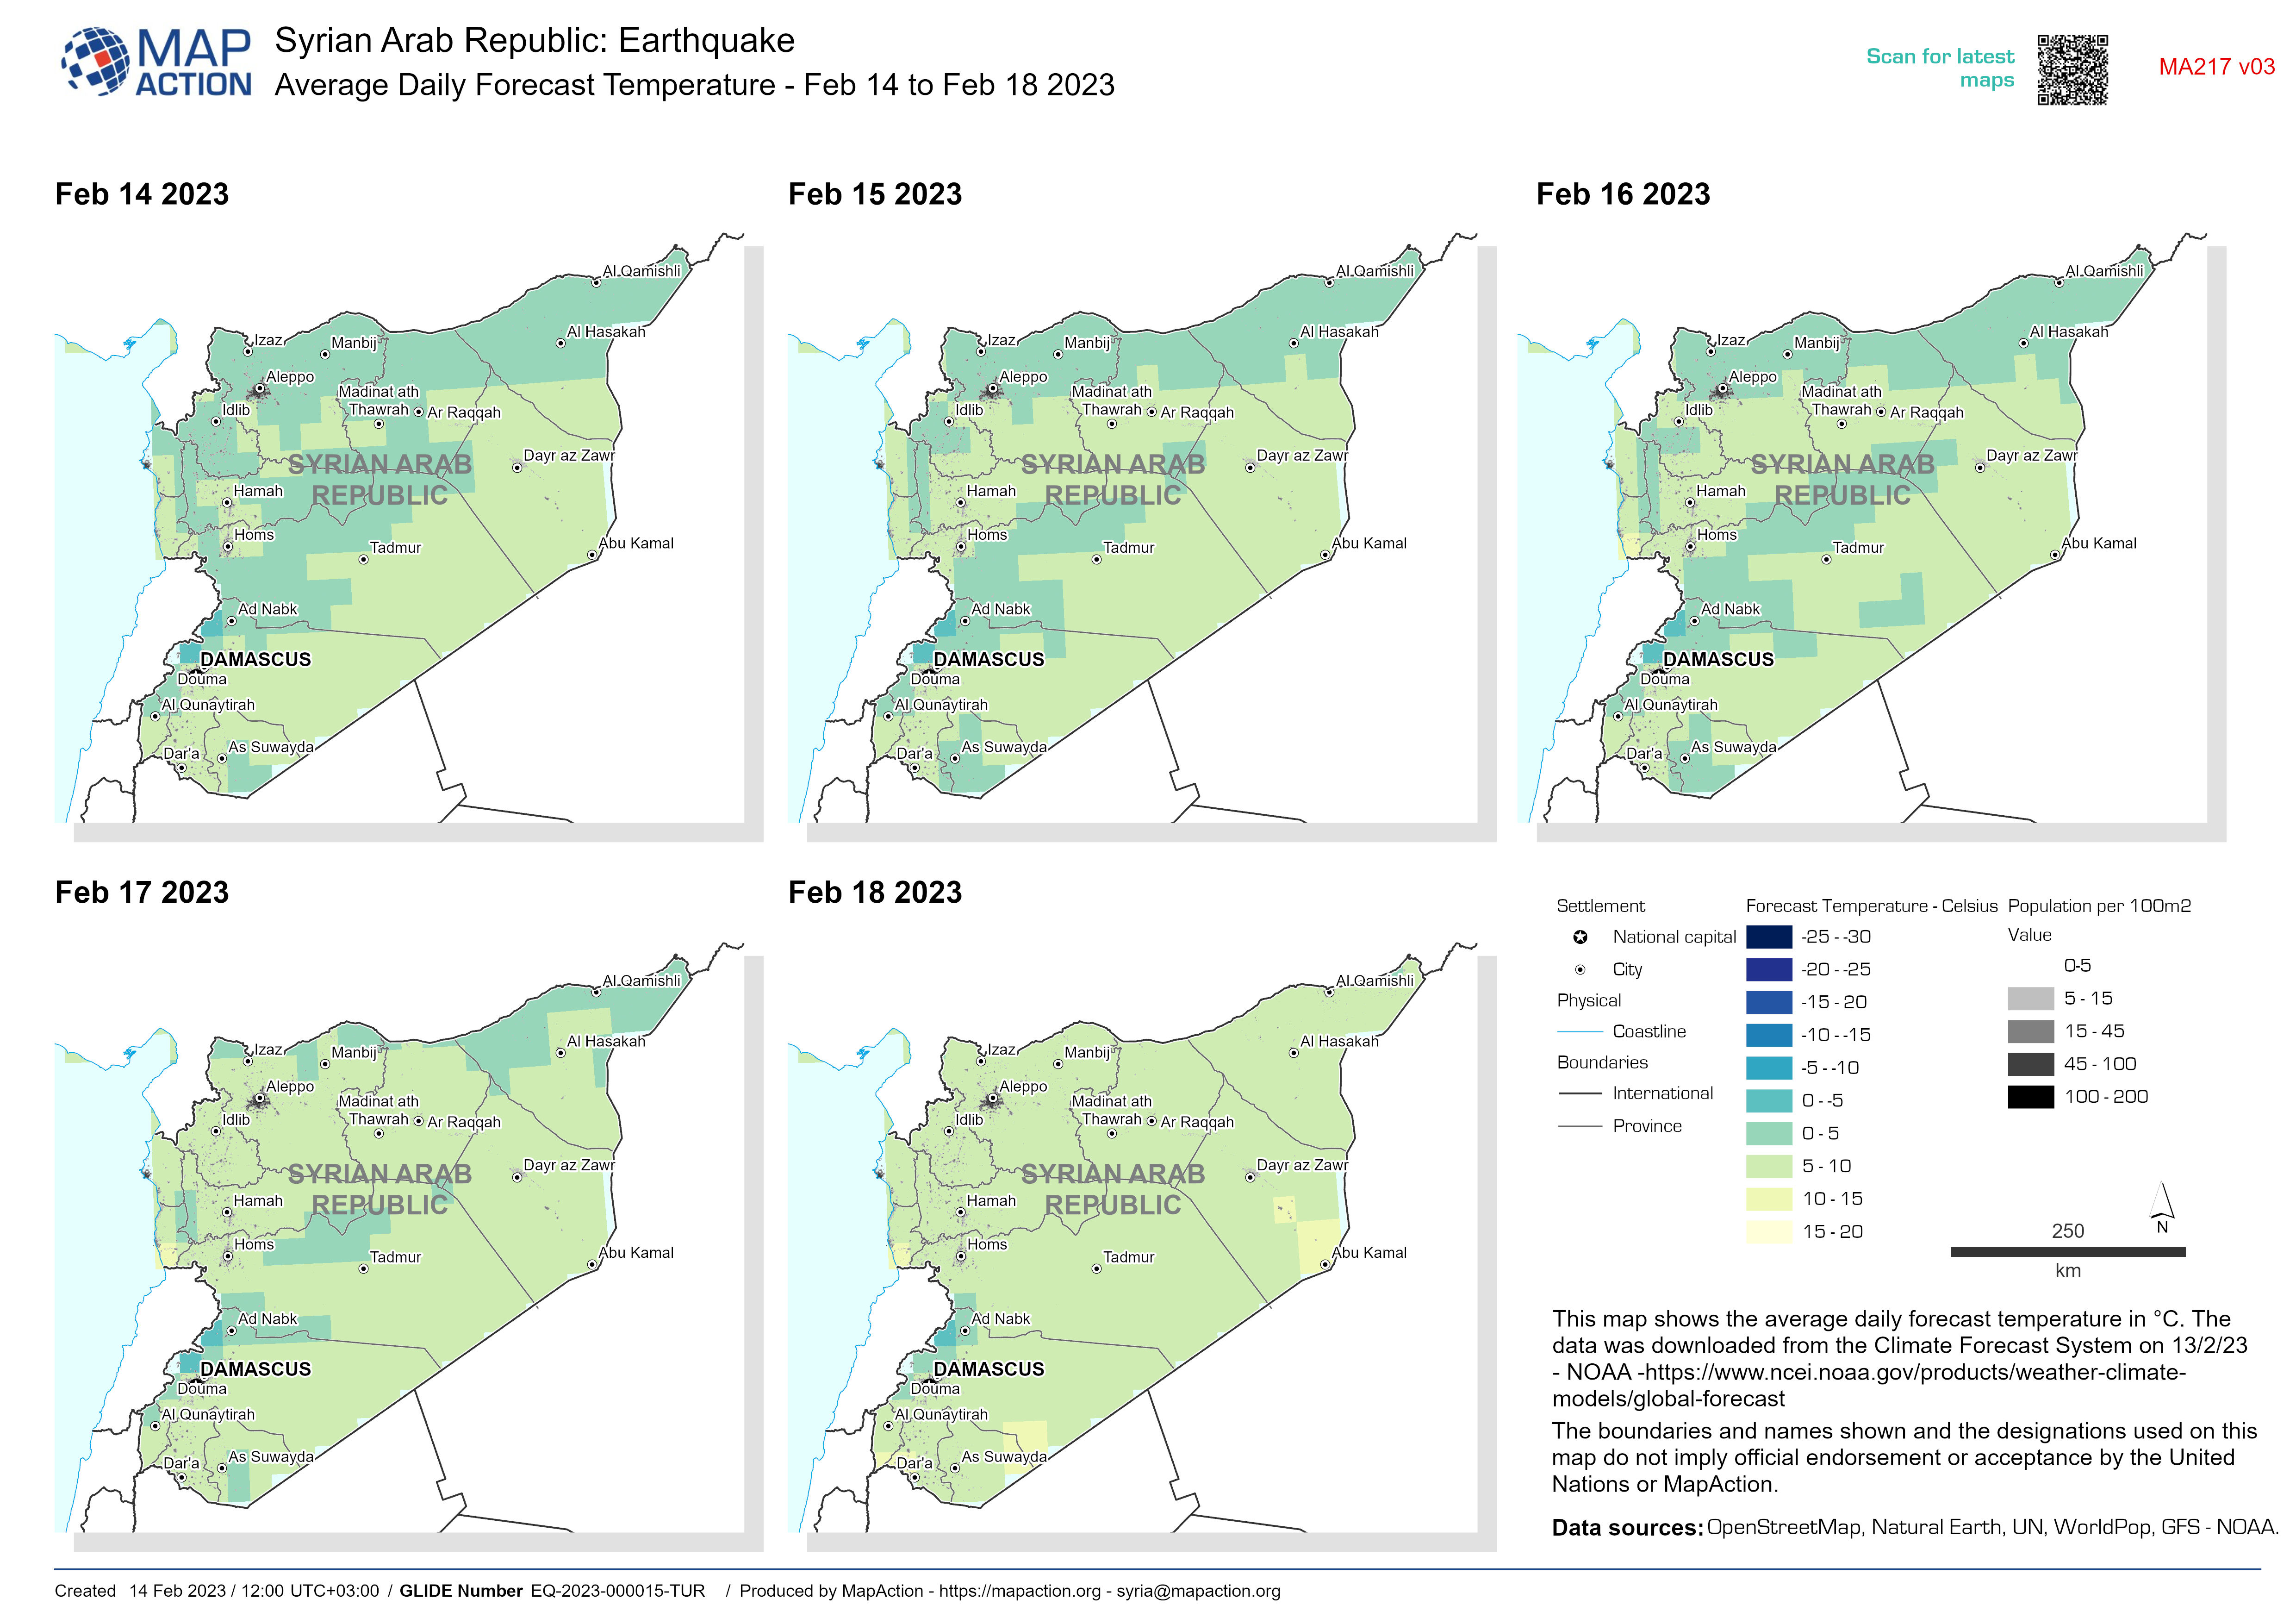
Average Daily Forecast Temperature - Feb 14 to Feb 18 2023
This map shows the average daily forecast temperature in °C. The data was downloaded from the Climate Forecast System on 13/2/23 - NOAA... -

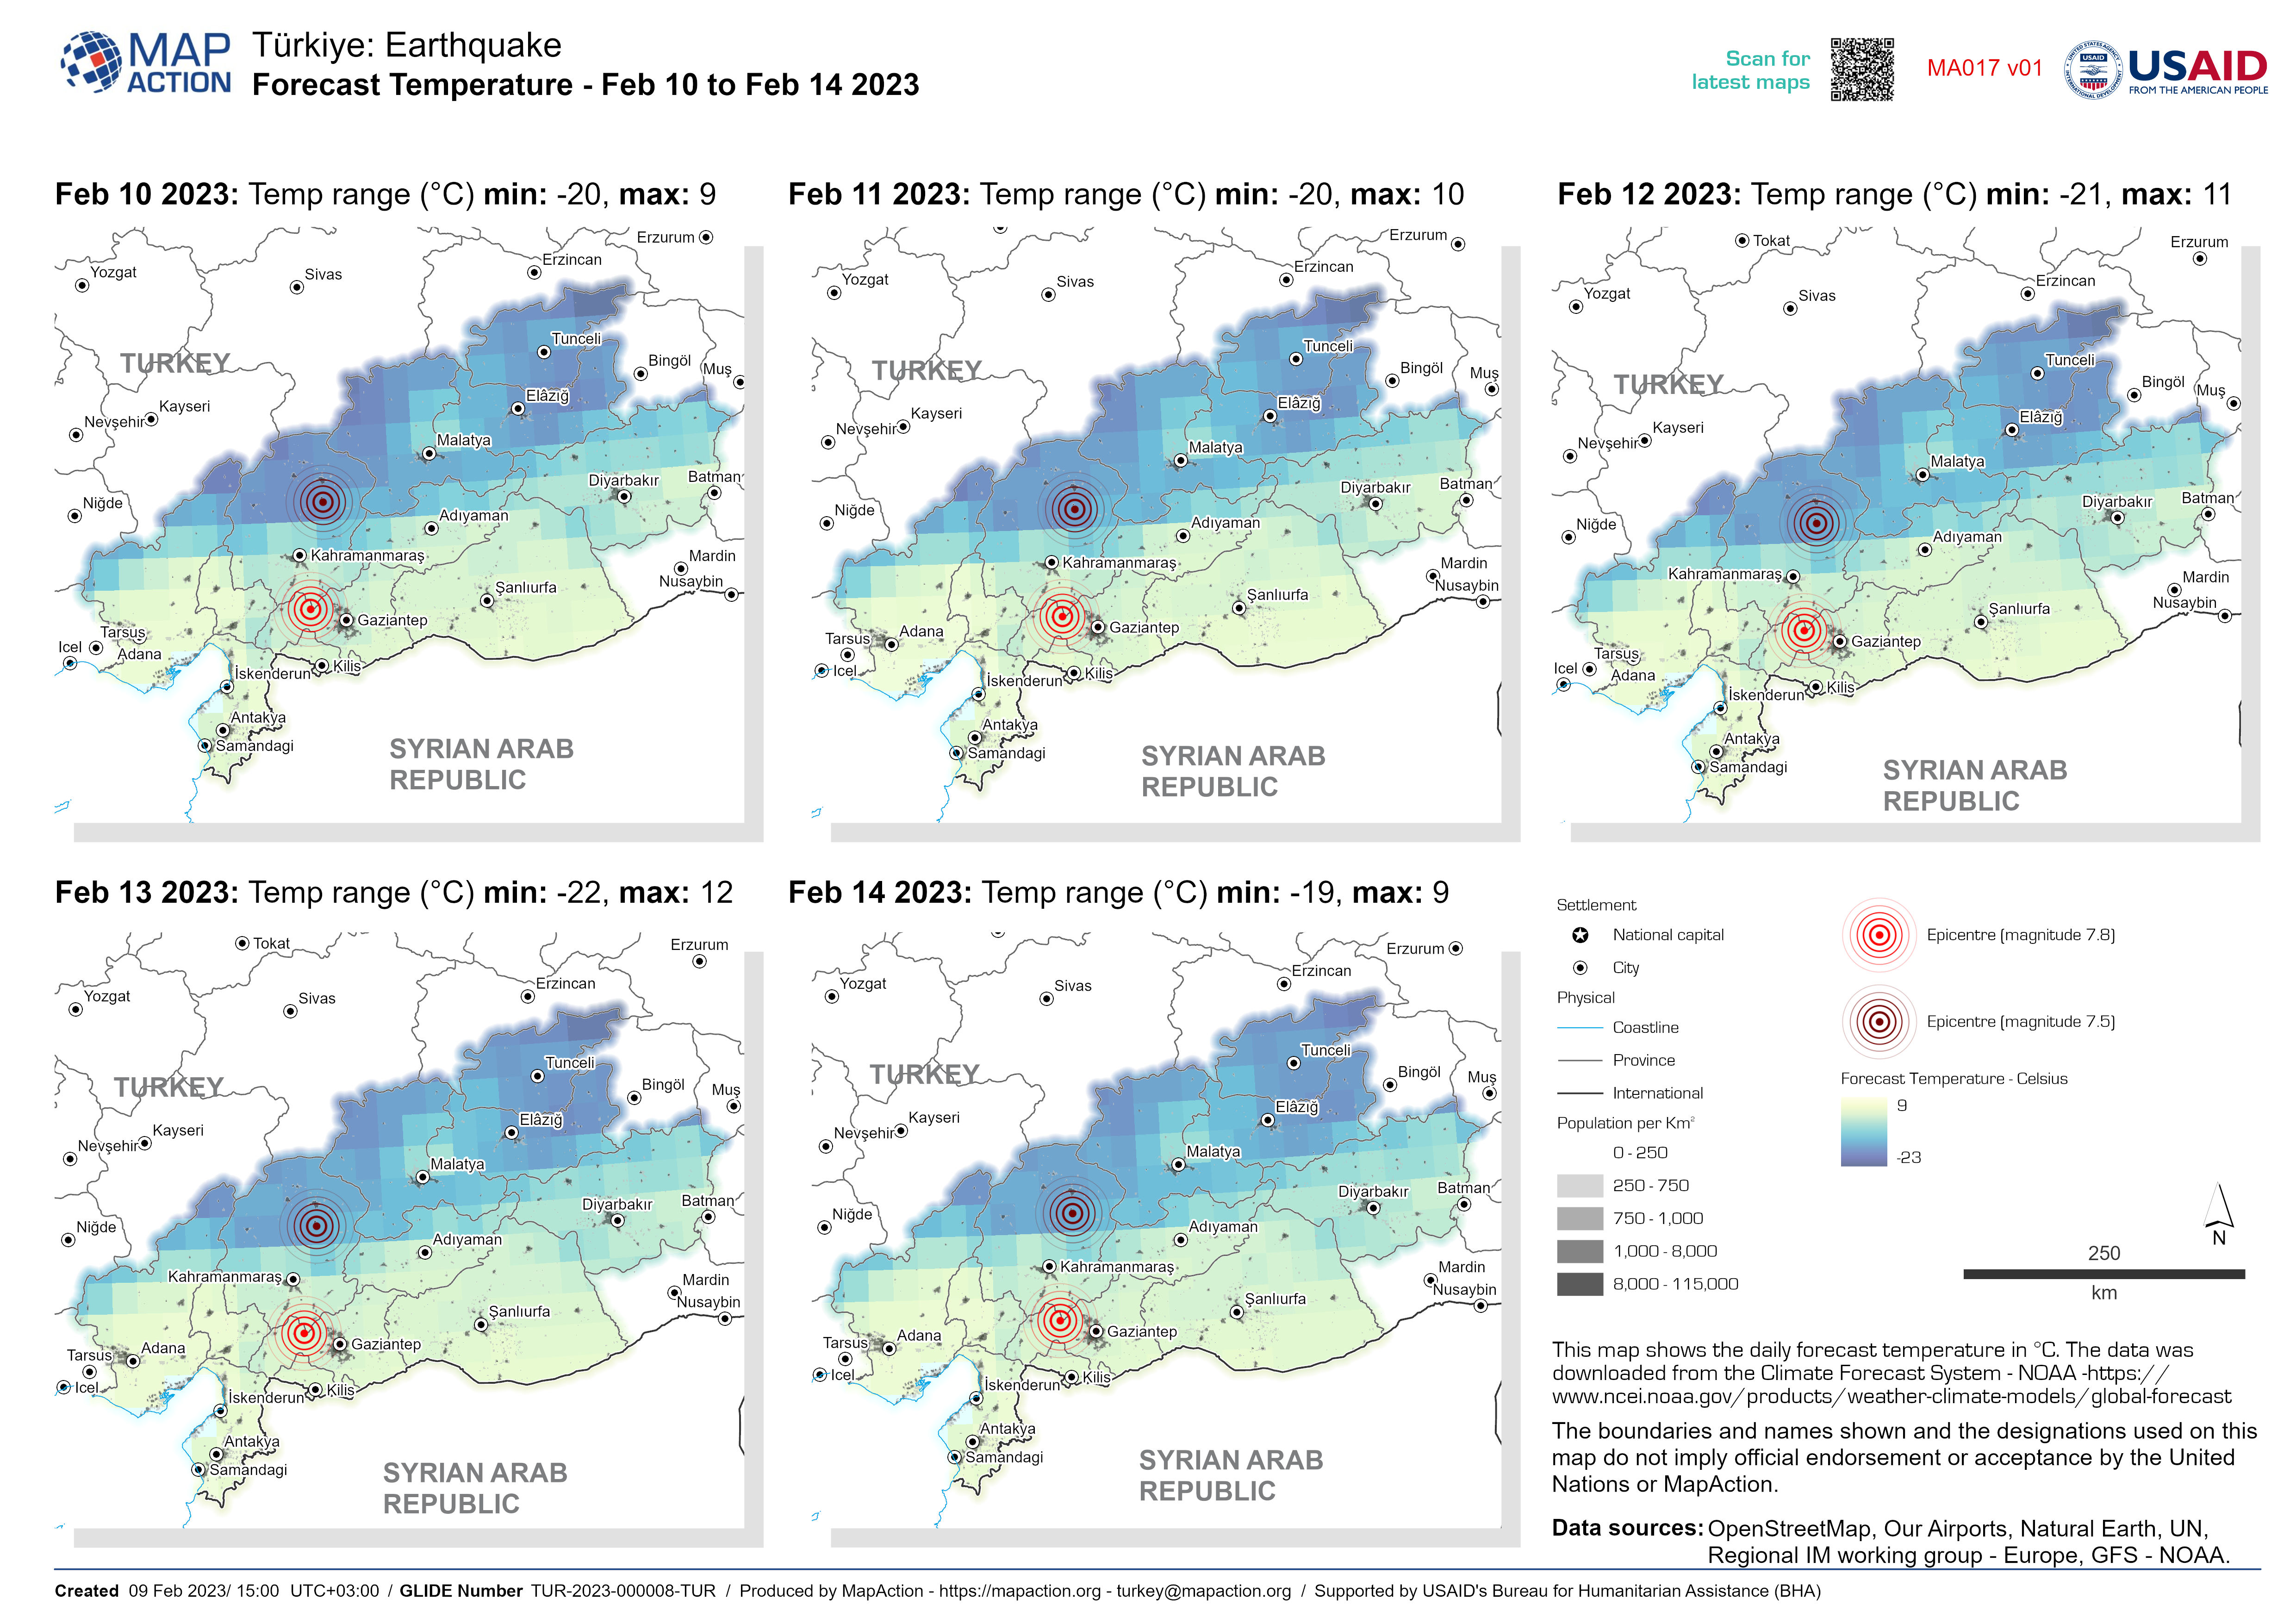
Average Daily Forecast Temperature - Feb 10 to Feb 14 2023
This map shows the daily forecast temperature in °C. The data was downloaded from the Climate Forecast System - NOAA...