-

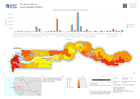
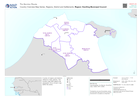
Affected population by district as a proportion of the total population (as o...
Affected population calculated as a percentage of total population. Affected population based on data for 18 August 2022. Total population is estimated from WorldPop data for 2020 -

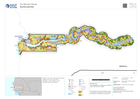
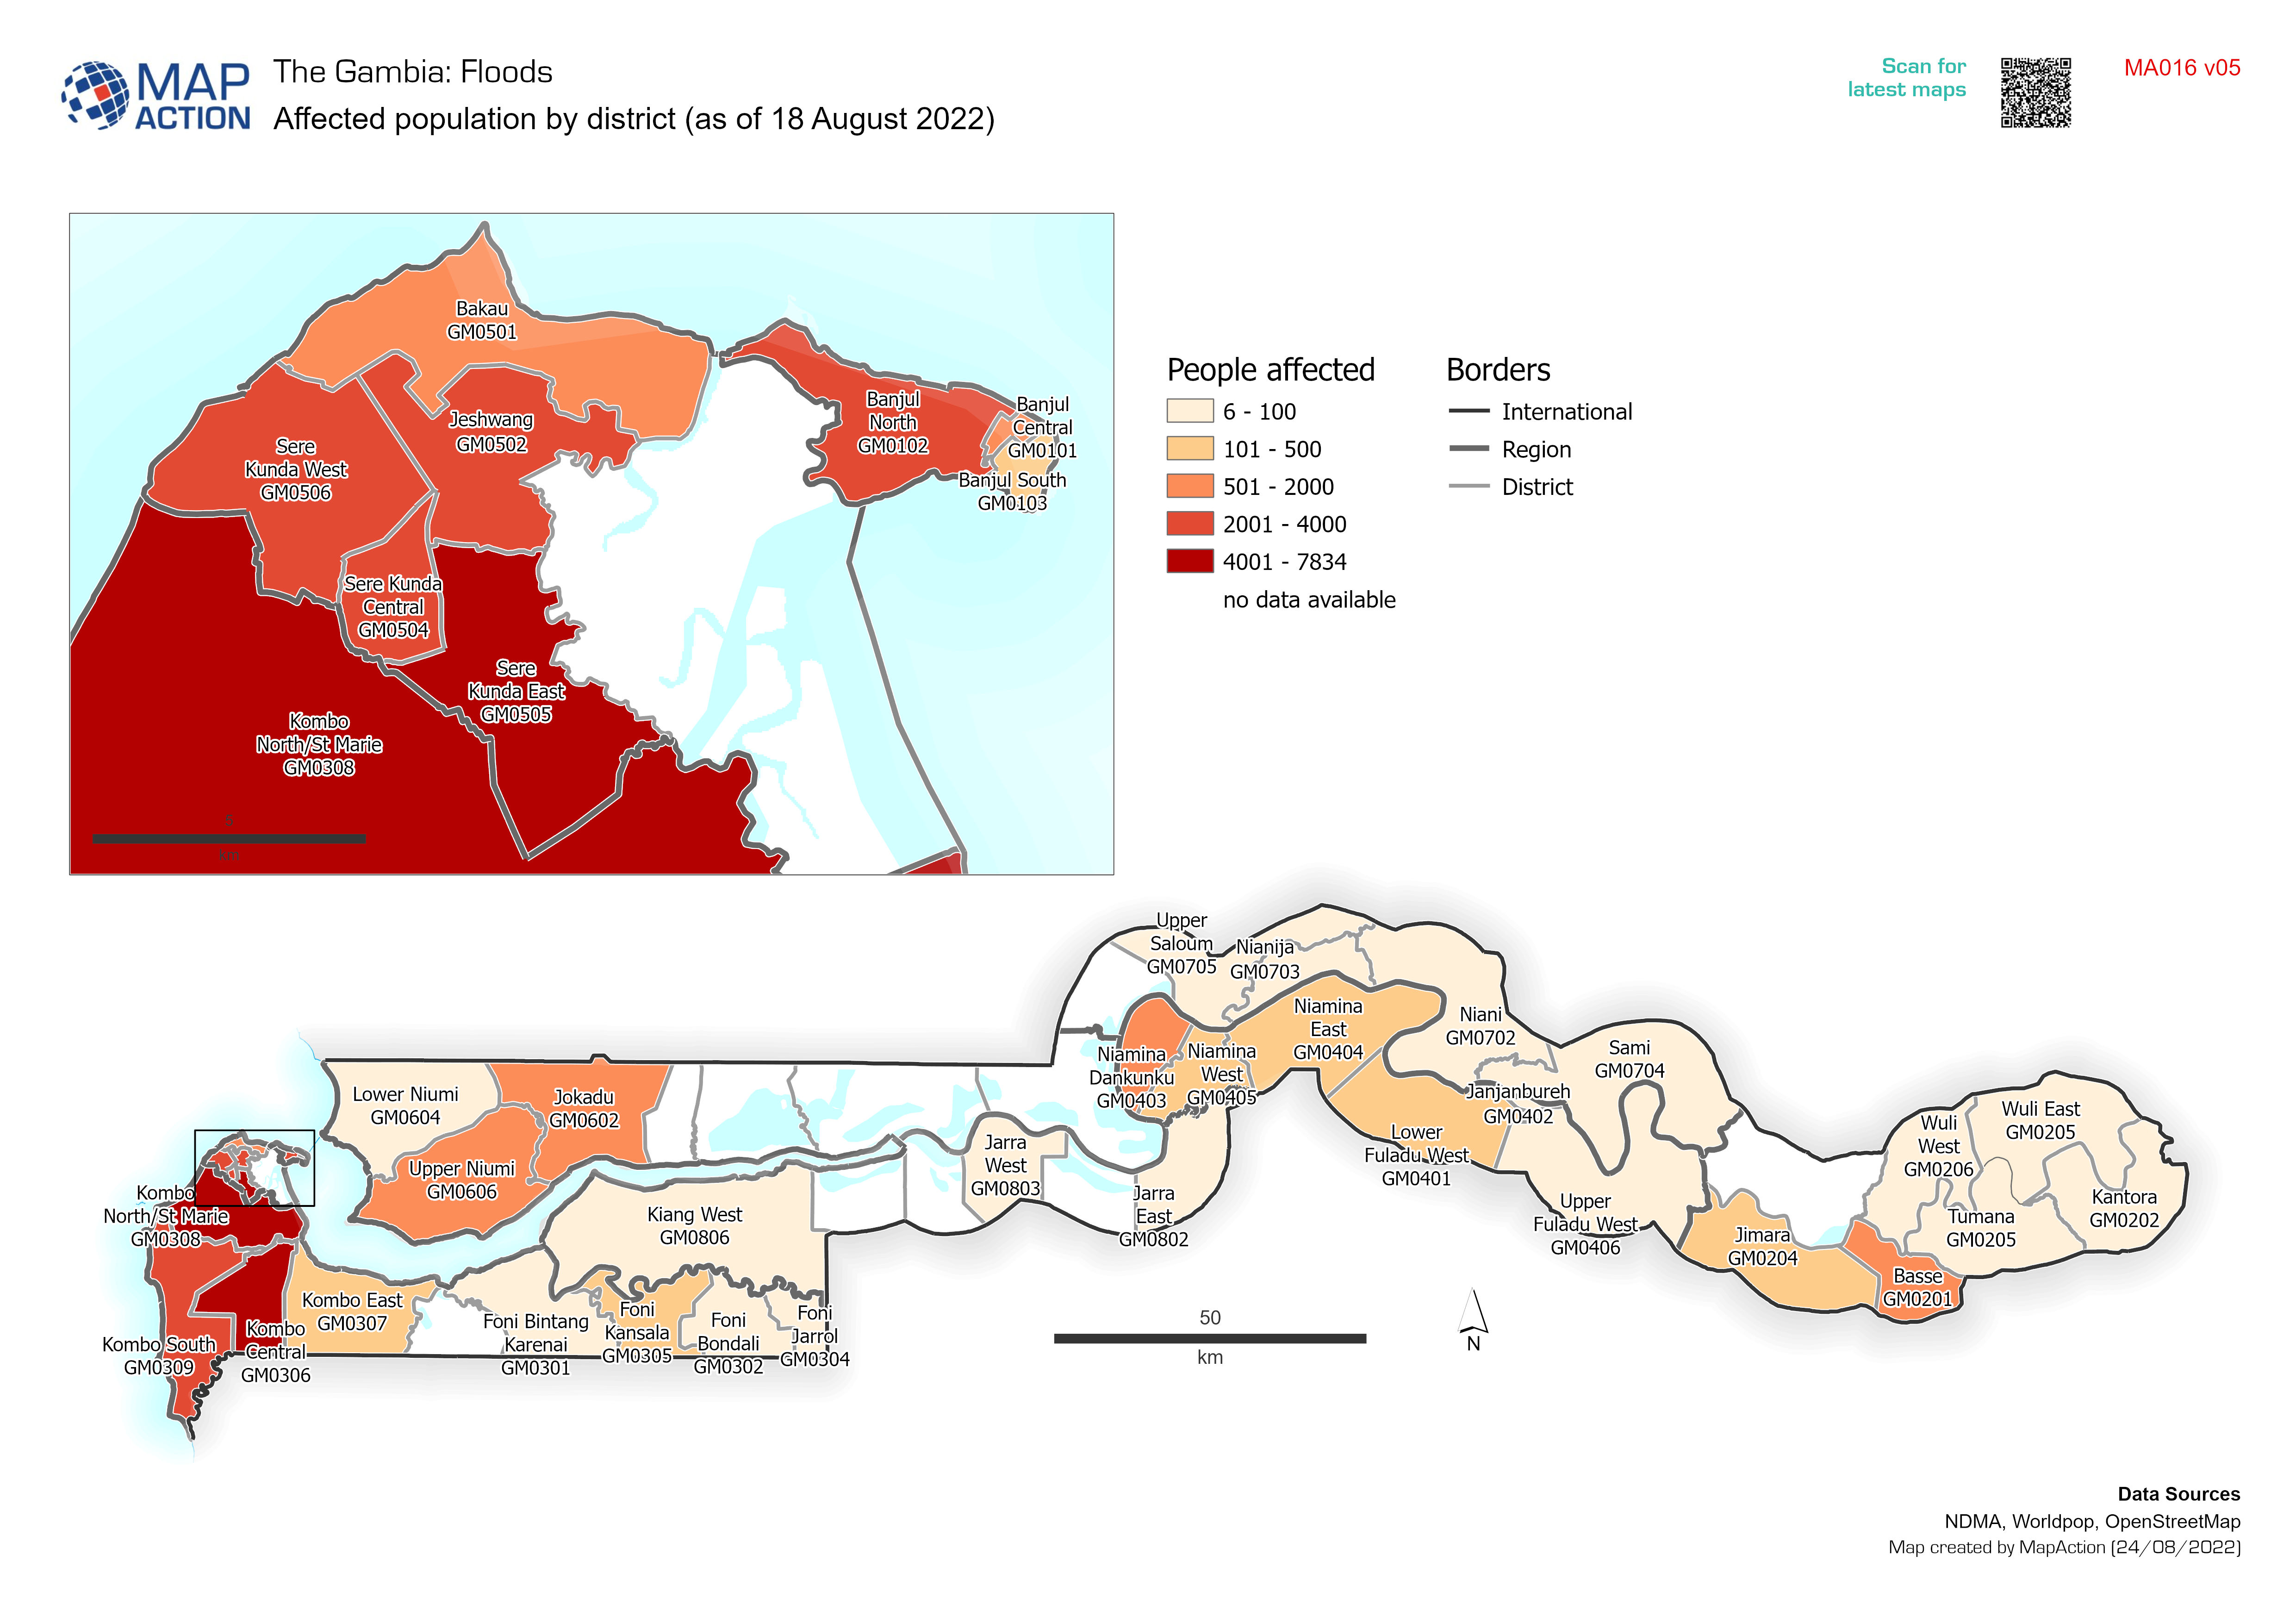
Affected population by district (as of 18 August 2022)
Affected population per district based on data for 18 August 2022. -
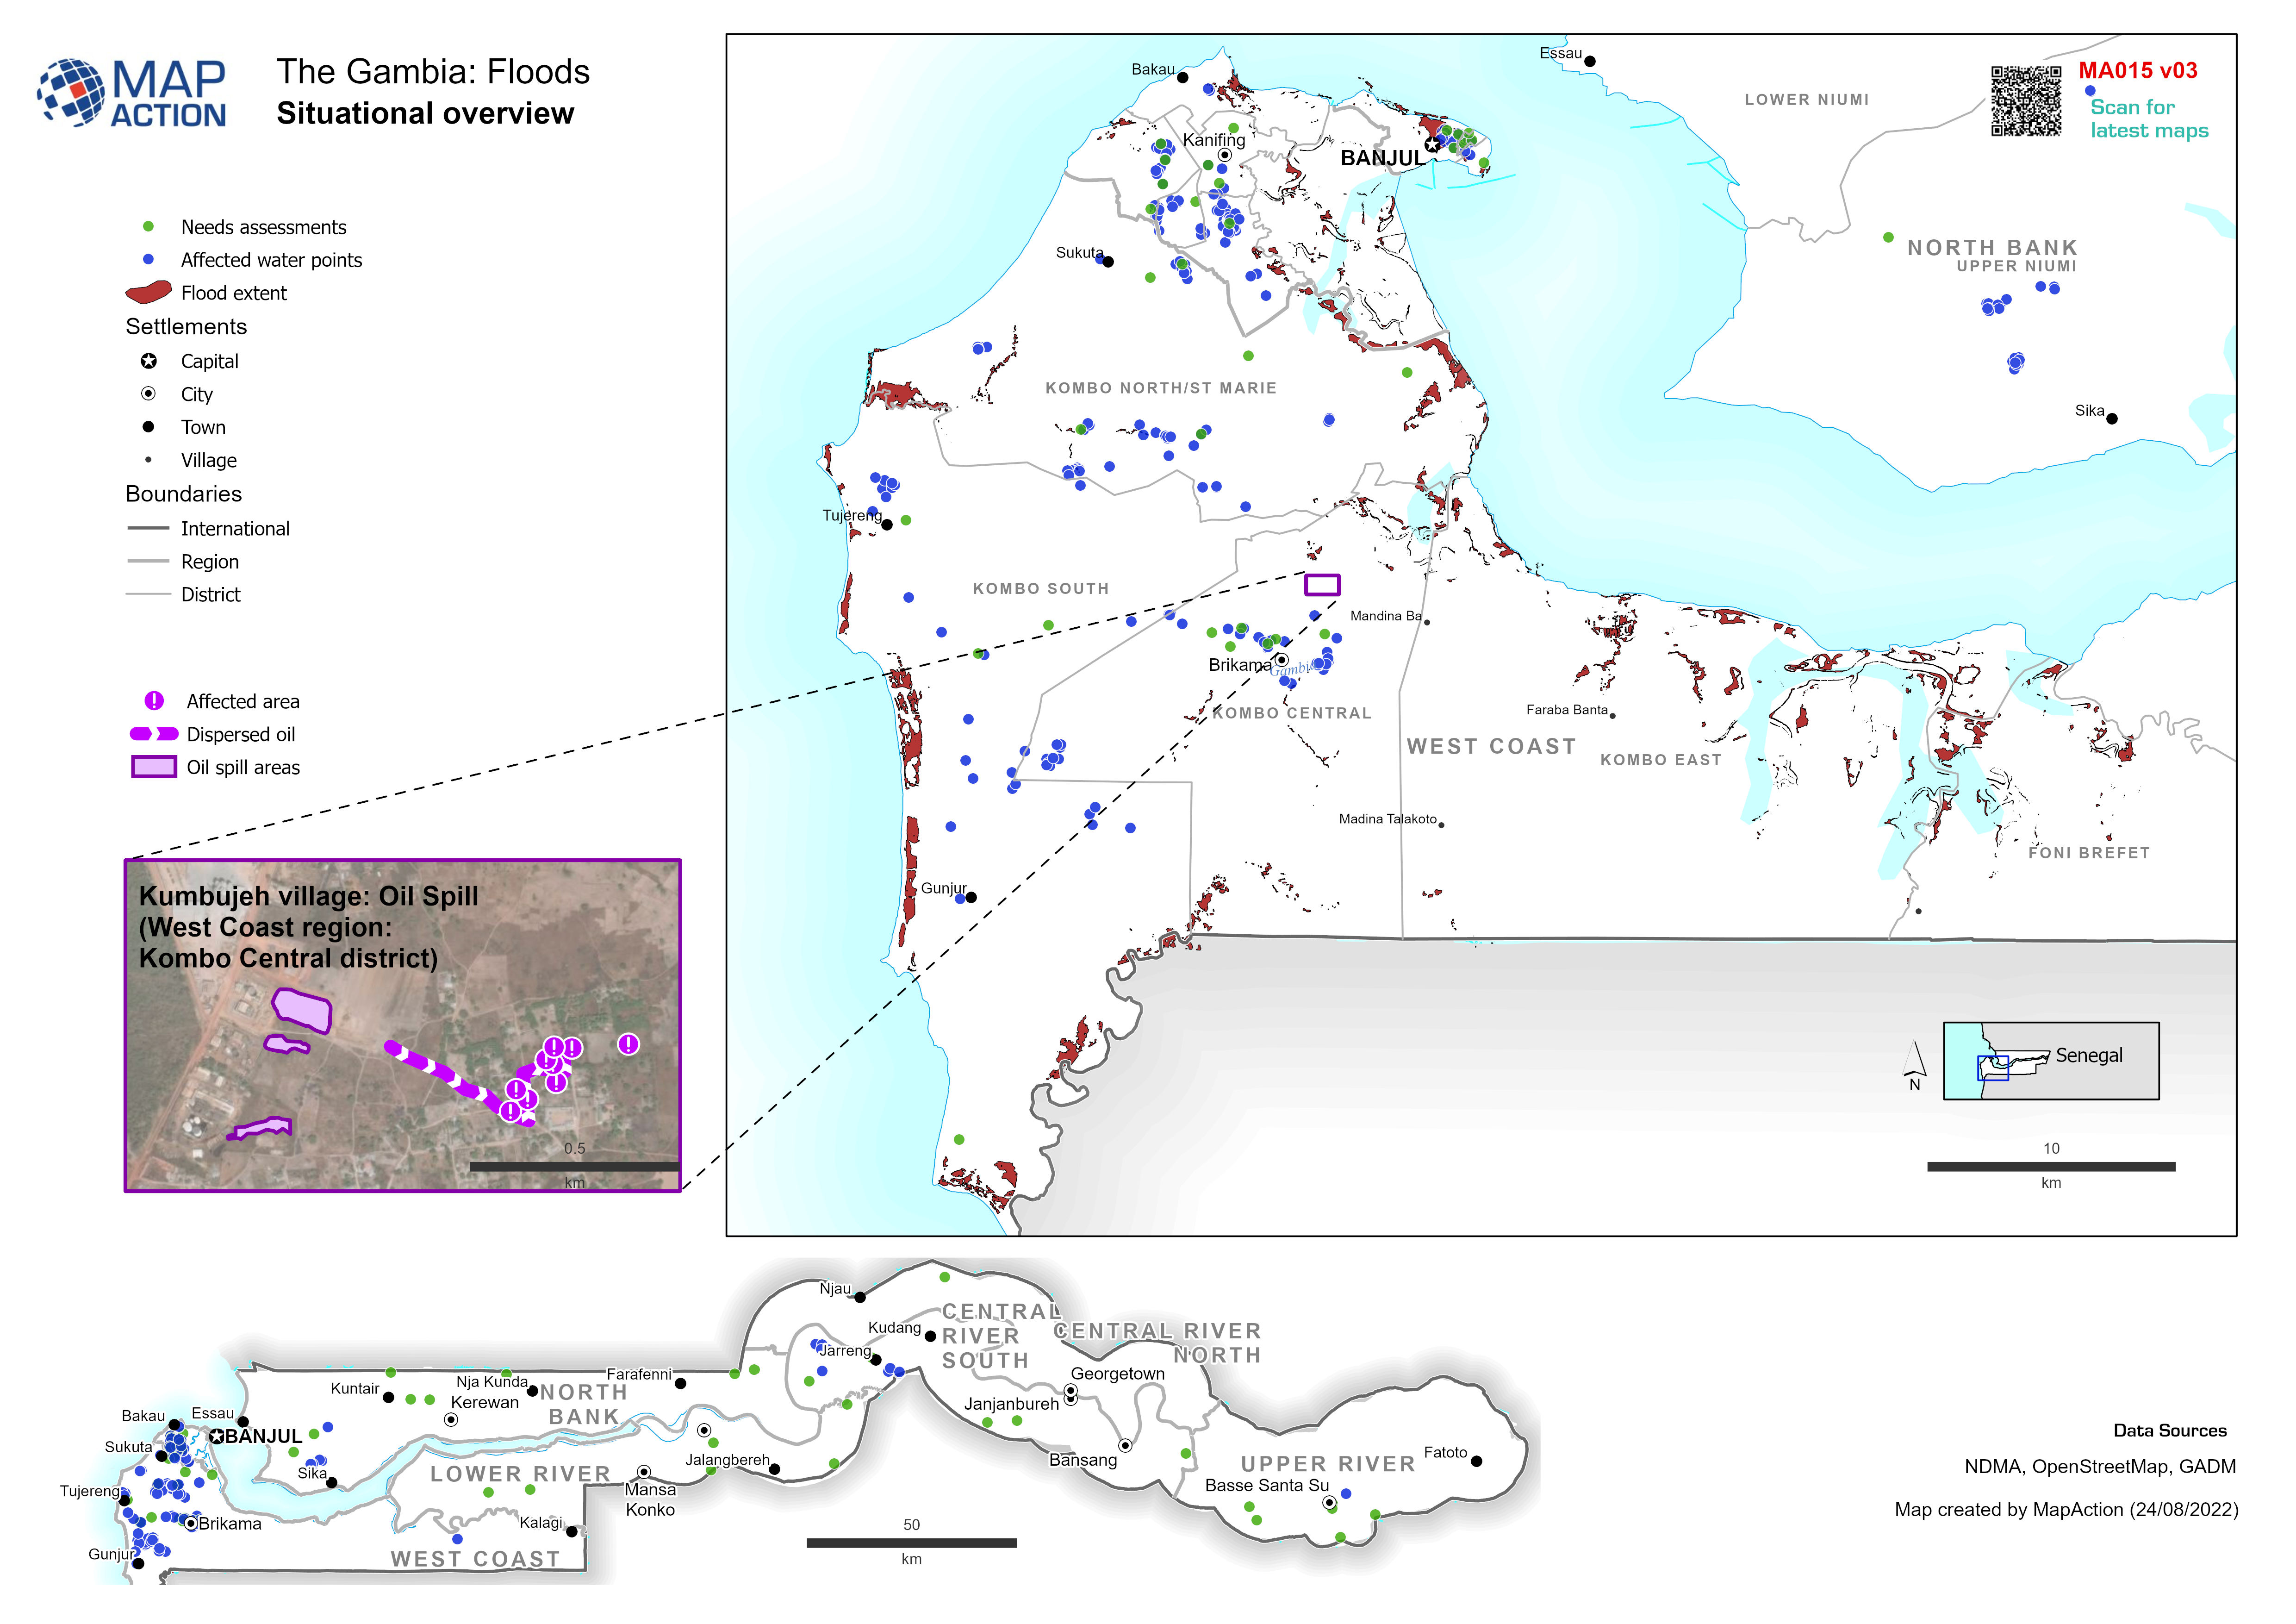
Situational overview
Example: Map shows the extent of known flooding from satellite images on 1 Jan 2012. -

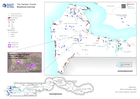
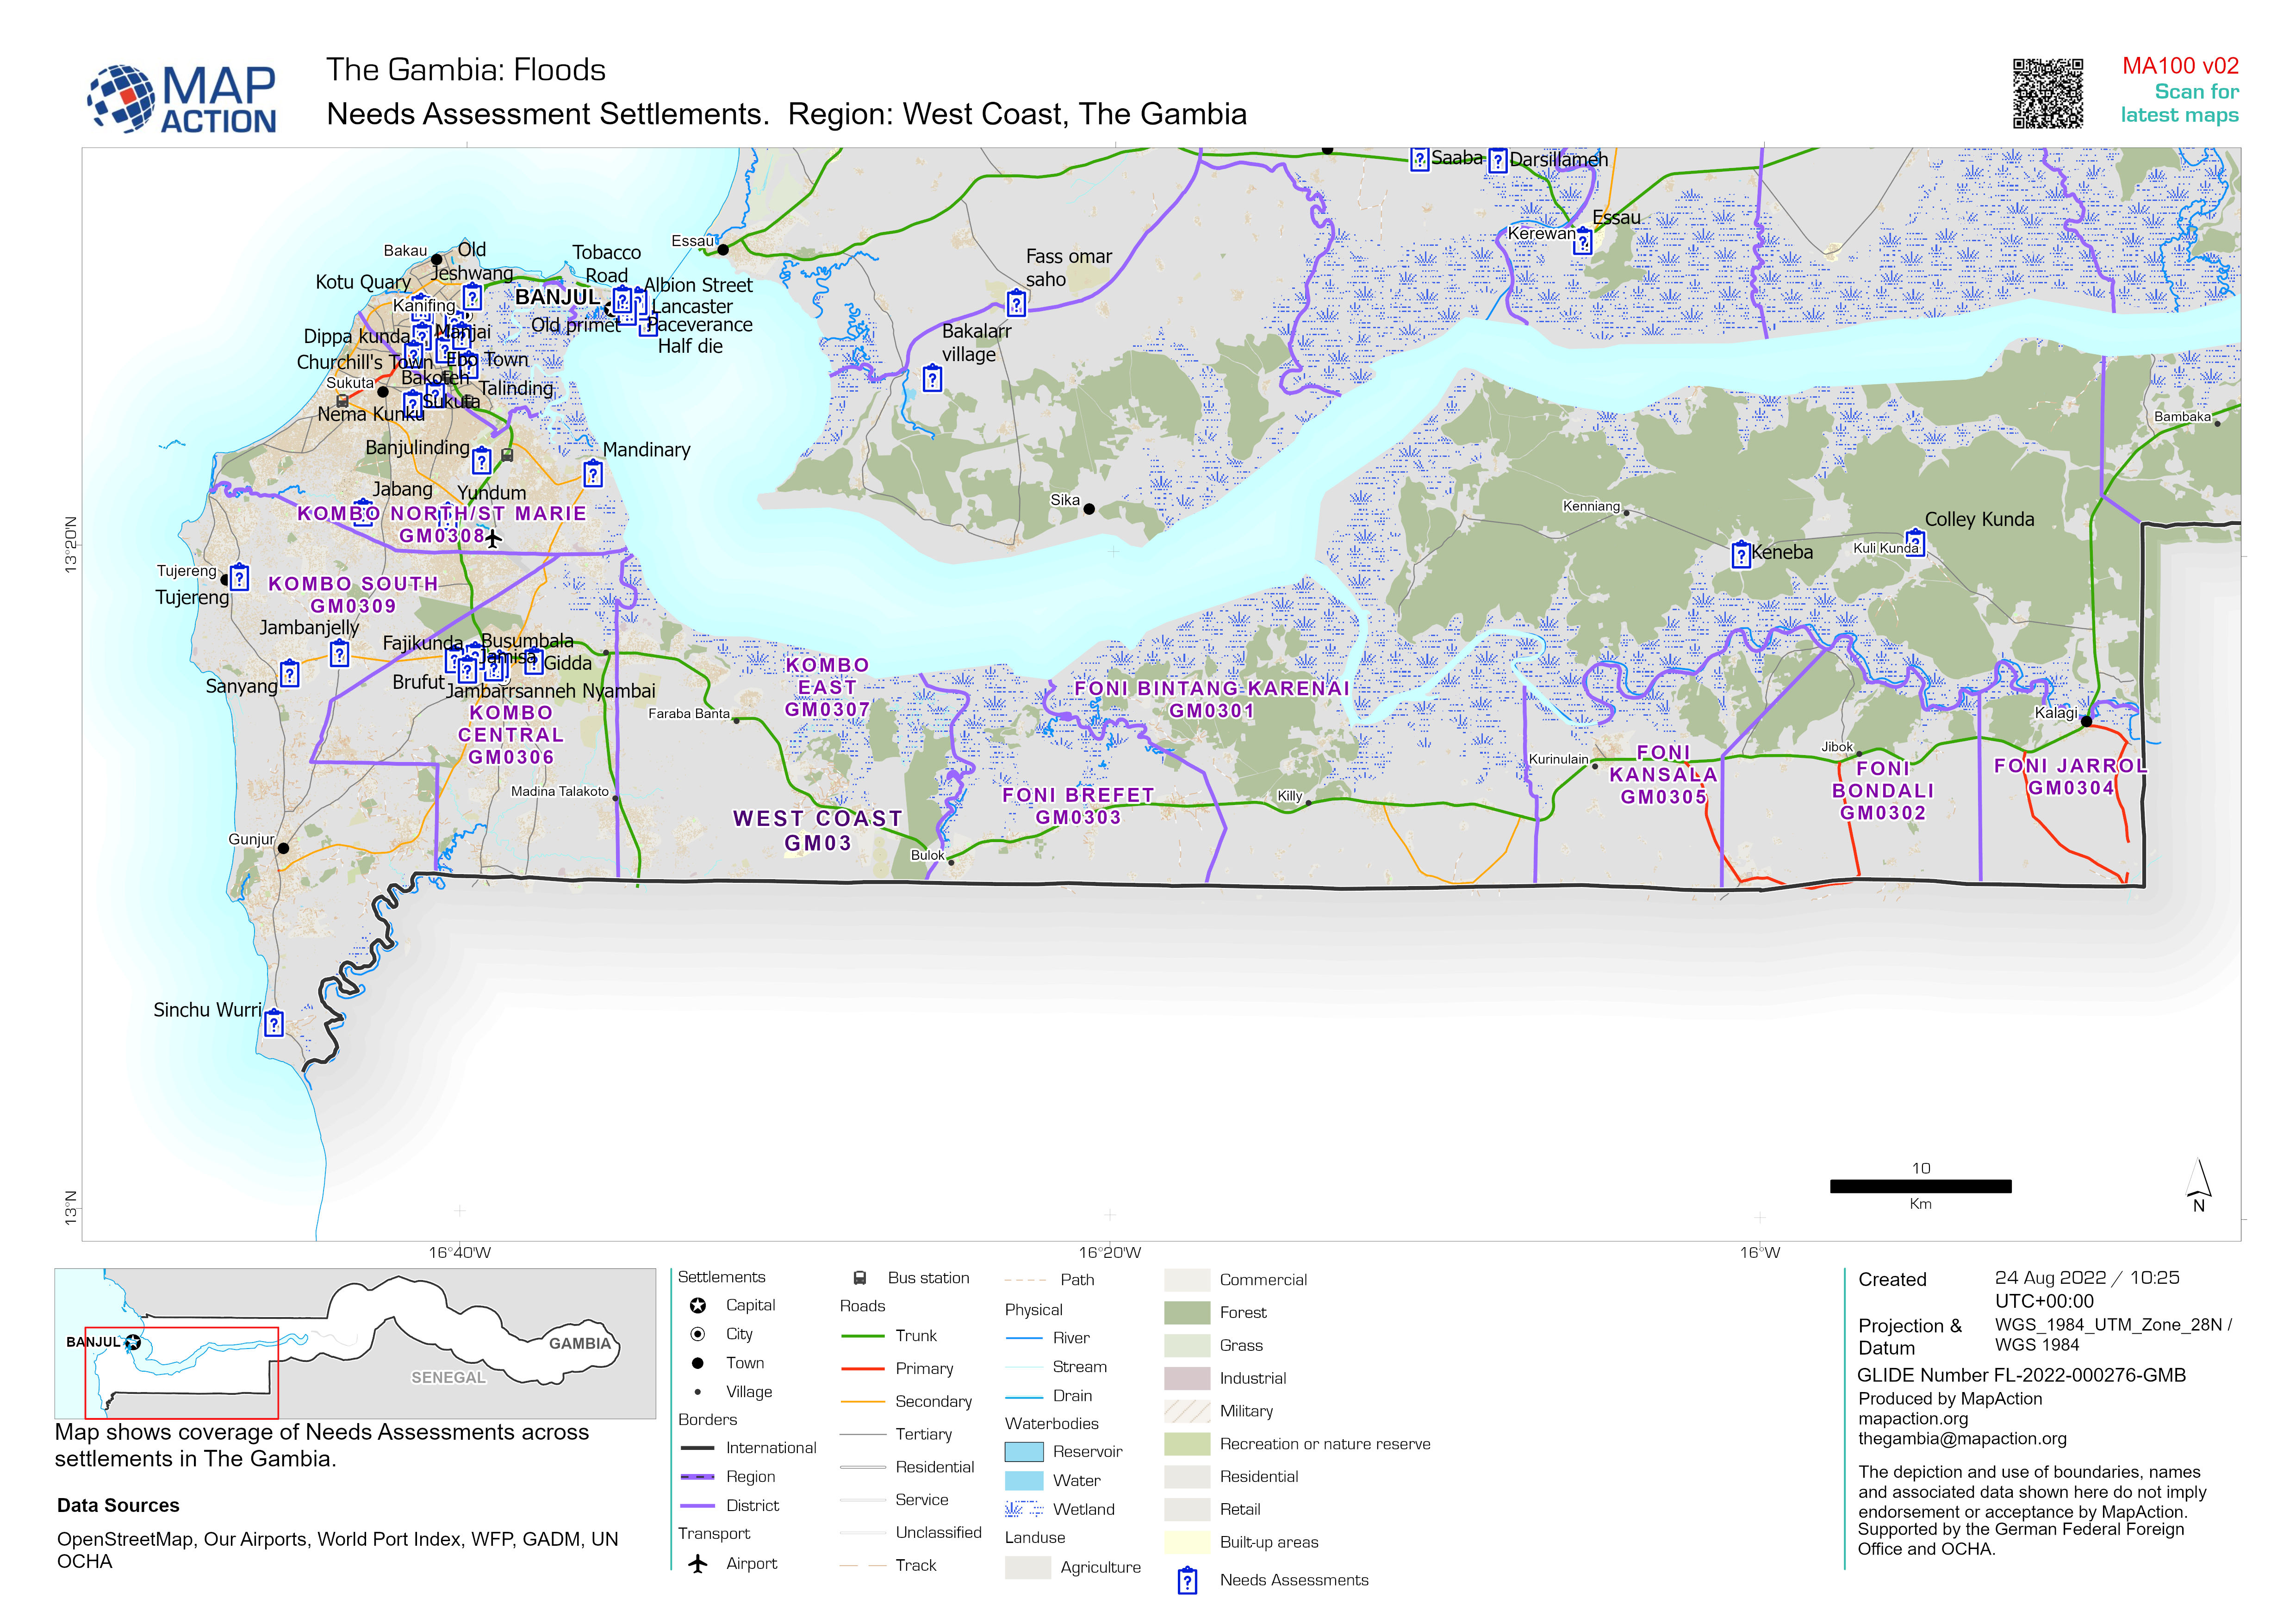
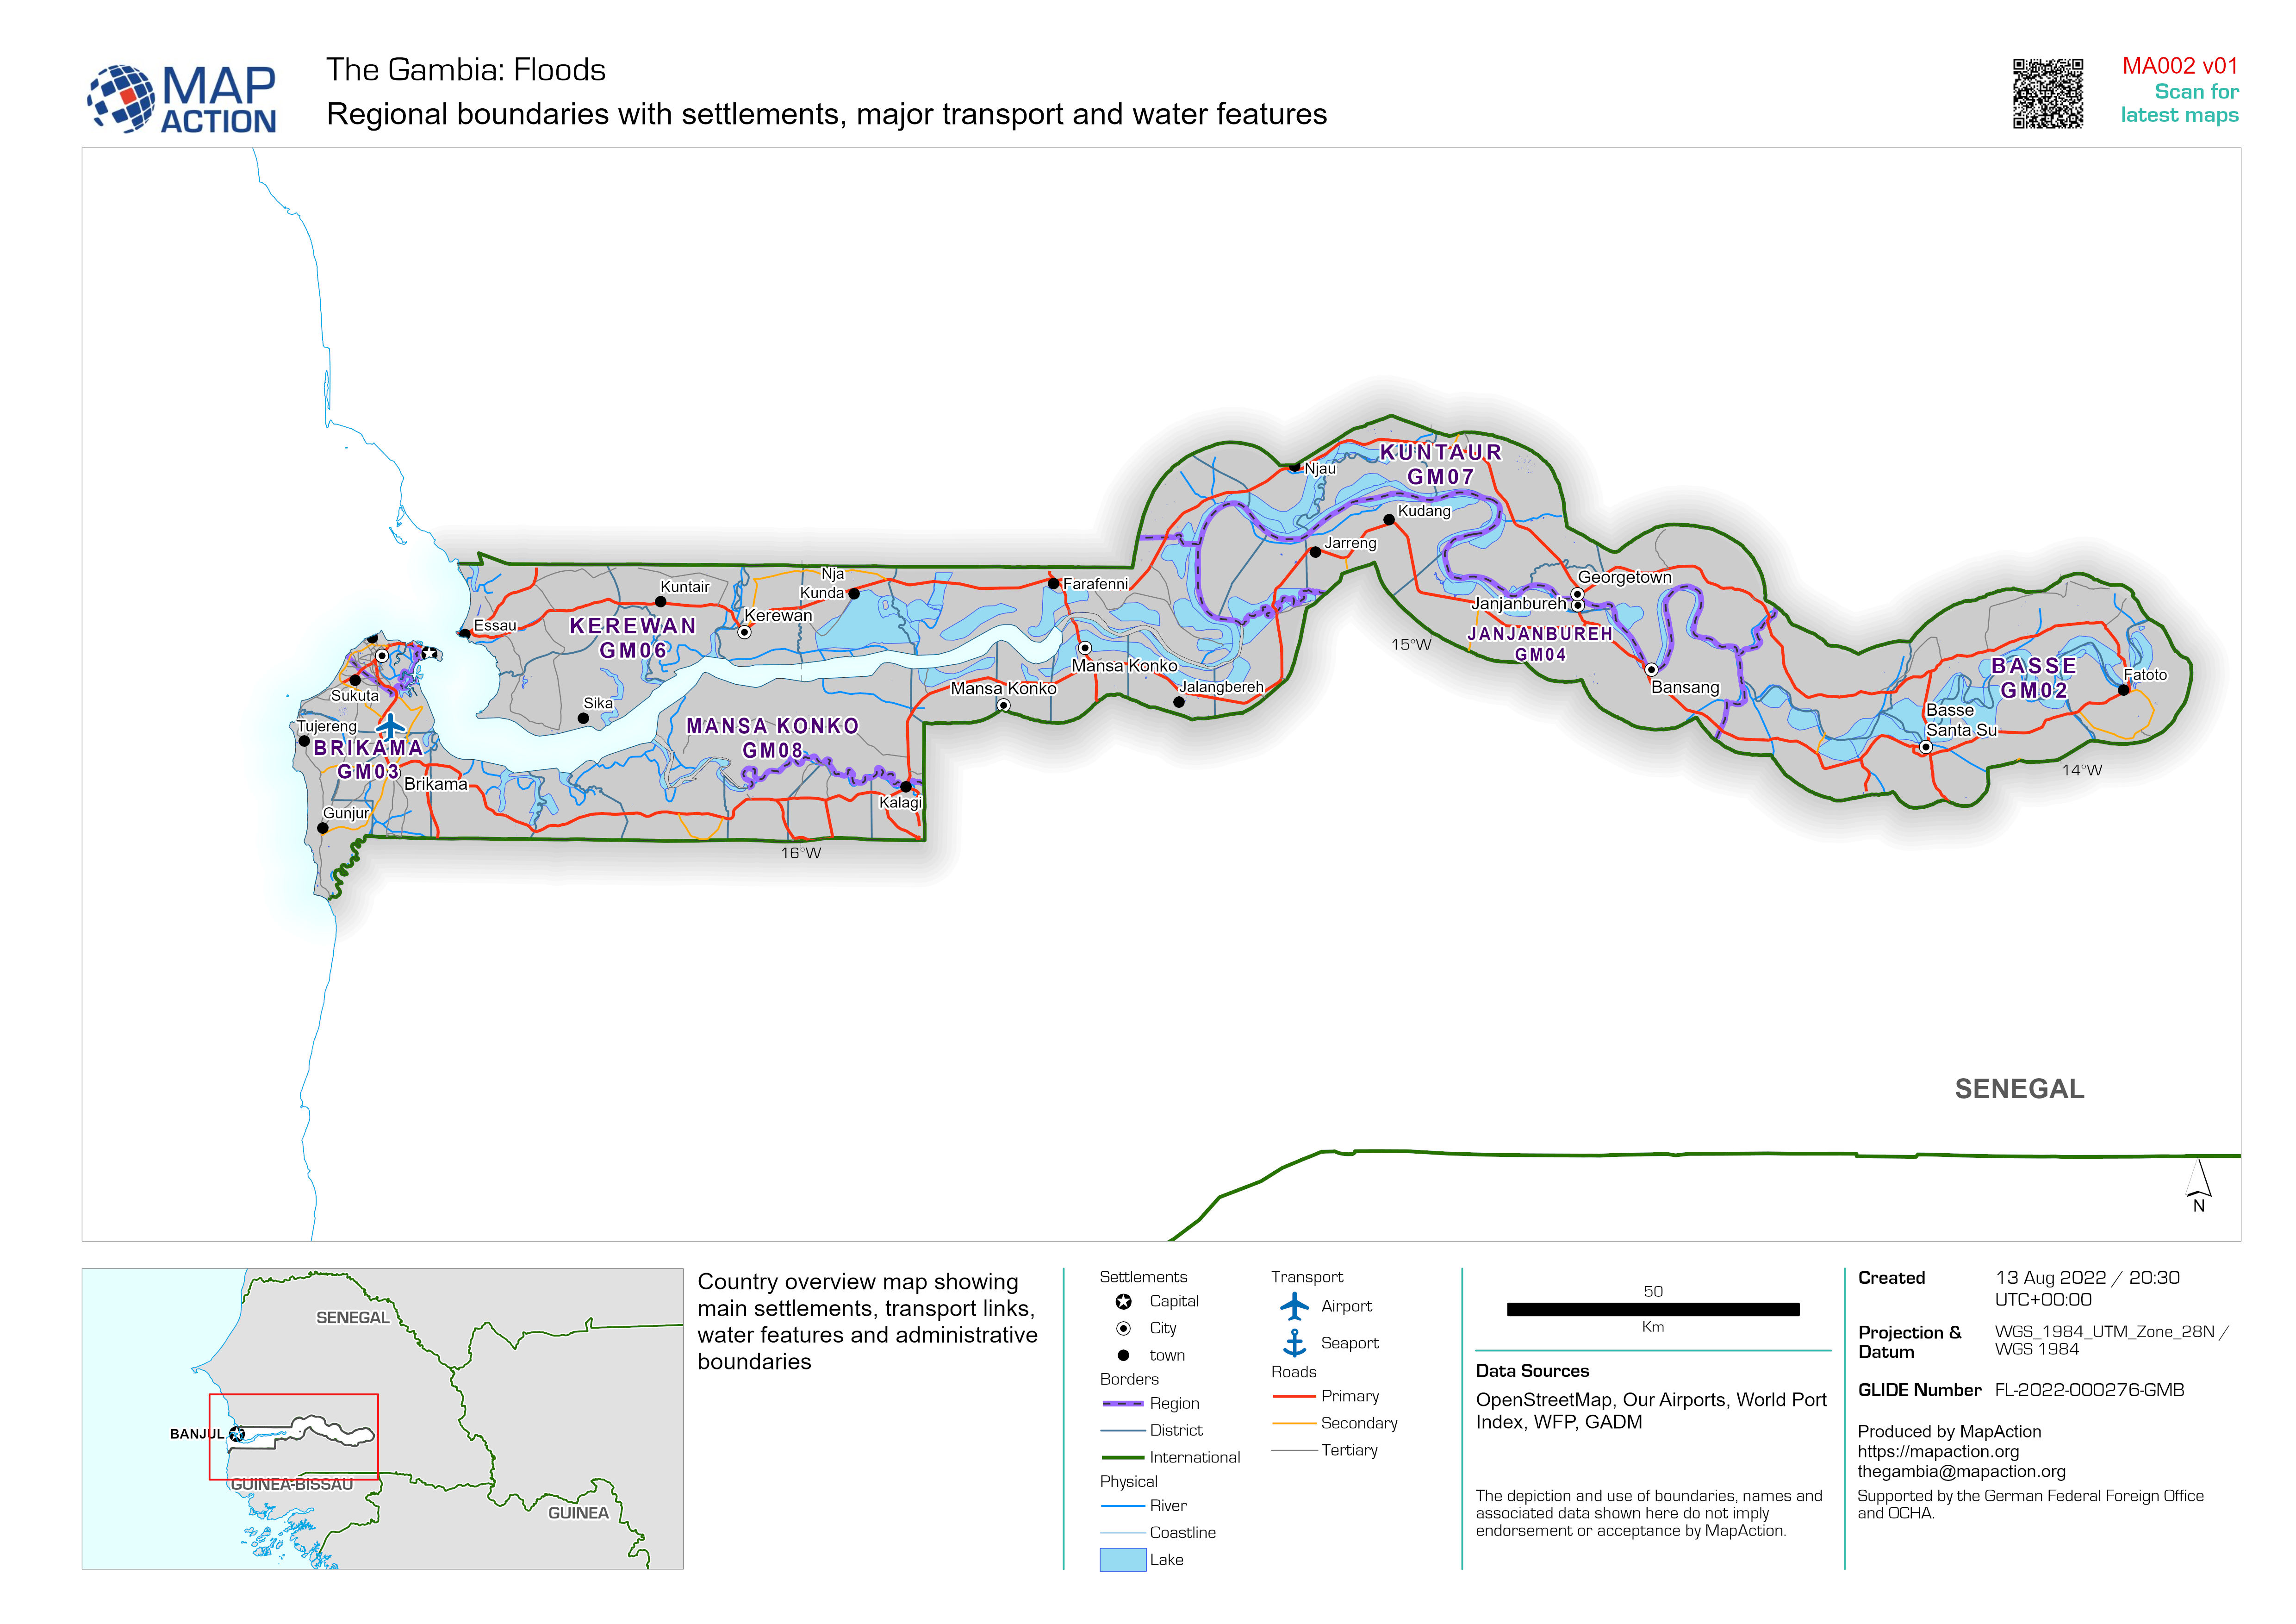
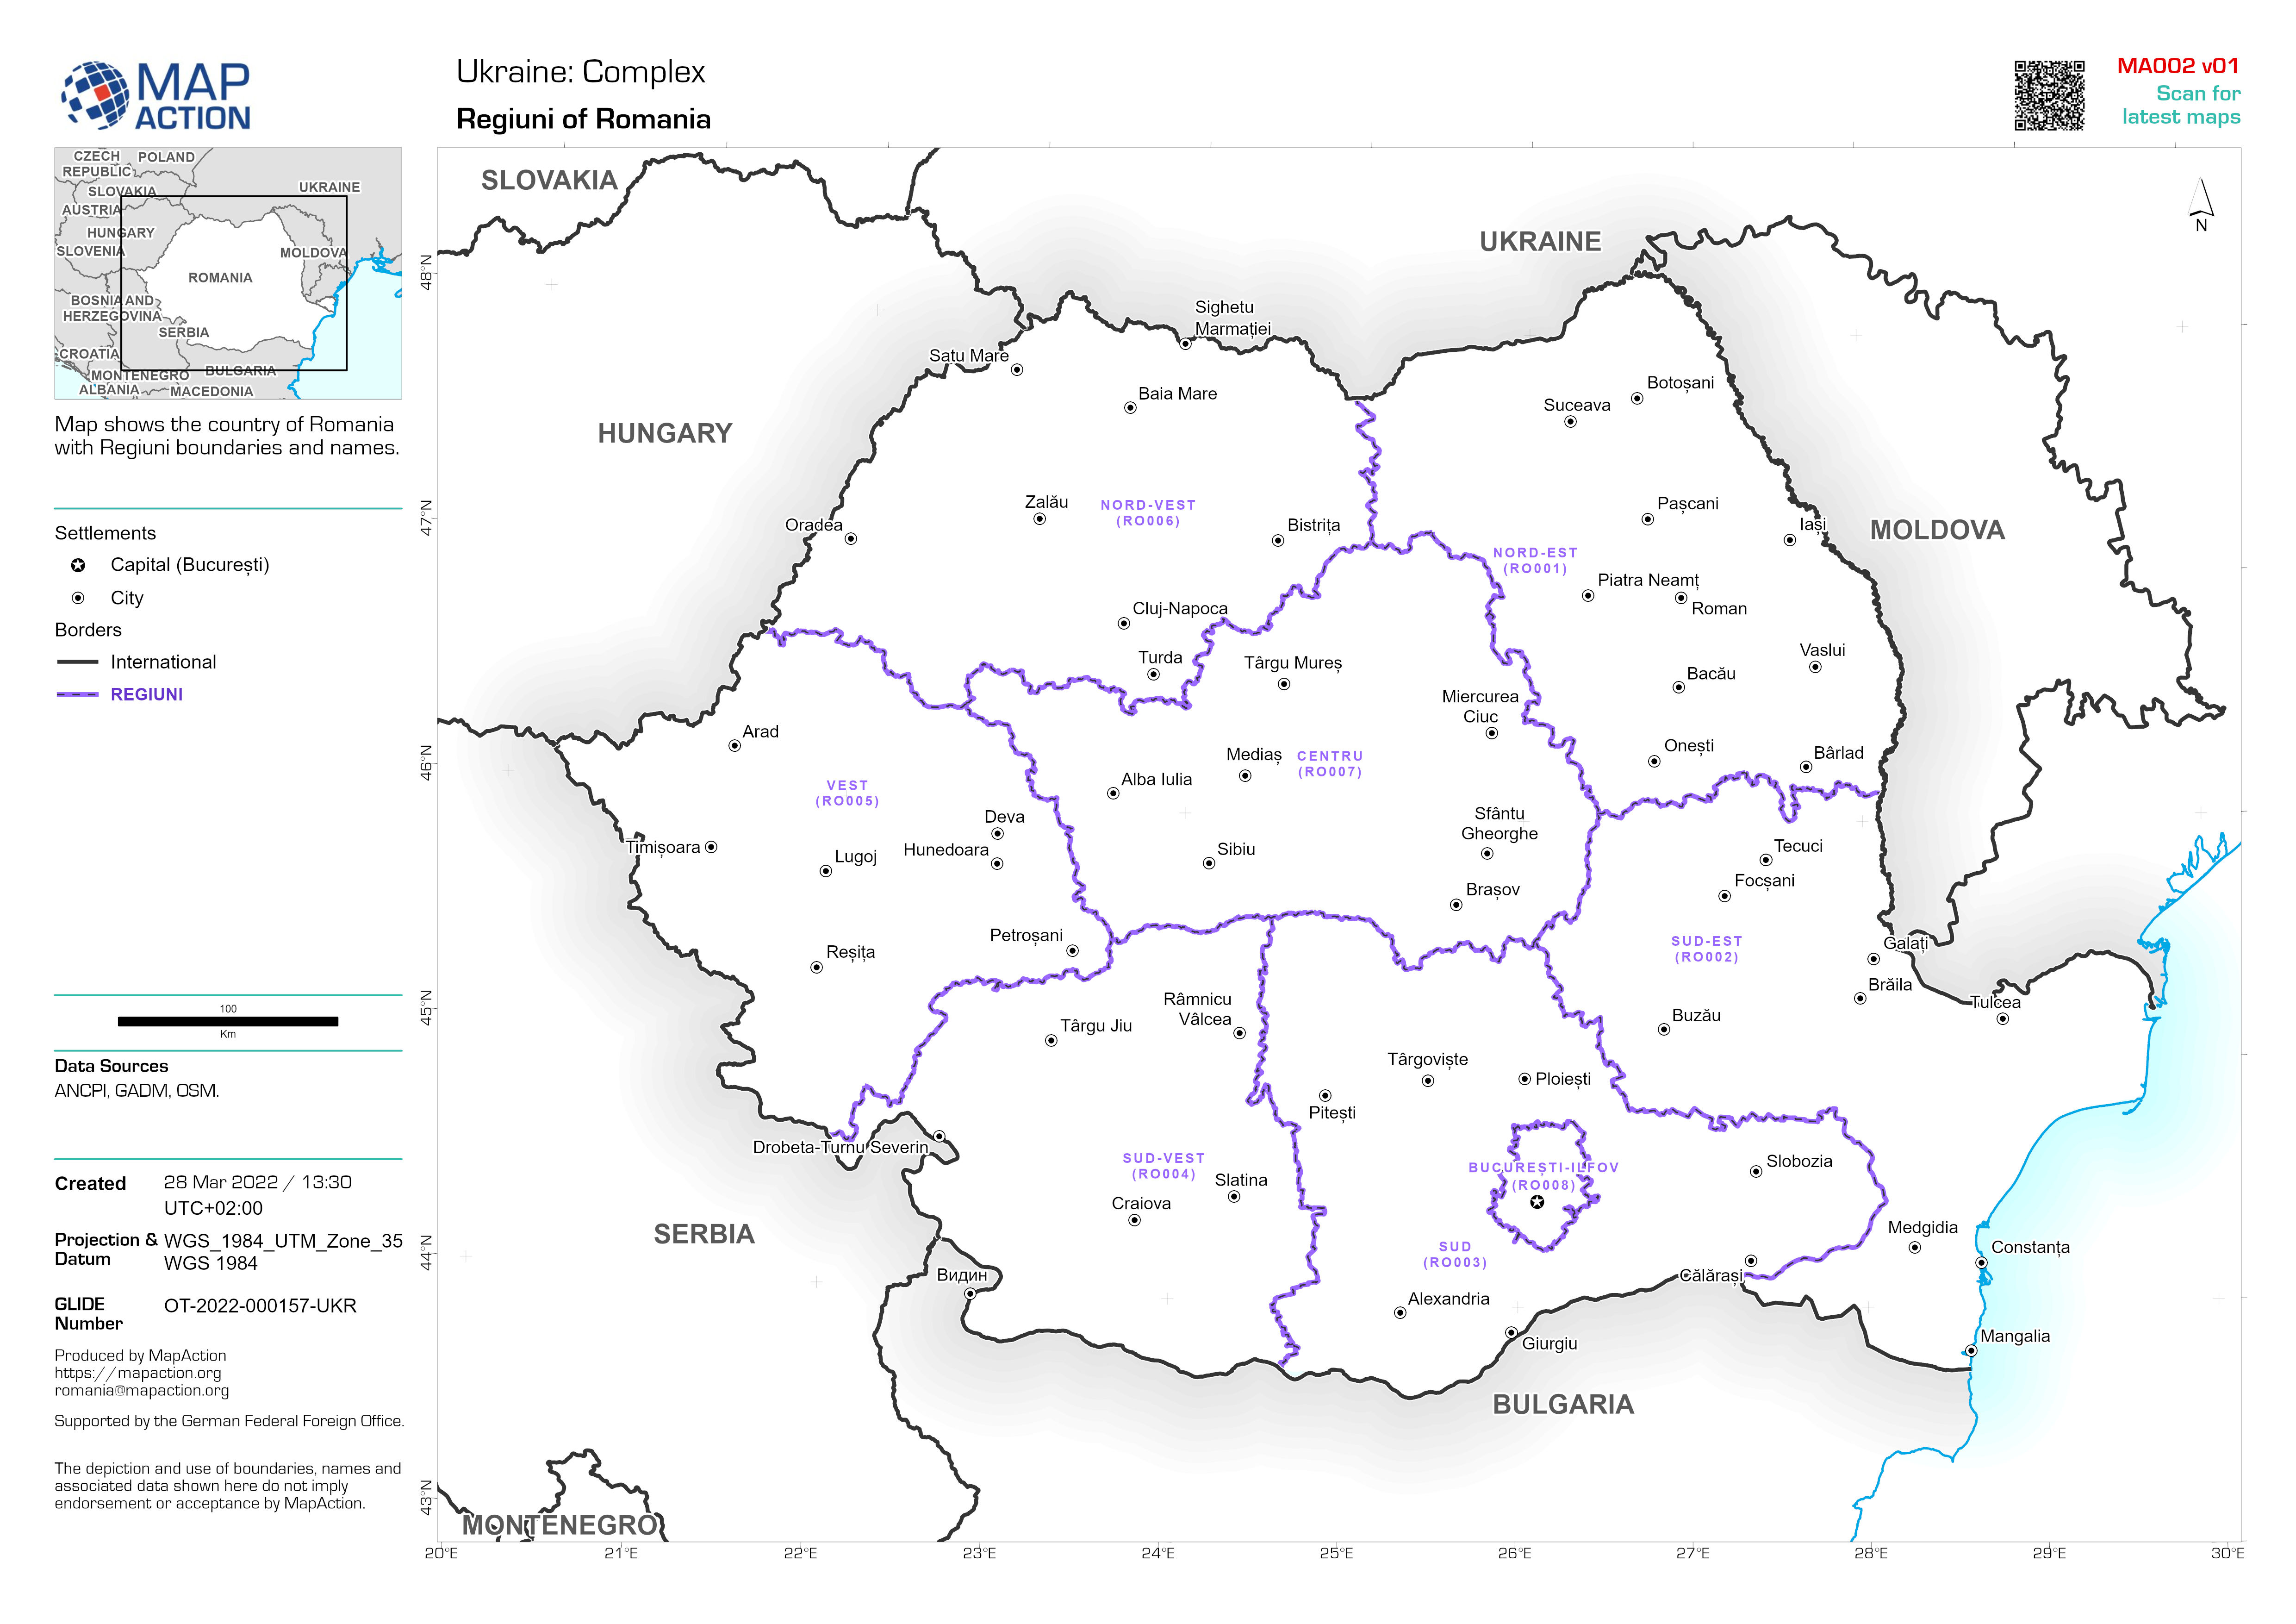
Regional boundaries with settlements, major transport and water features
Country overview map showing main settlements, transport links, water features and administrative boundaries -
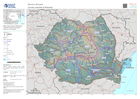
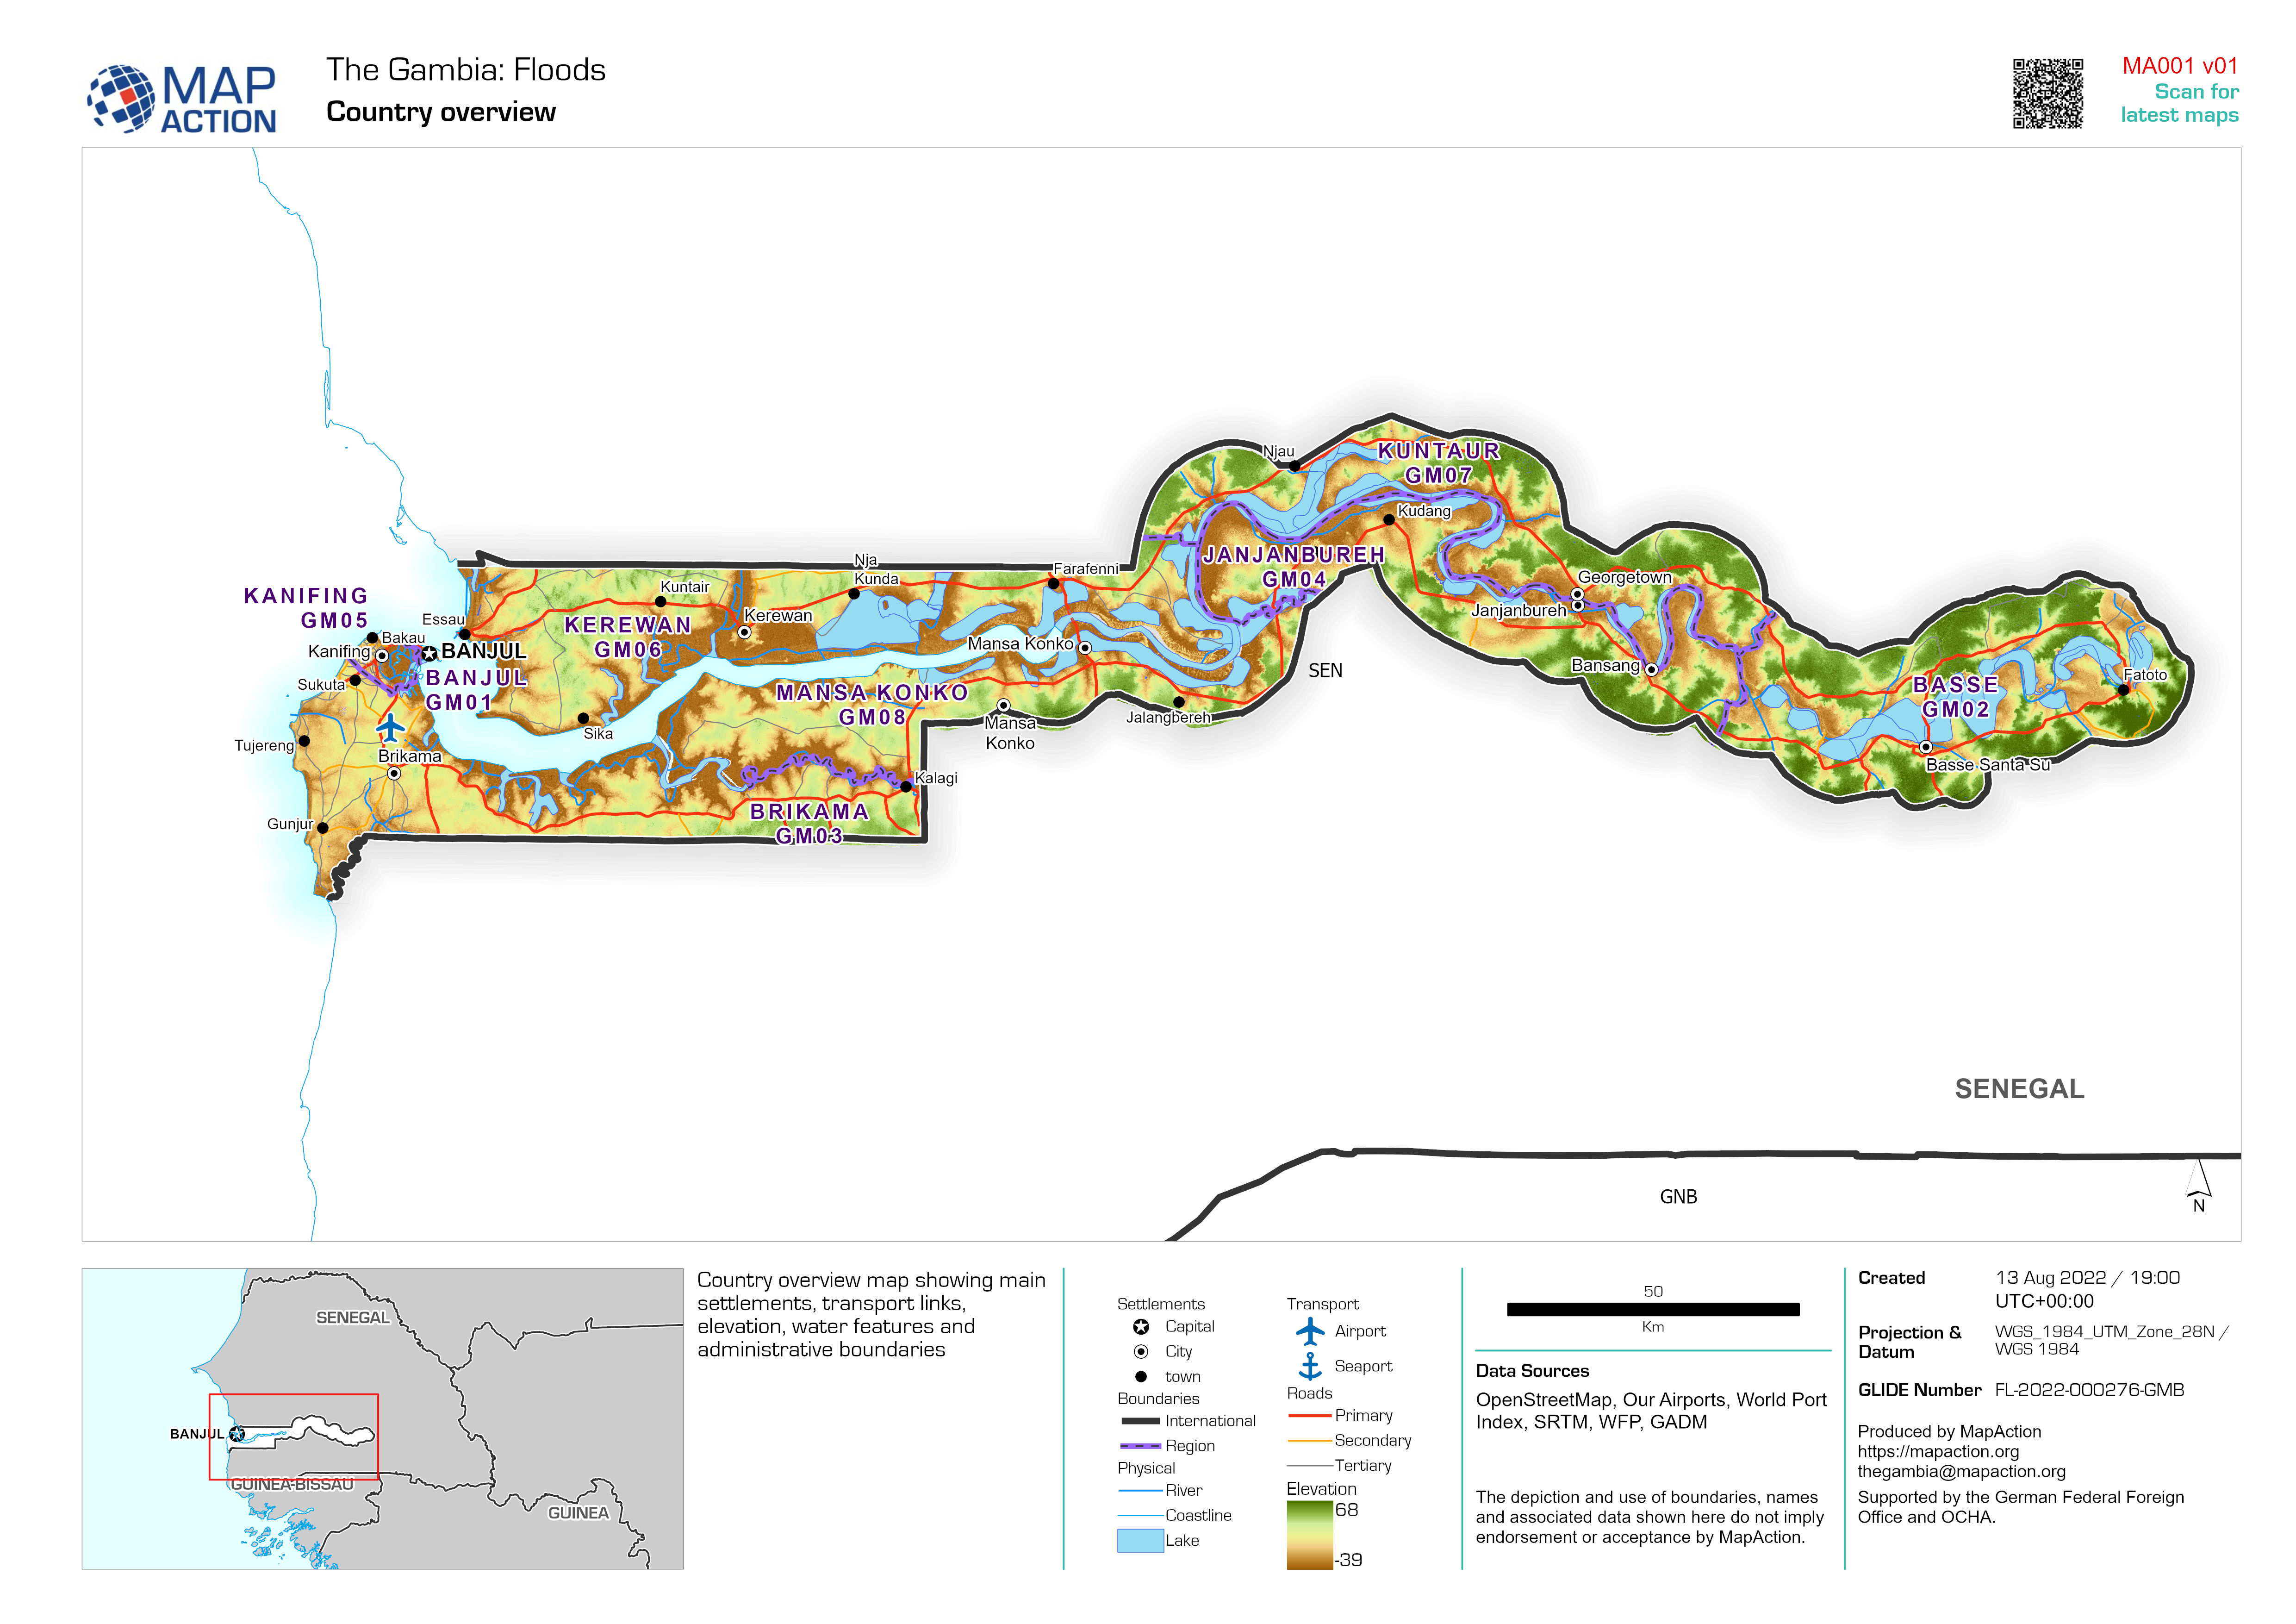
Country overview
Country overview map showing main settlements, transport links, elevation, water features and administrative boundaries -

Affected Population by District (as of 18 August 2022)
District population baseline and graph shows the split between females and males -
District population baseline
District population baseline and graph shows the split between females and males -

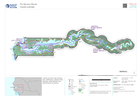
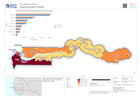
Baseline population and reported flood extent
Baseline population and reported flood extent as of 10 august 2022 -
Country overview
Country overview map showing main settlements, transport links, elevation, water features and administrative boundaries -

Regional boundaries with settlements, major transport and water features
Country overview map showing main settlements, transport links, water features and administrative boundaries -
Regional population baseline
Regional population baseline and graph shows the split between females and males -

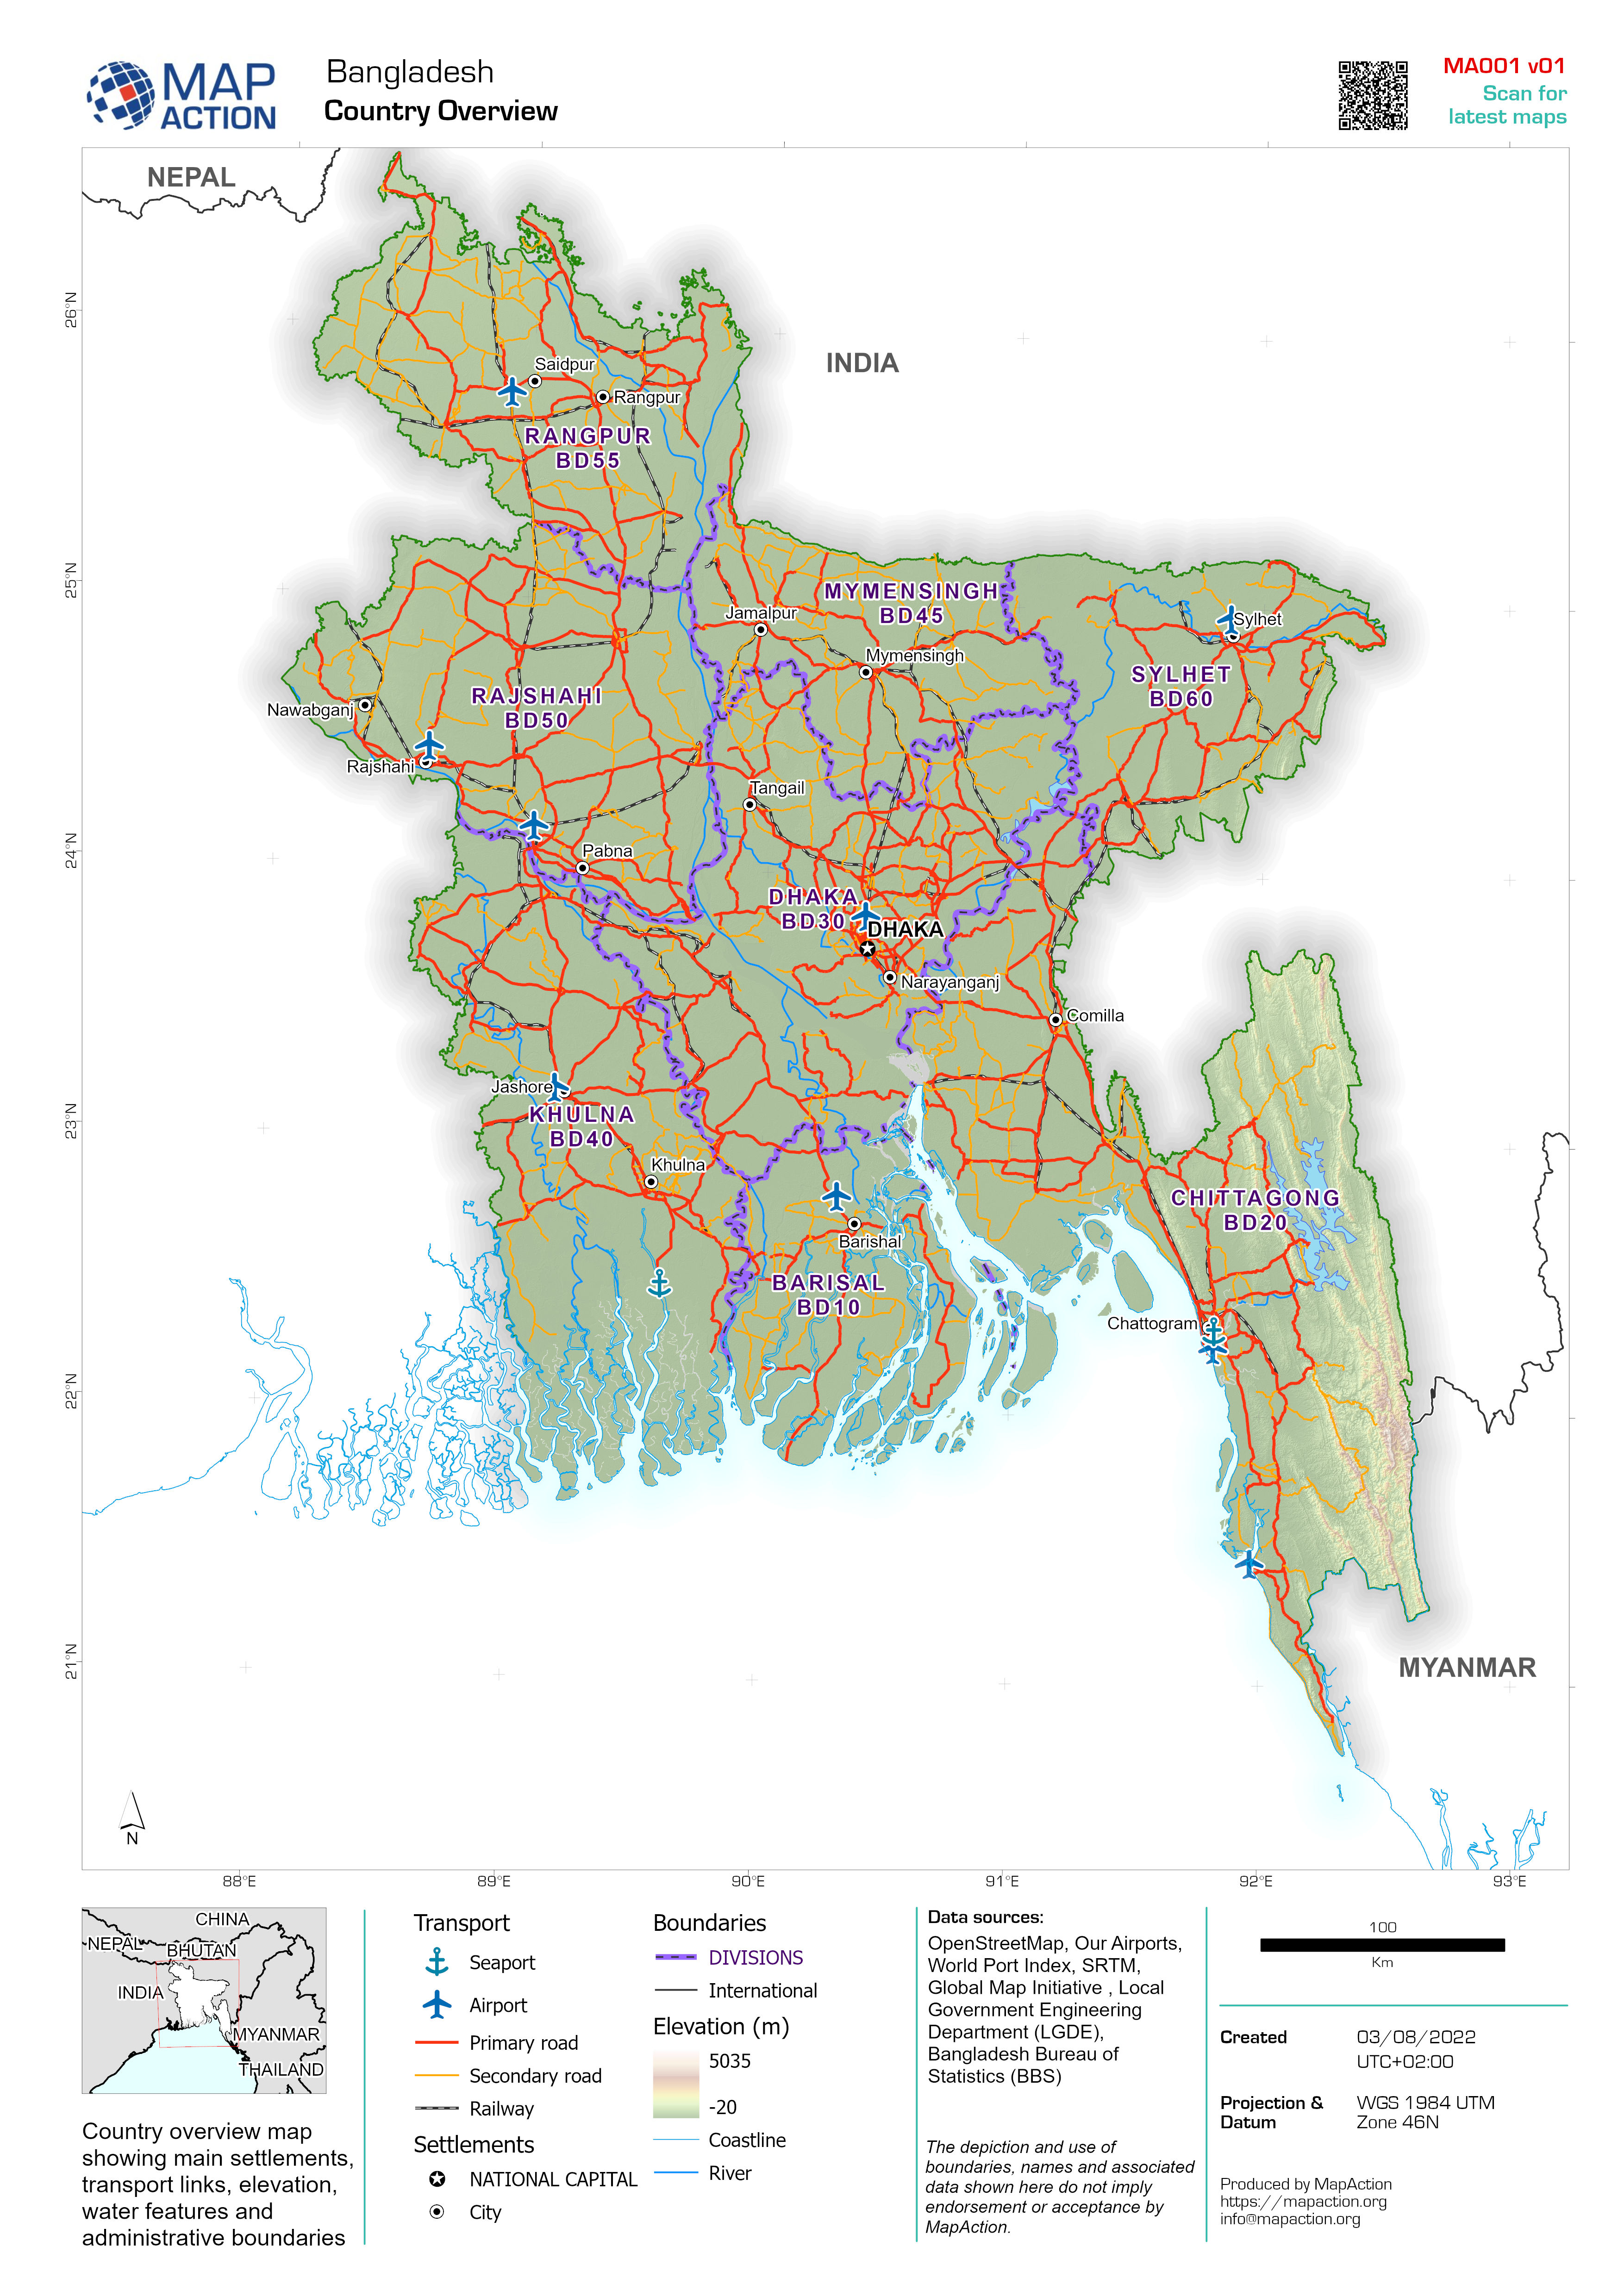
Country overview of Bangladesh
Country overview showing main settlements, transport links and natural features -
-
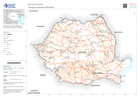
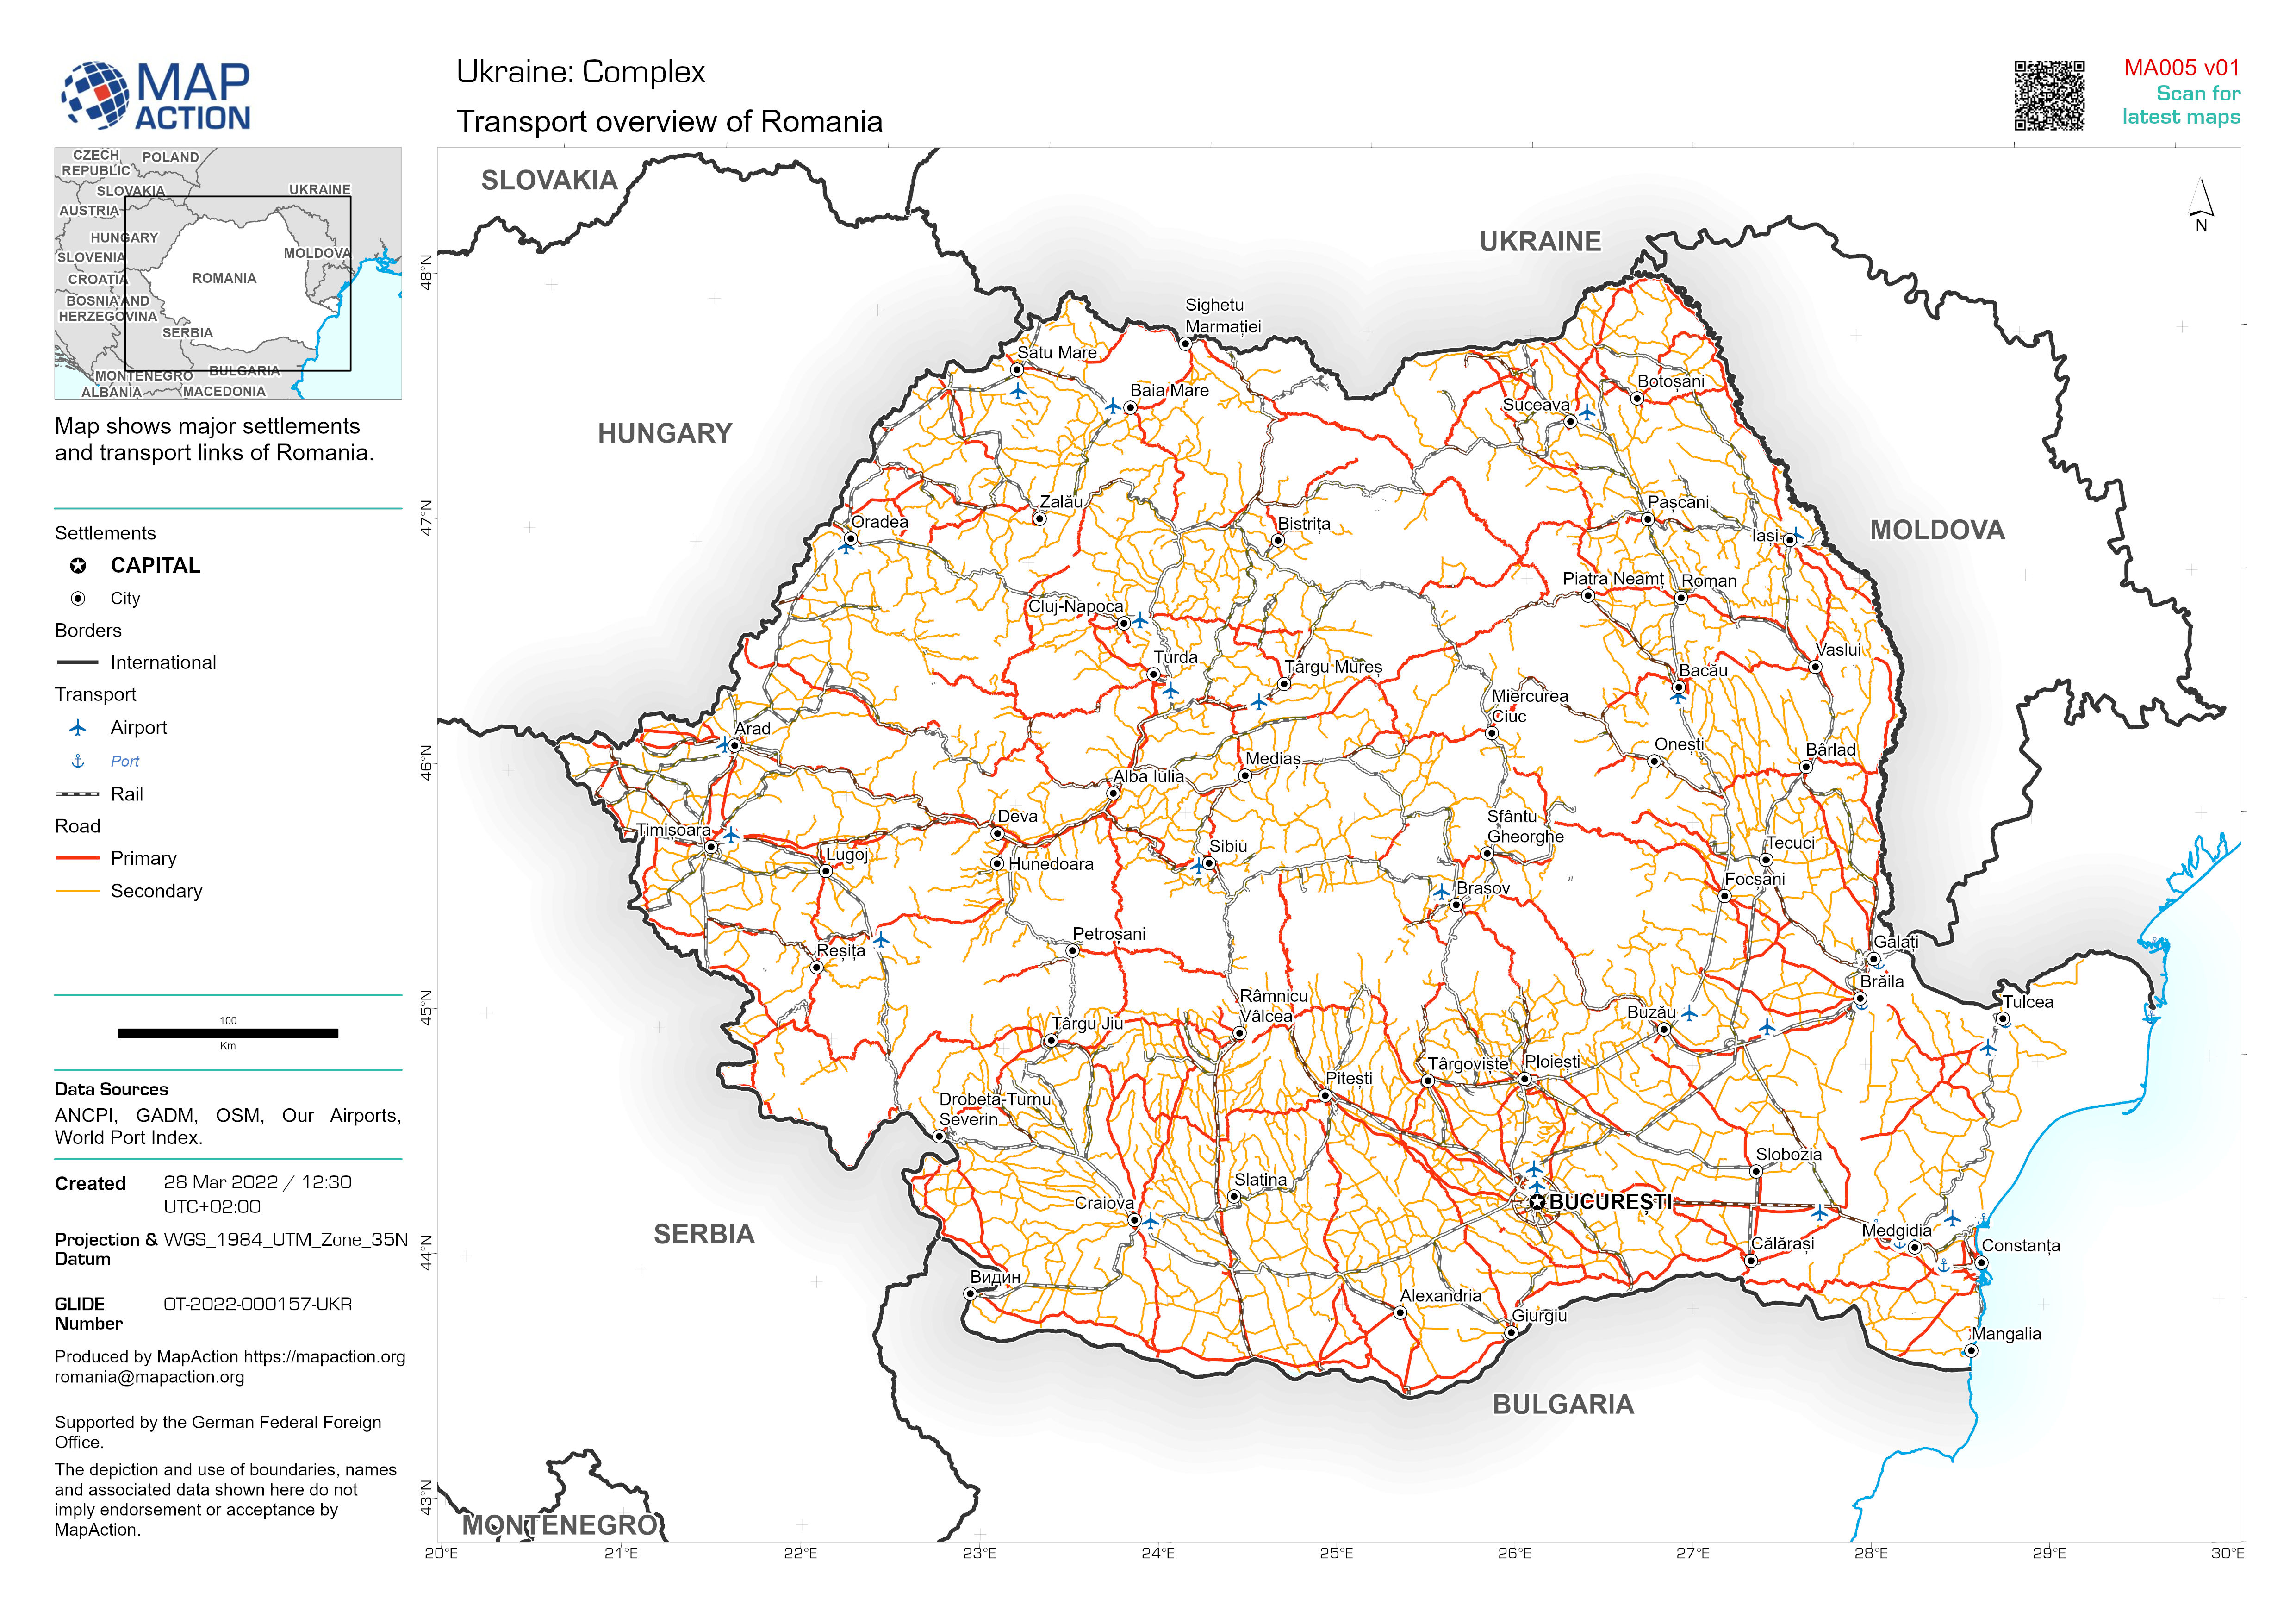
Country overview of Romania
Map shows major settlements, transport links and physical features of Romania. -


