-
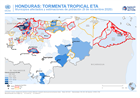
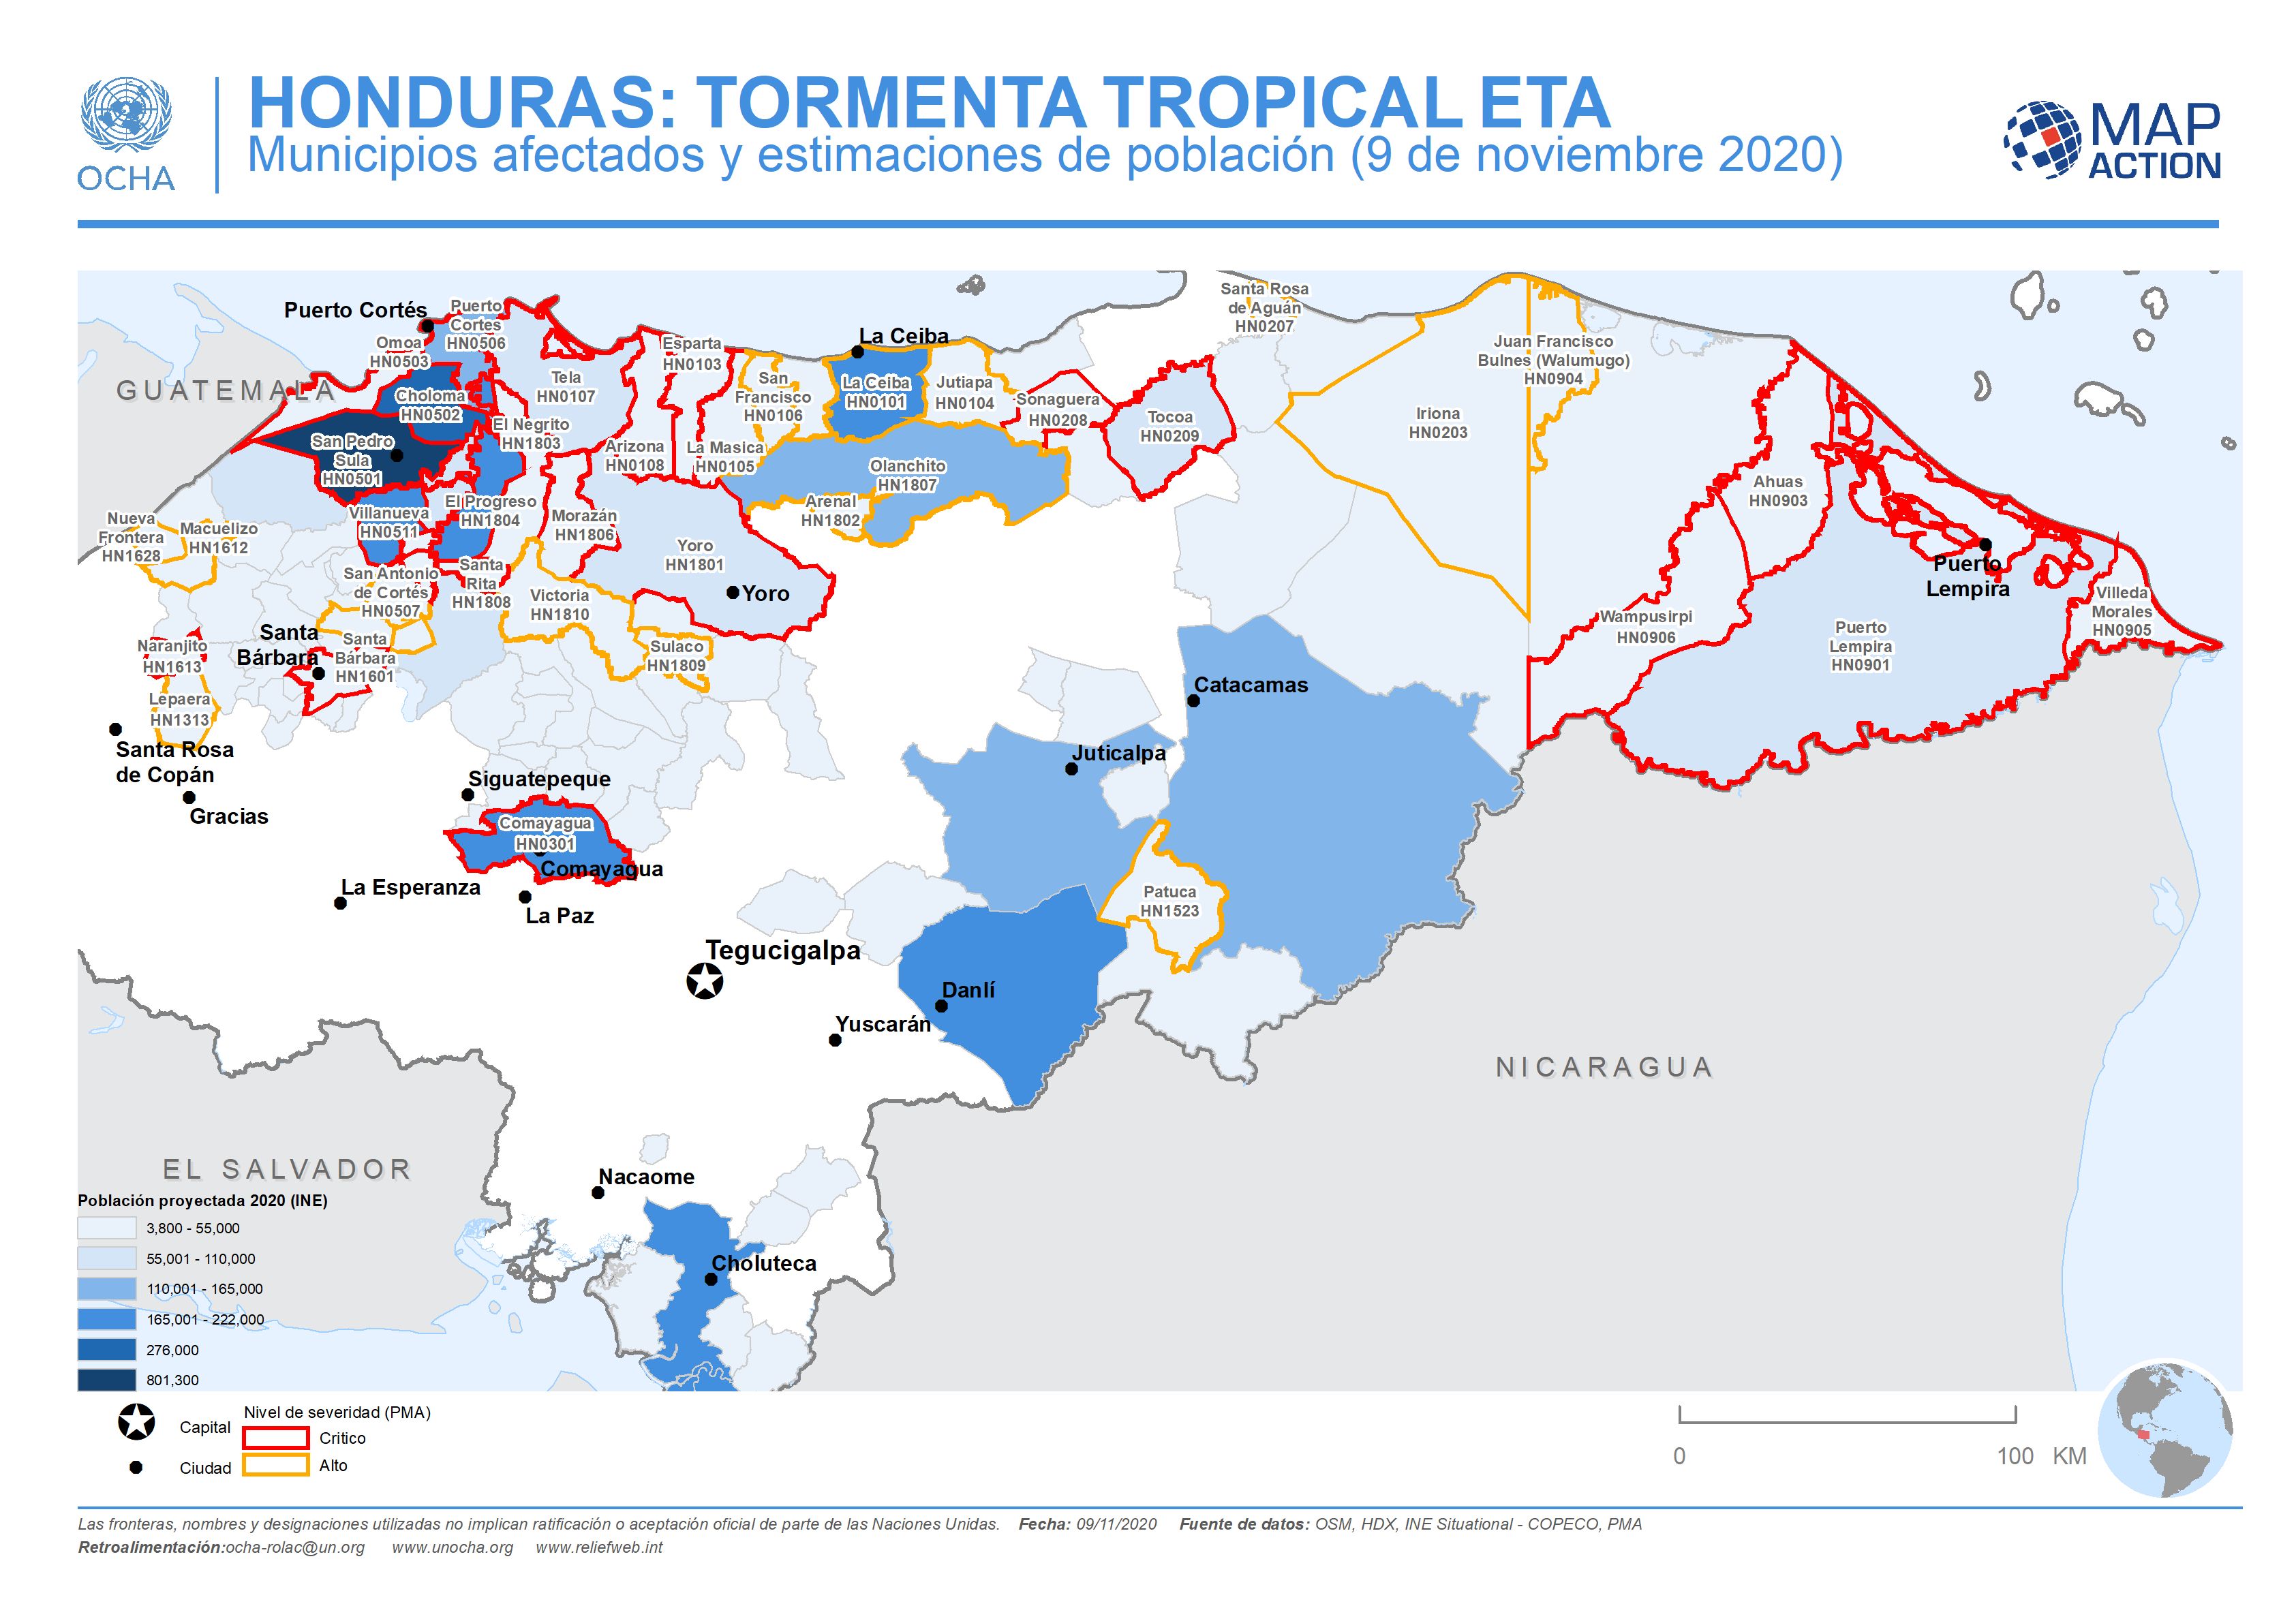
Honduras: Municipios afectados y estimaciones de población (9 de noviembre 2...
This map shows the affected administration level 2 municipalities for Honduras, with projected population 2020 (INE) and the level of severity (critical or high) for affected... -

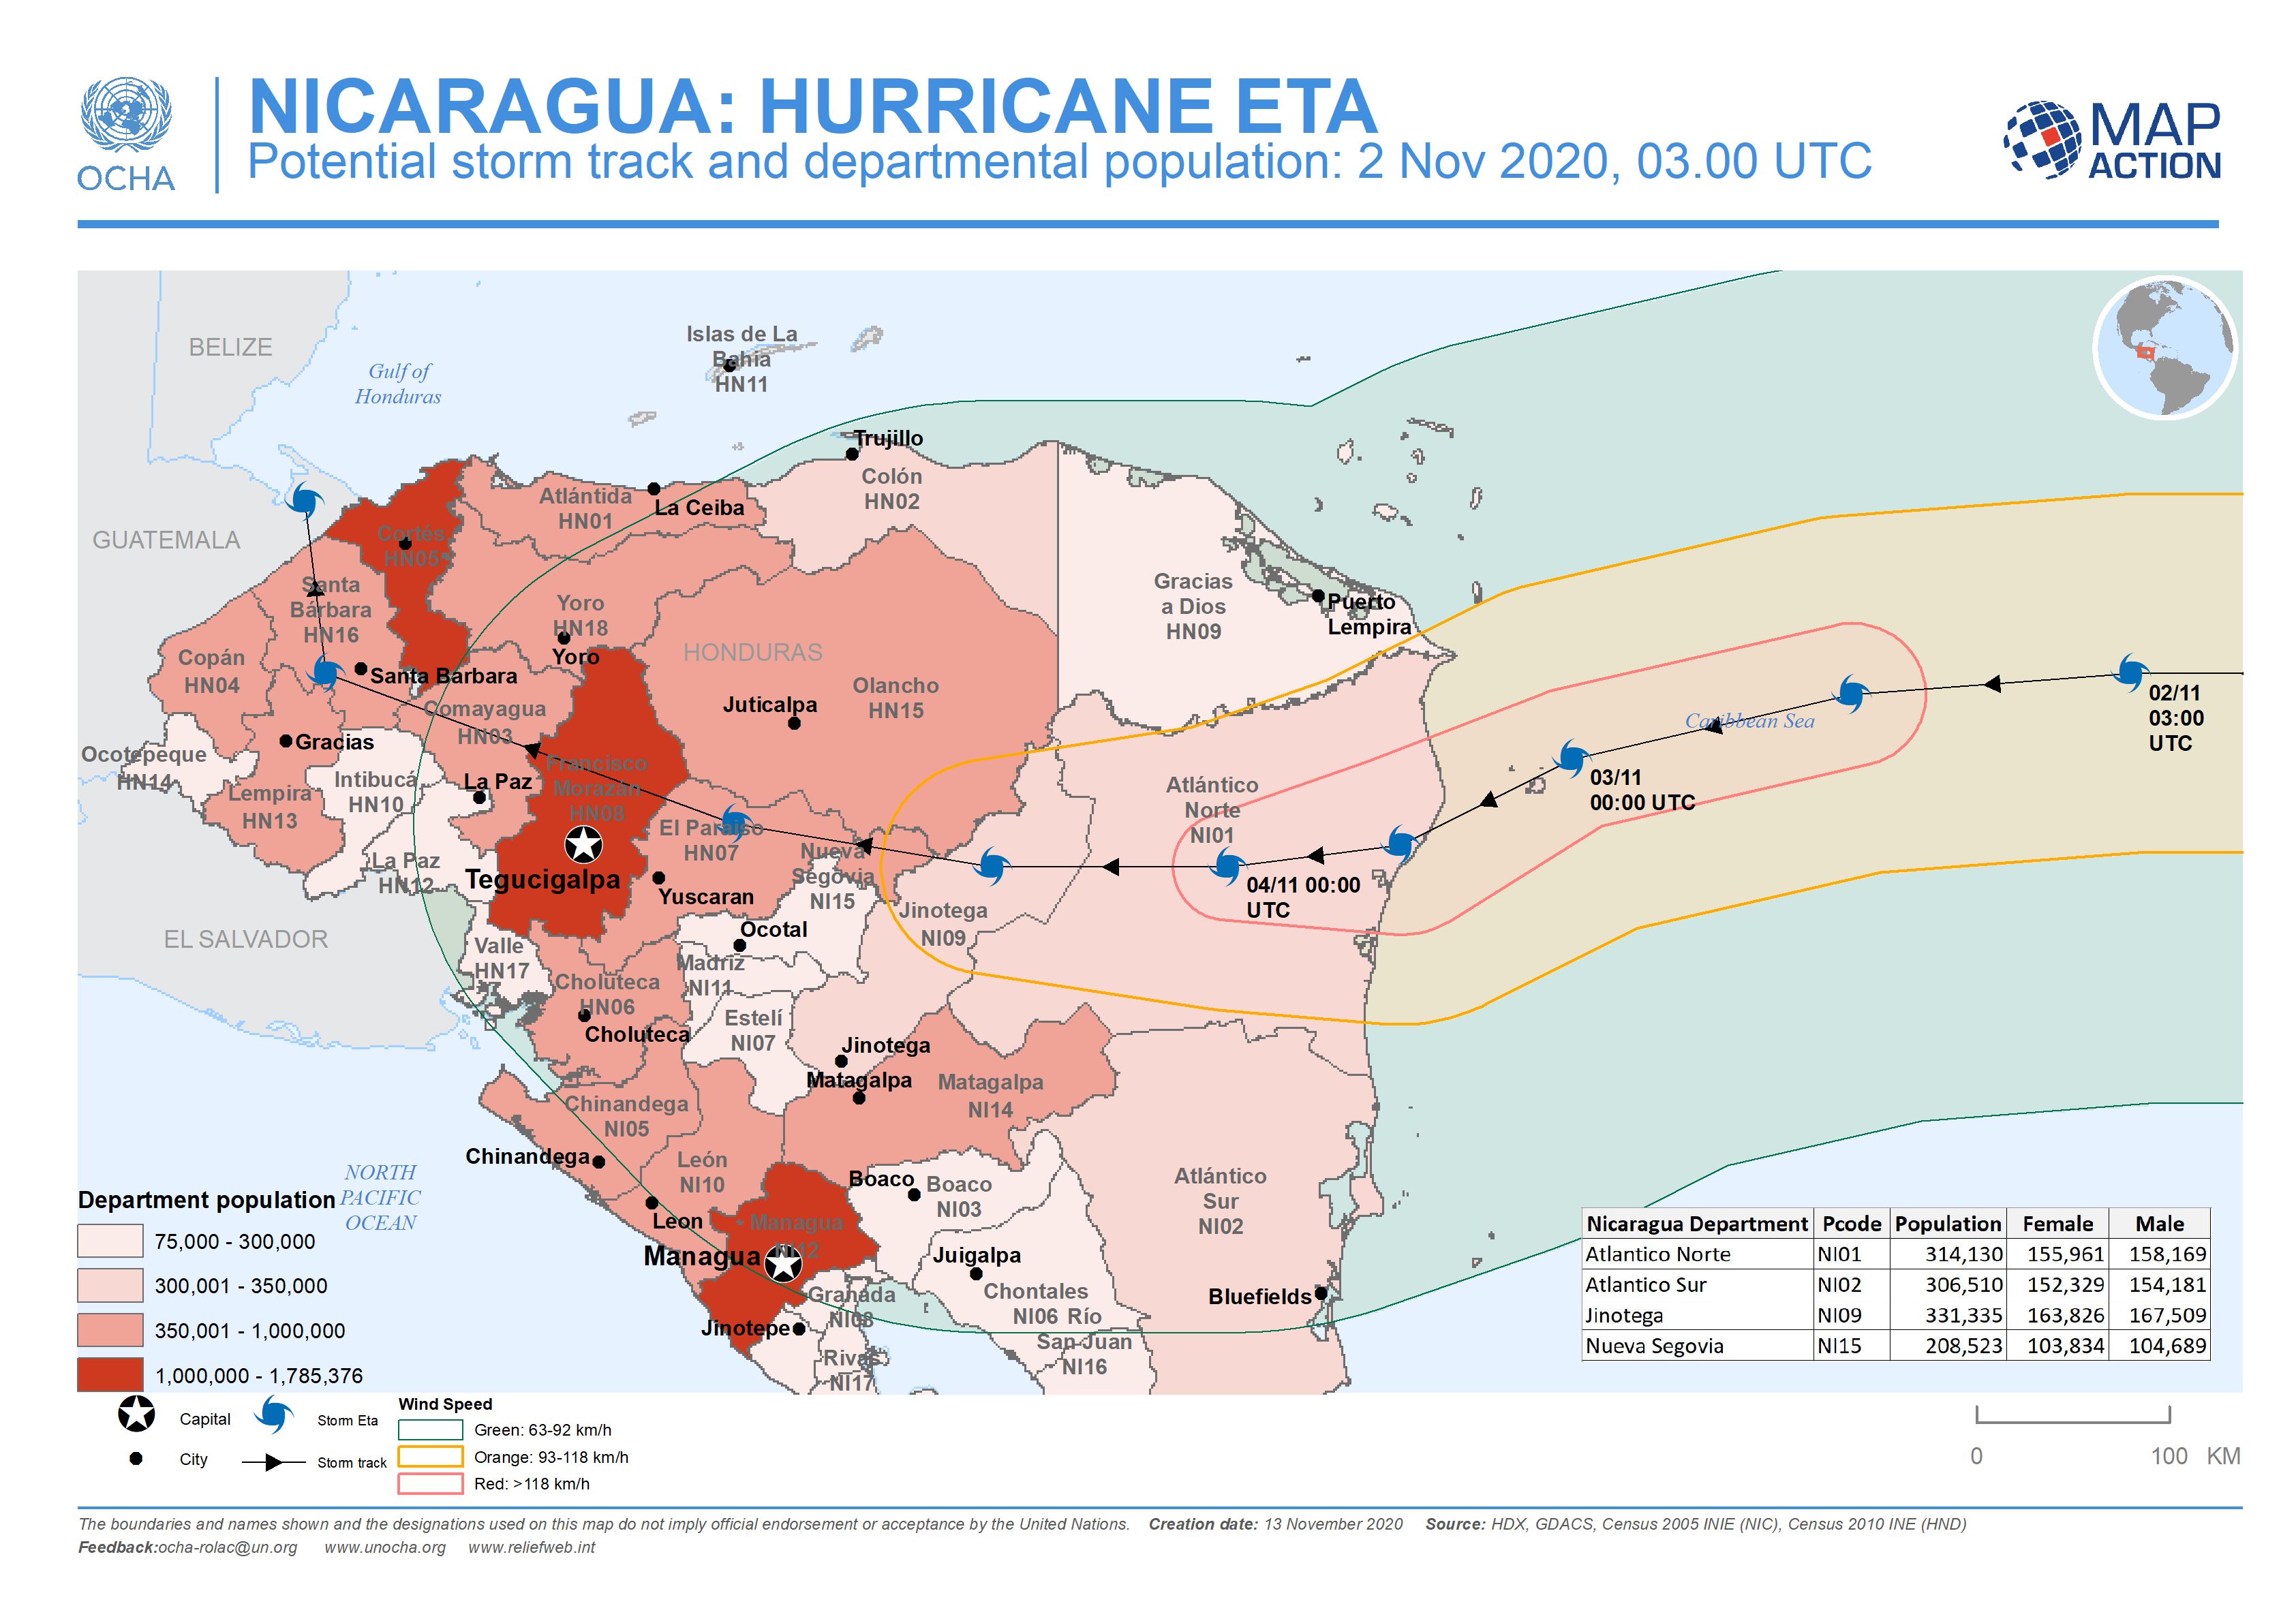
Nicaragua: Potential storm track and departmental population: 2 Nov 2020, 03....
This map shows the potentially affected administration level 1 departments for Nicaragua and Honduras, with departmental population and predicted wind speed cones. -

Nicaragua and Honduras: Potential storm track, population and municipalities:...
This map shows the potentially affected administration level 2 municipalities for Nicaragua, with departmental population for Nicaragua and Honduras, and predicted wind speed... -

Nicaragua: Potential storm track, elevation and municipalities: 3 Nov 2020, ...
This map shows the affected administration level 2 municipalities for Nicaragua, with population estimates and predicted wind speed cones. -

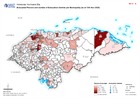
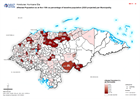
Honduras: Affected Population as at Nov 14th as percentage of baseline popula...
Map shows affected population as at Nov 14th as percentage of baseline population (2020 projected) per Municipality. -

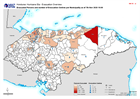
Honduras: Evacuated Persons and number of Evacuation Centres per Municipality...
Map shows evacuated persons and number of evacuation centres per Municipality (as at 14th Nov 2020) -
Honduras: Evacuated Persons and number of Evacuation Centres per Municipality...
Map shows evacuated persons and number of evacuation centres per Municipality (as at 13th Nov 2020) -

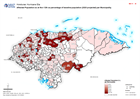
Honduras: Affected Population as at Nov 13th as percentage of baseline popula...
Map shows affected population as at Nov 13th as percentage of baseline population (2020 projected) per Municipality. -
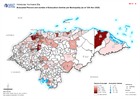
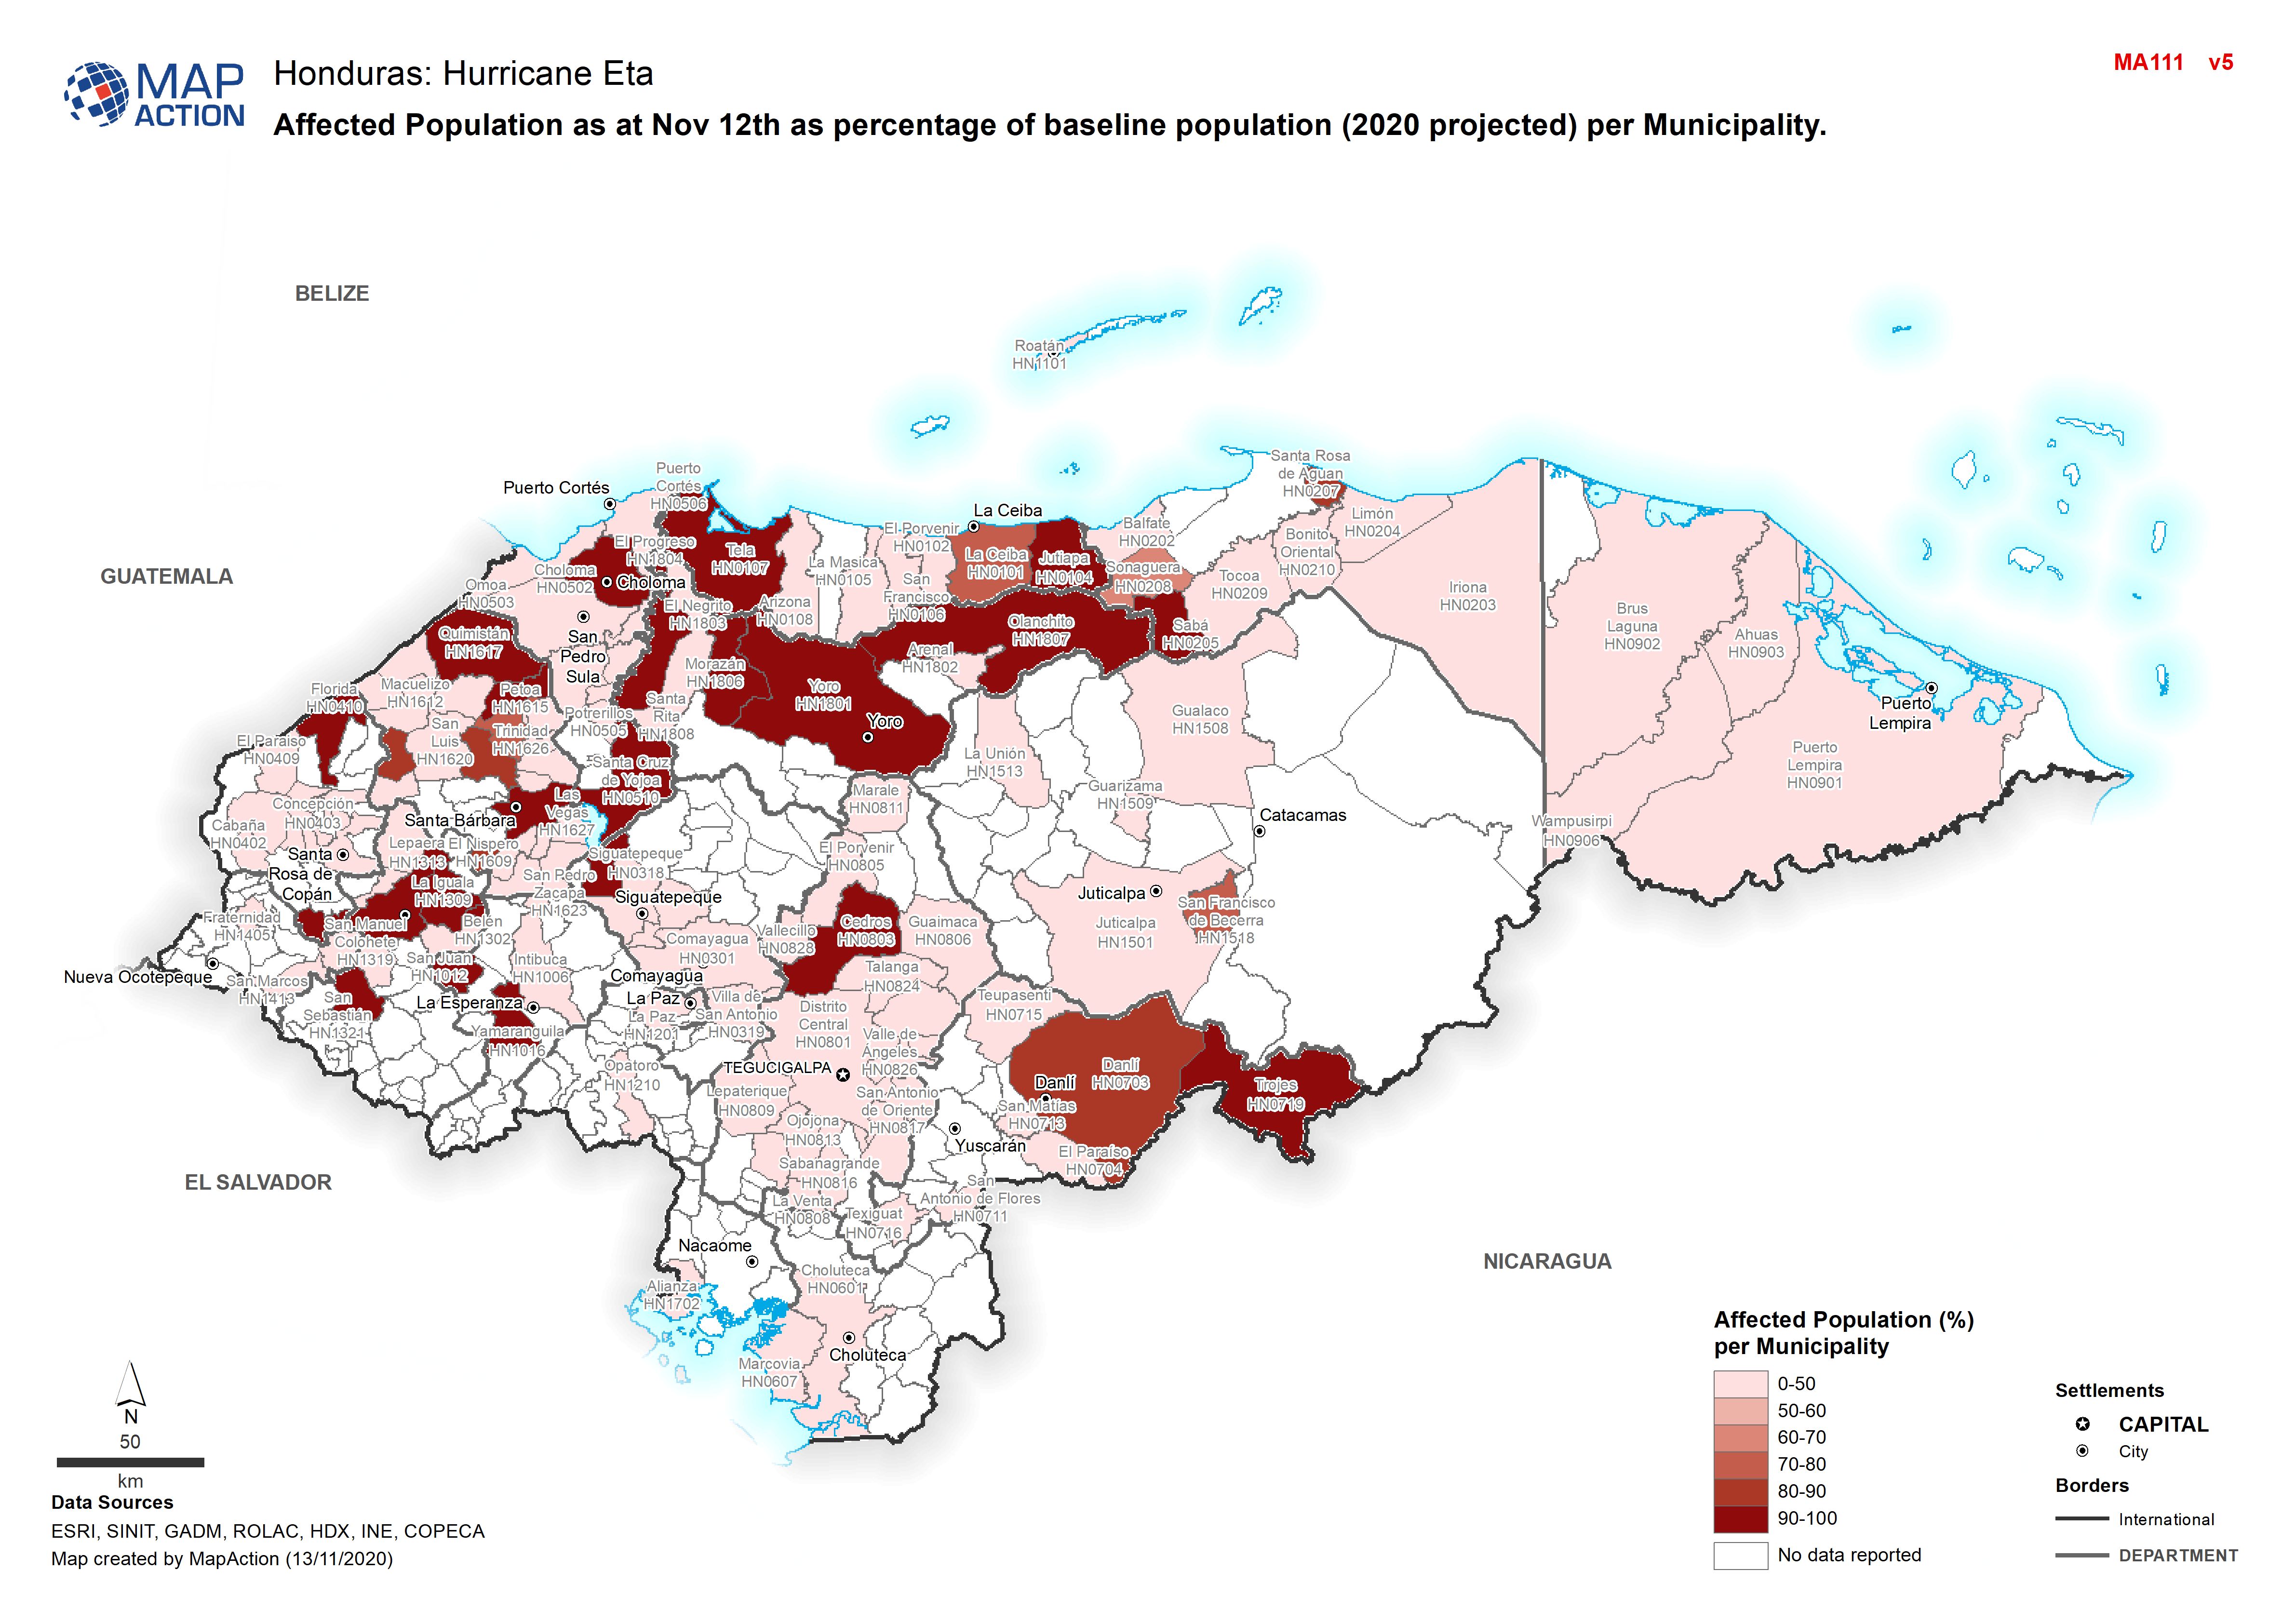
Honduras: Affected Population as at Nov 12th as percentage of baseline popula...
Map shows affected population as at Nov 12th as percentage of baseline population (2020 projected) per Municipality. -
Honduras: Evacuated Persons and number of Evacuation Centres per Municipality...
Map shows evacuated persons and number of evacuation centres per Municipality (as at 12th Nov 2020) -

Honduras: Evacuated Persons and number of Evacuation Centres per Municipality...
Map shows evacuated persons and number of evacuation centres per Municipality (as at 11th Nov 2020) -

Honduras: Affected Population as at Nov 11th as percentage of baseline popula...
Map shows affected population as at Nov 11th as percentage of baseline population (2020 projected) per Municipality. -
Honduras: Affected Population as at Nov 10th as percentage of baseline popula...
Map shows affected population as at Nov 10th as percentage of baseline population (2020 projected) per Municipality. -

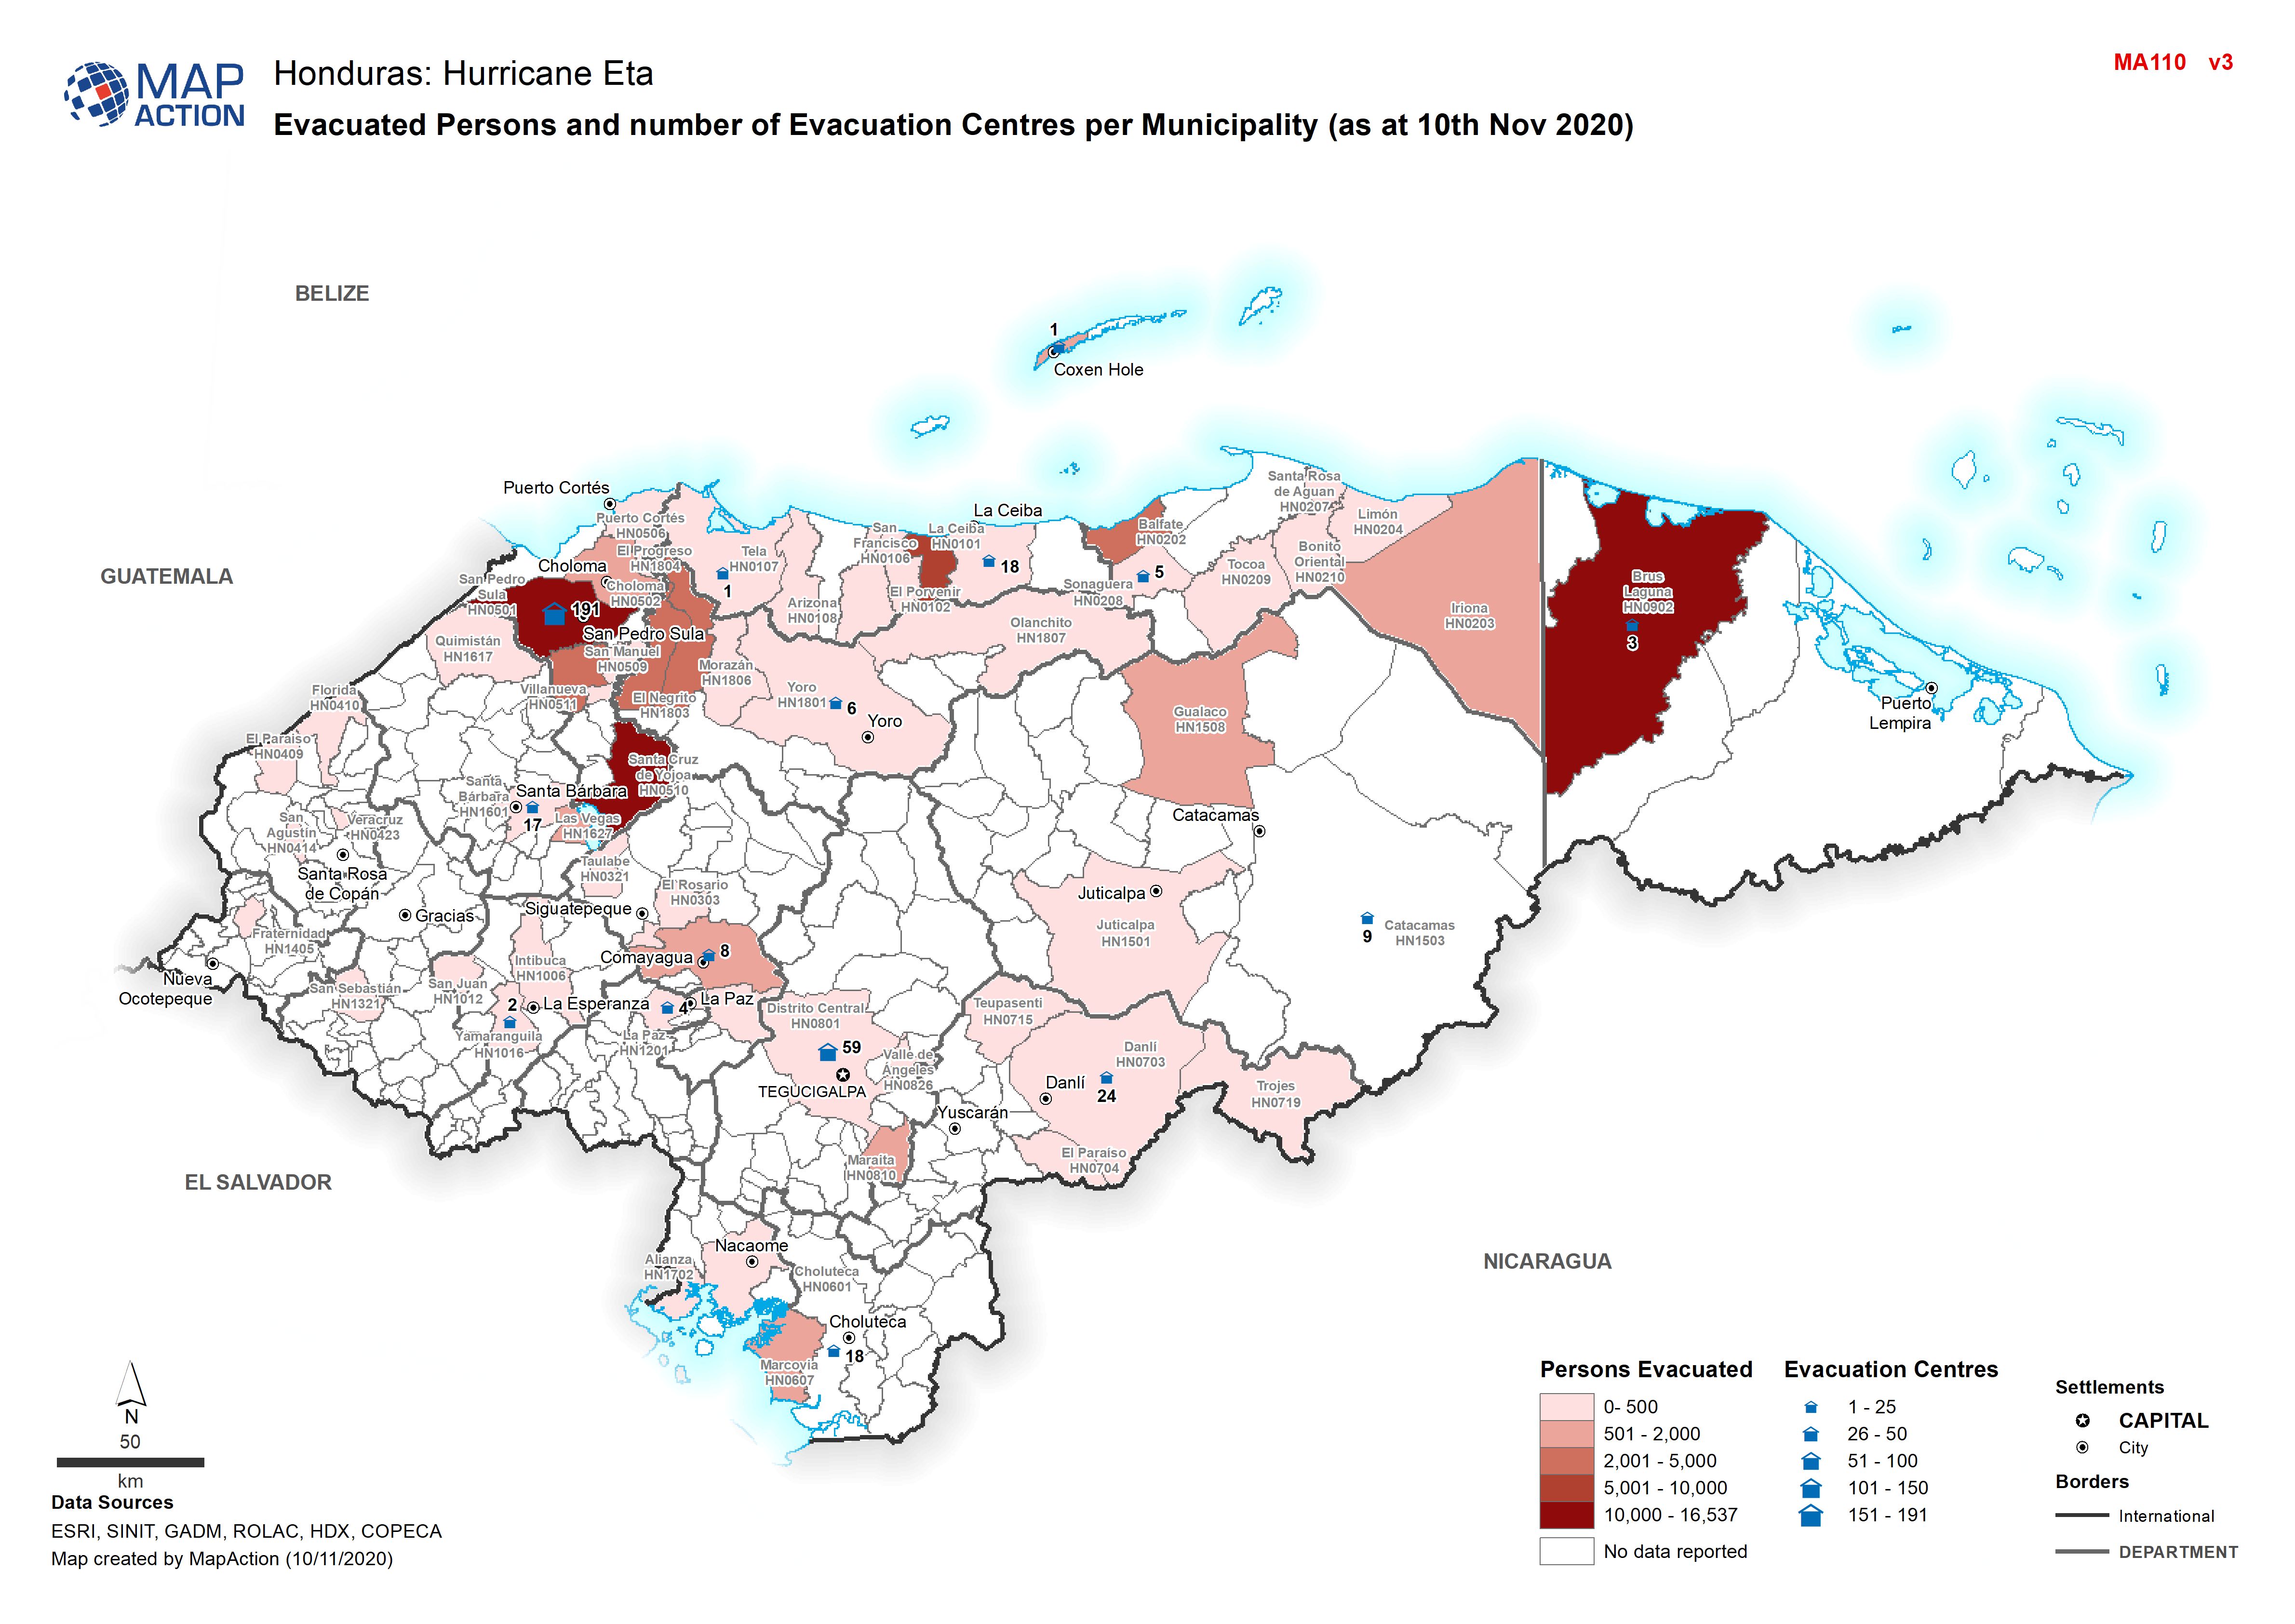
Honduras: Evacuated Persons and number of Evacuation Centres per Municipality...
Map shows evacuated persons and number of evacuation centres per Municipality (as at 10th Nov 2020) -

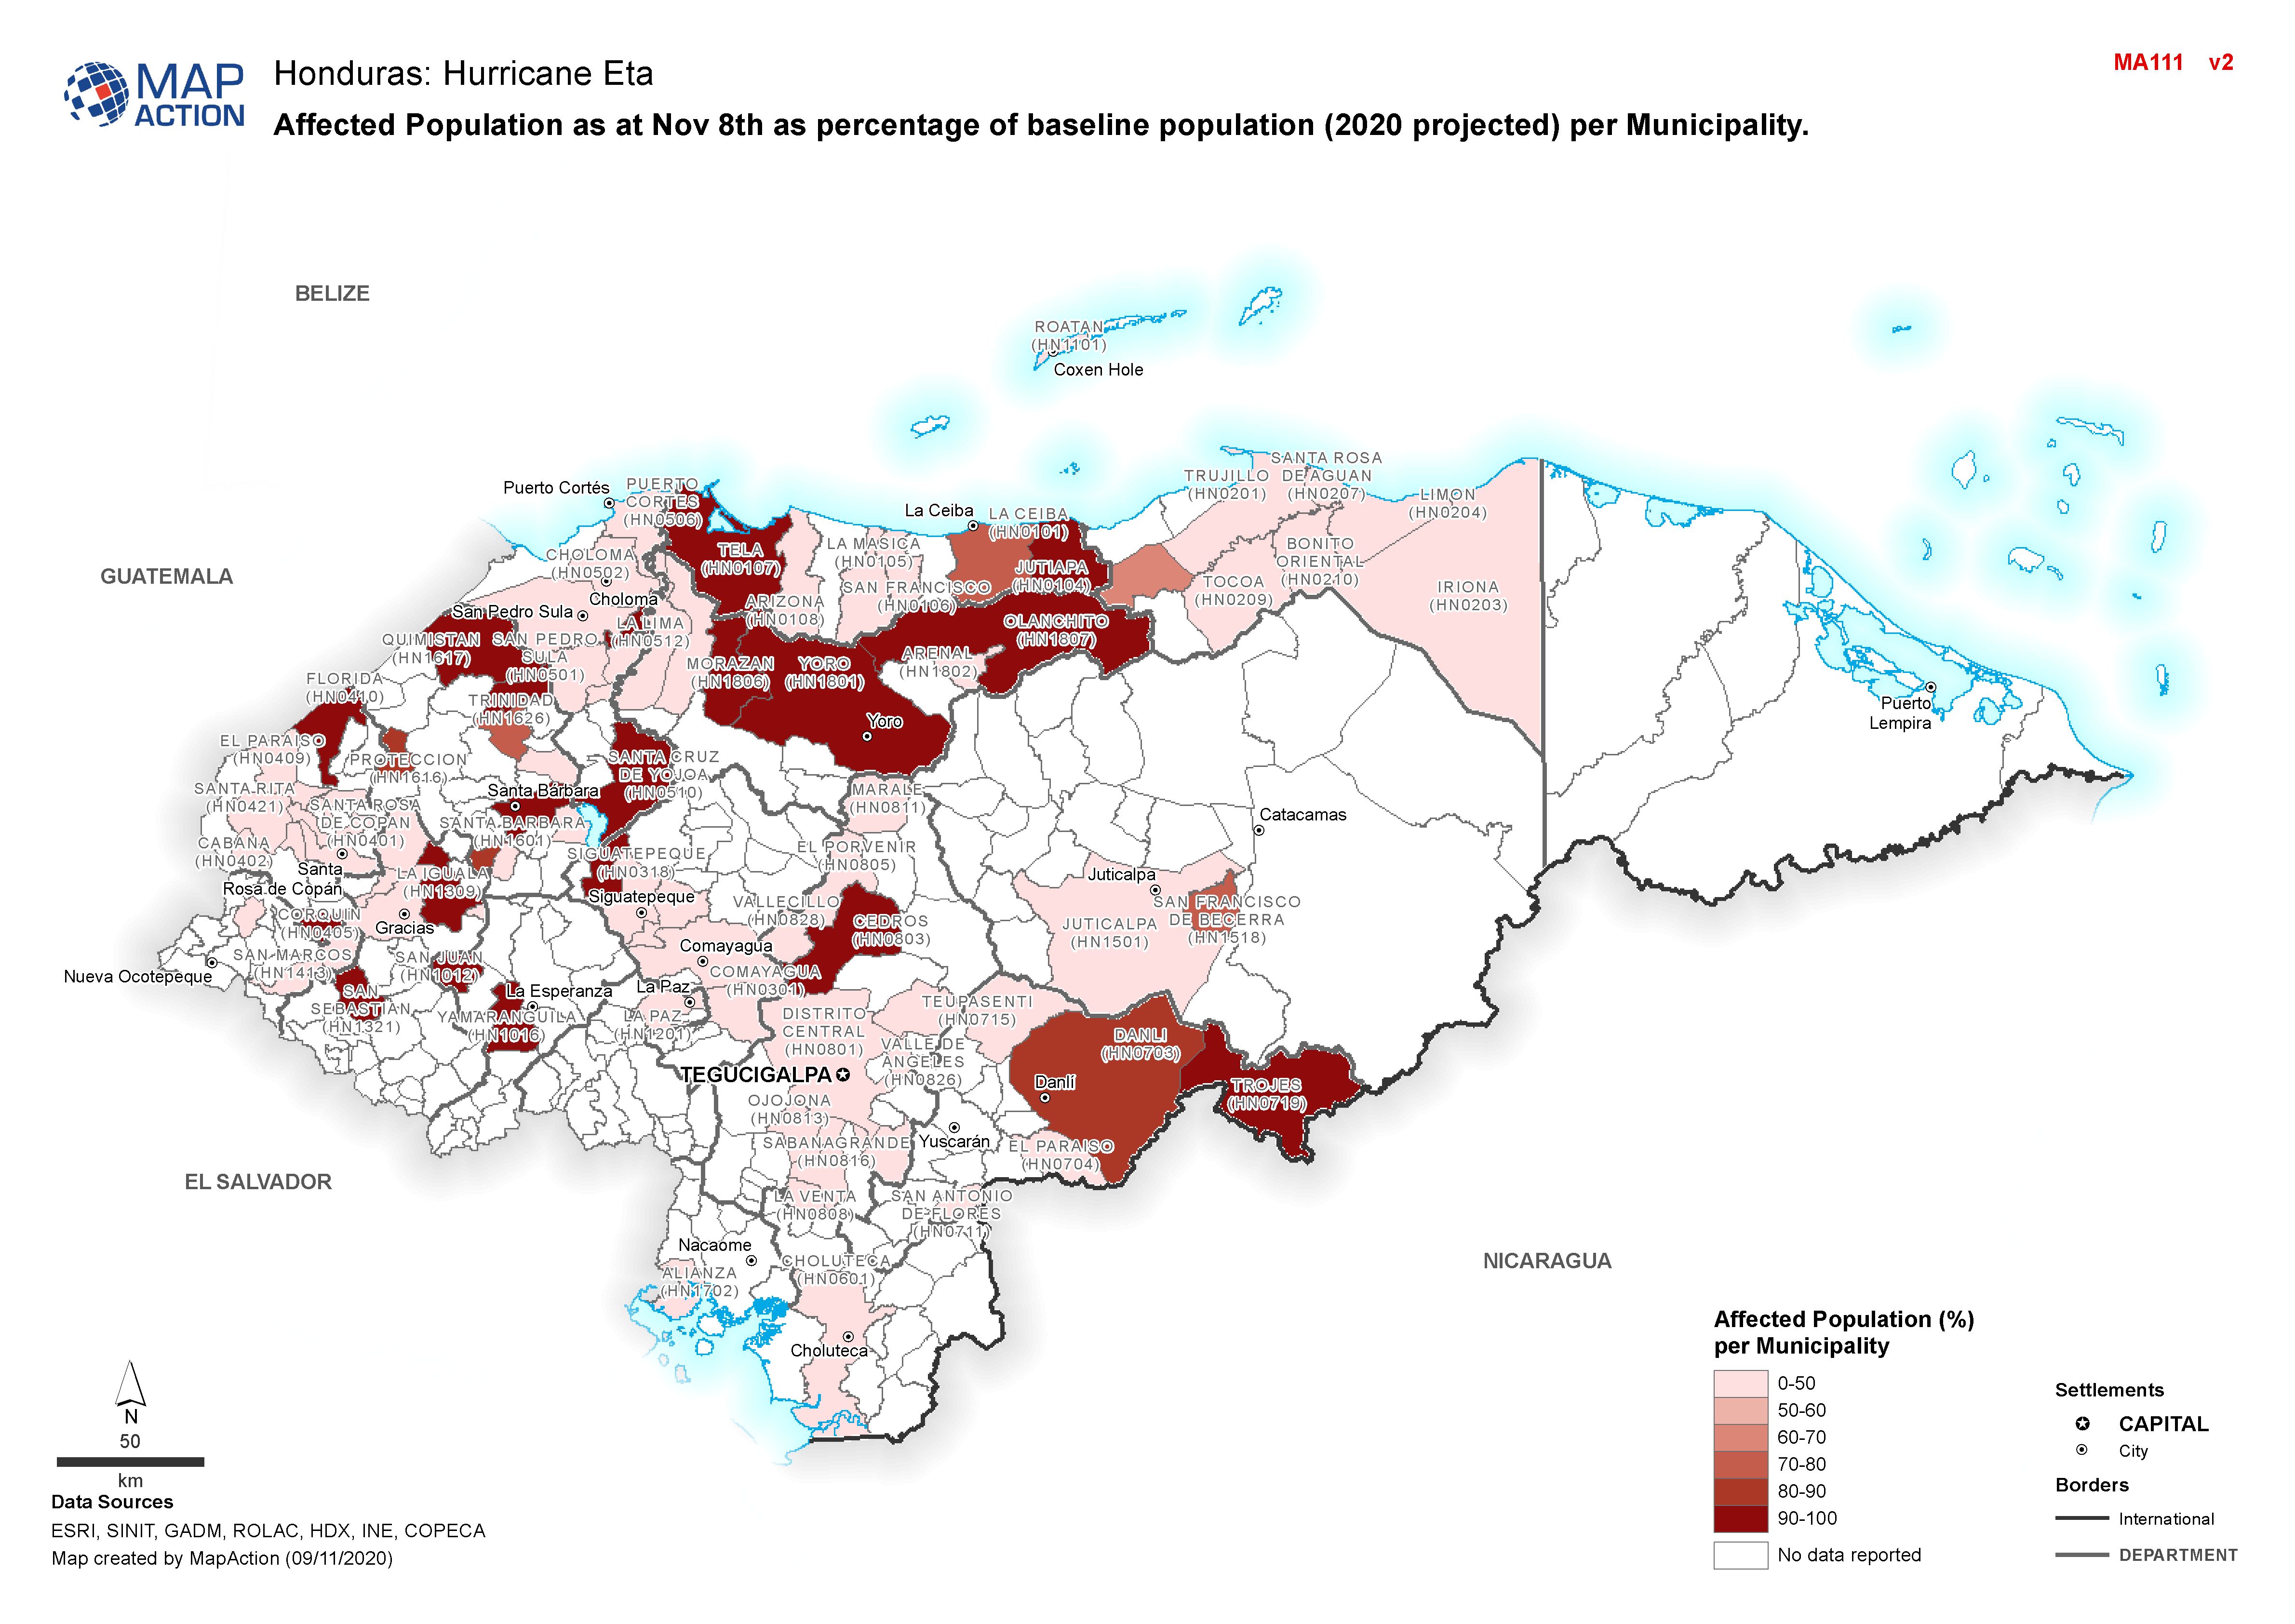
Honduras: Affected Population as at Nov 8th as percentage of baseline populat...
Map shows affected population as at Nov 8th as percentage of baseline population (2020 projected) per Municipality. -

Honduras: Evacuated Persons and number of Evacuation Centres per Municipality...
Map shows evacuated persons and number of evacuation centres per Municipality (as at 8th Nov 2020) -
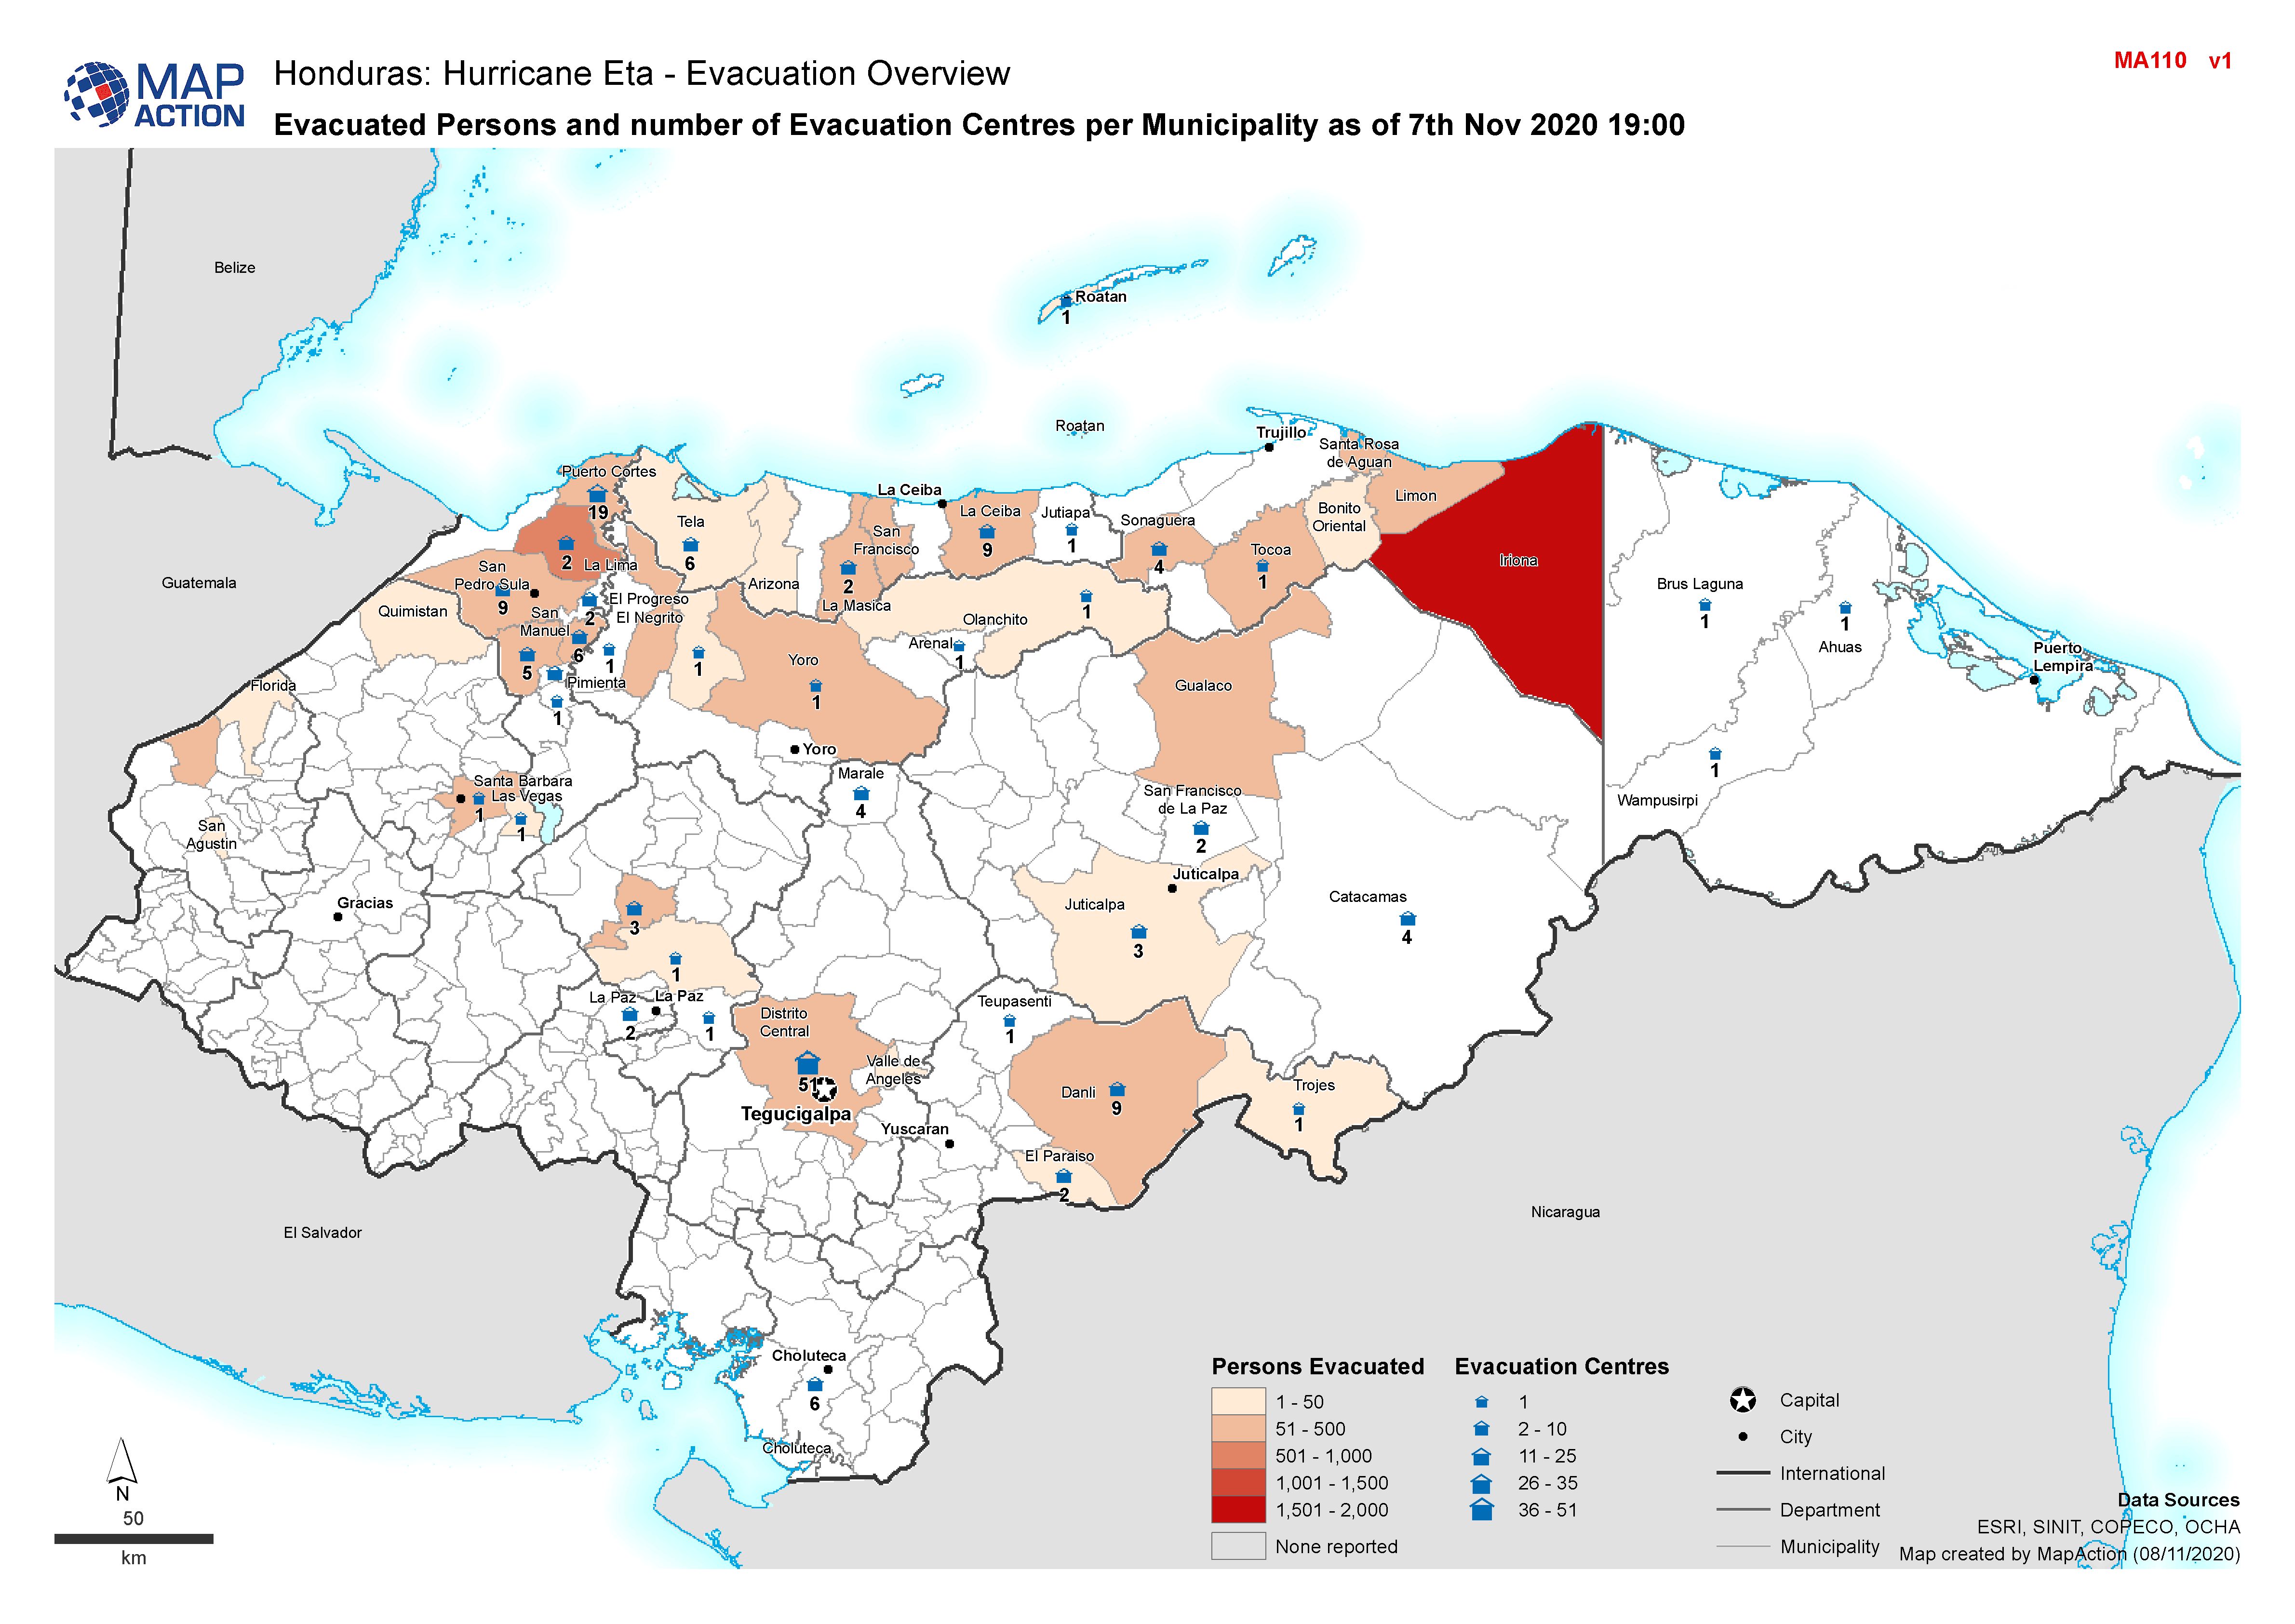
Honduras: Evacuated Persons and number of Evacuation Centres per Municipality...
Honduras, Evacuated Persons and number of Evacuation Centres per Municipality as of 7th Nov 2020 19:00 -

The Philippines: Typhoon Goni (Rolly) - Affected population by Municipality (...
Map shows the number of reported affected people per Municipality. -

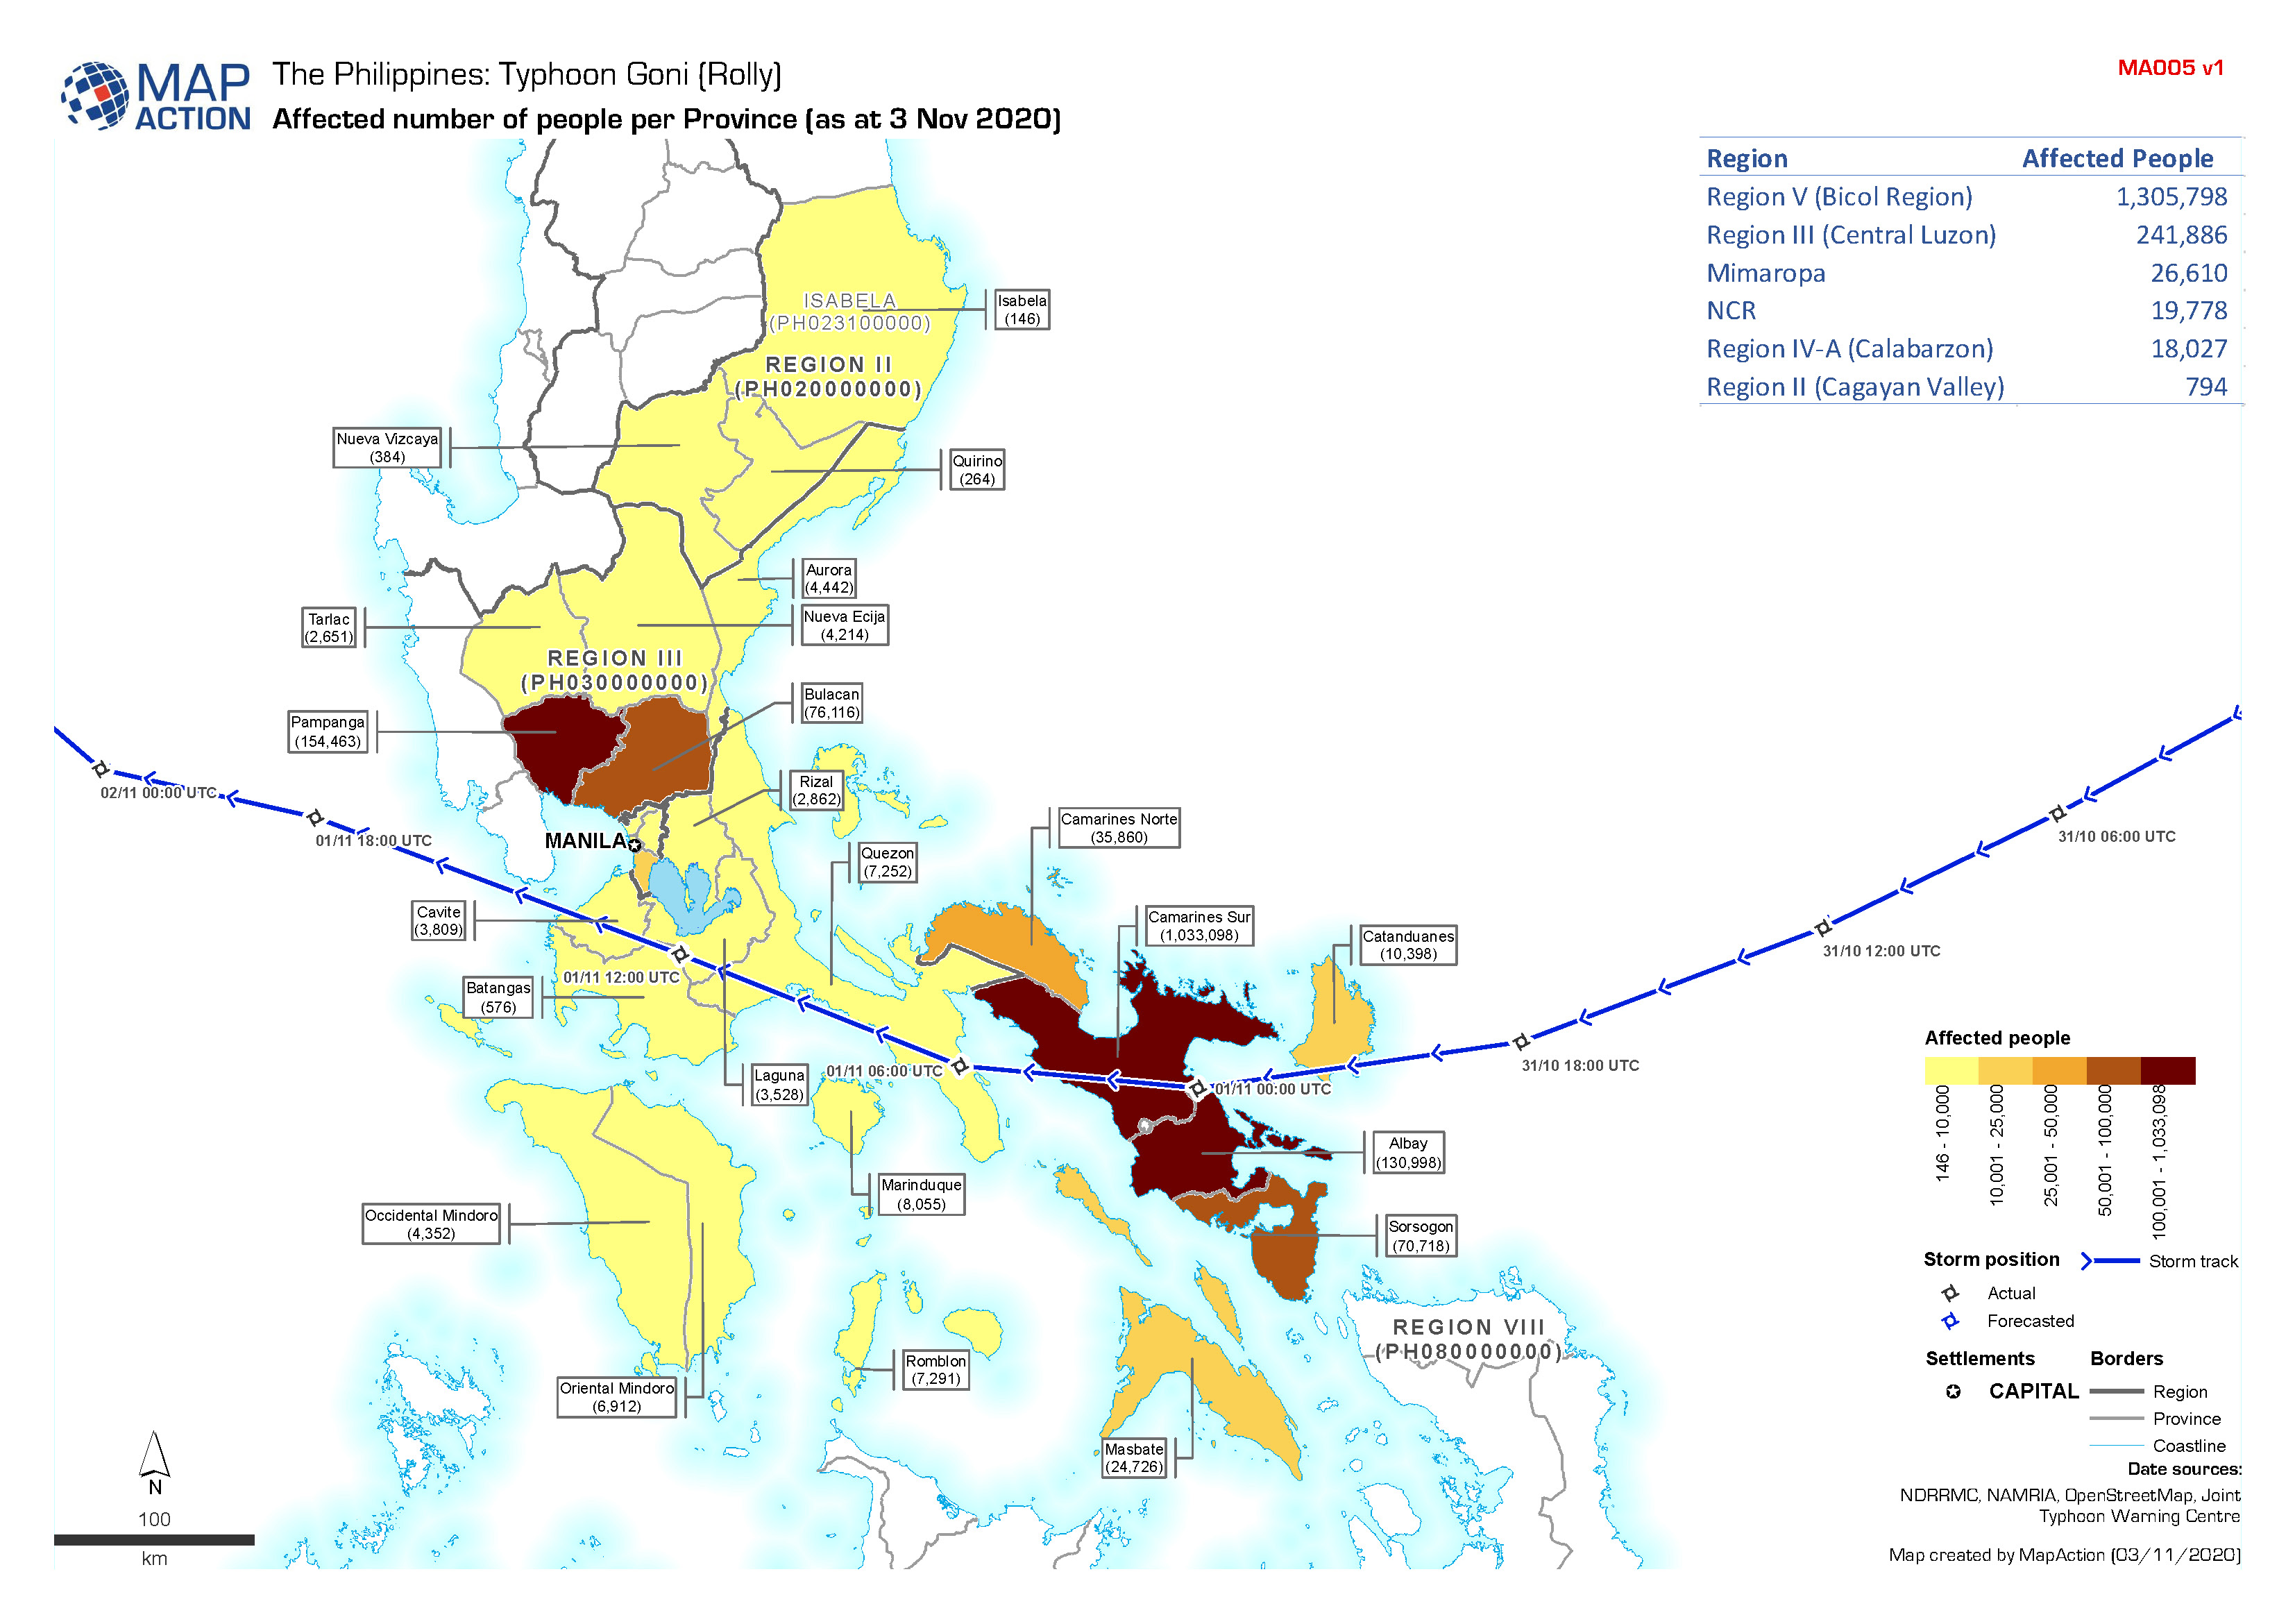
The Philippines: Typhoon Goni (Rolly) - Affected number of people (as at 3 No...
Map shows the number of affected people per Province. -
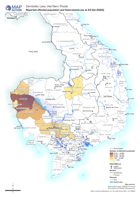
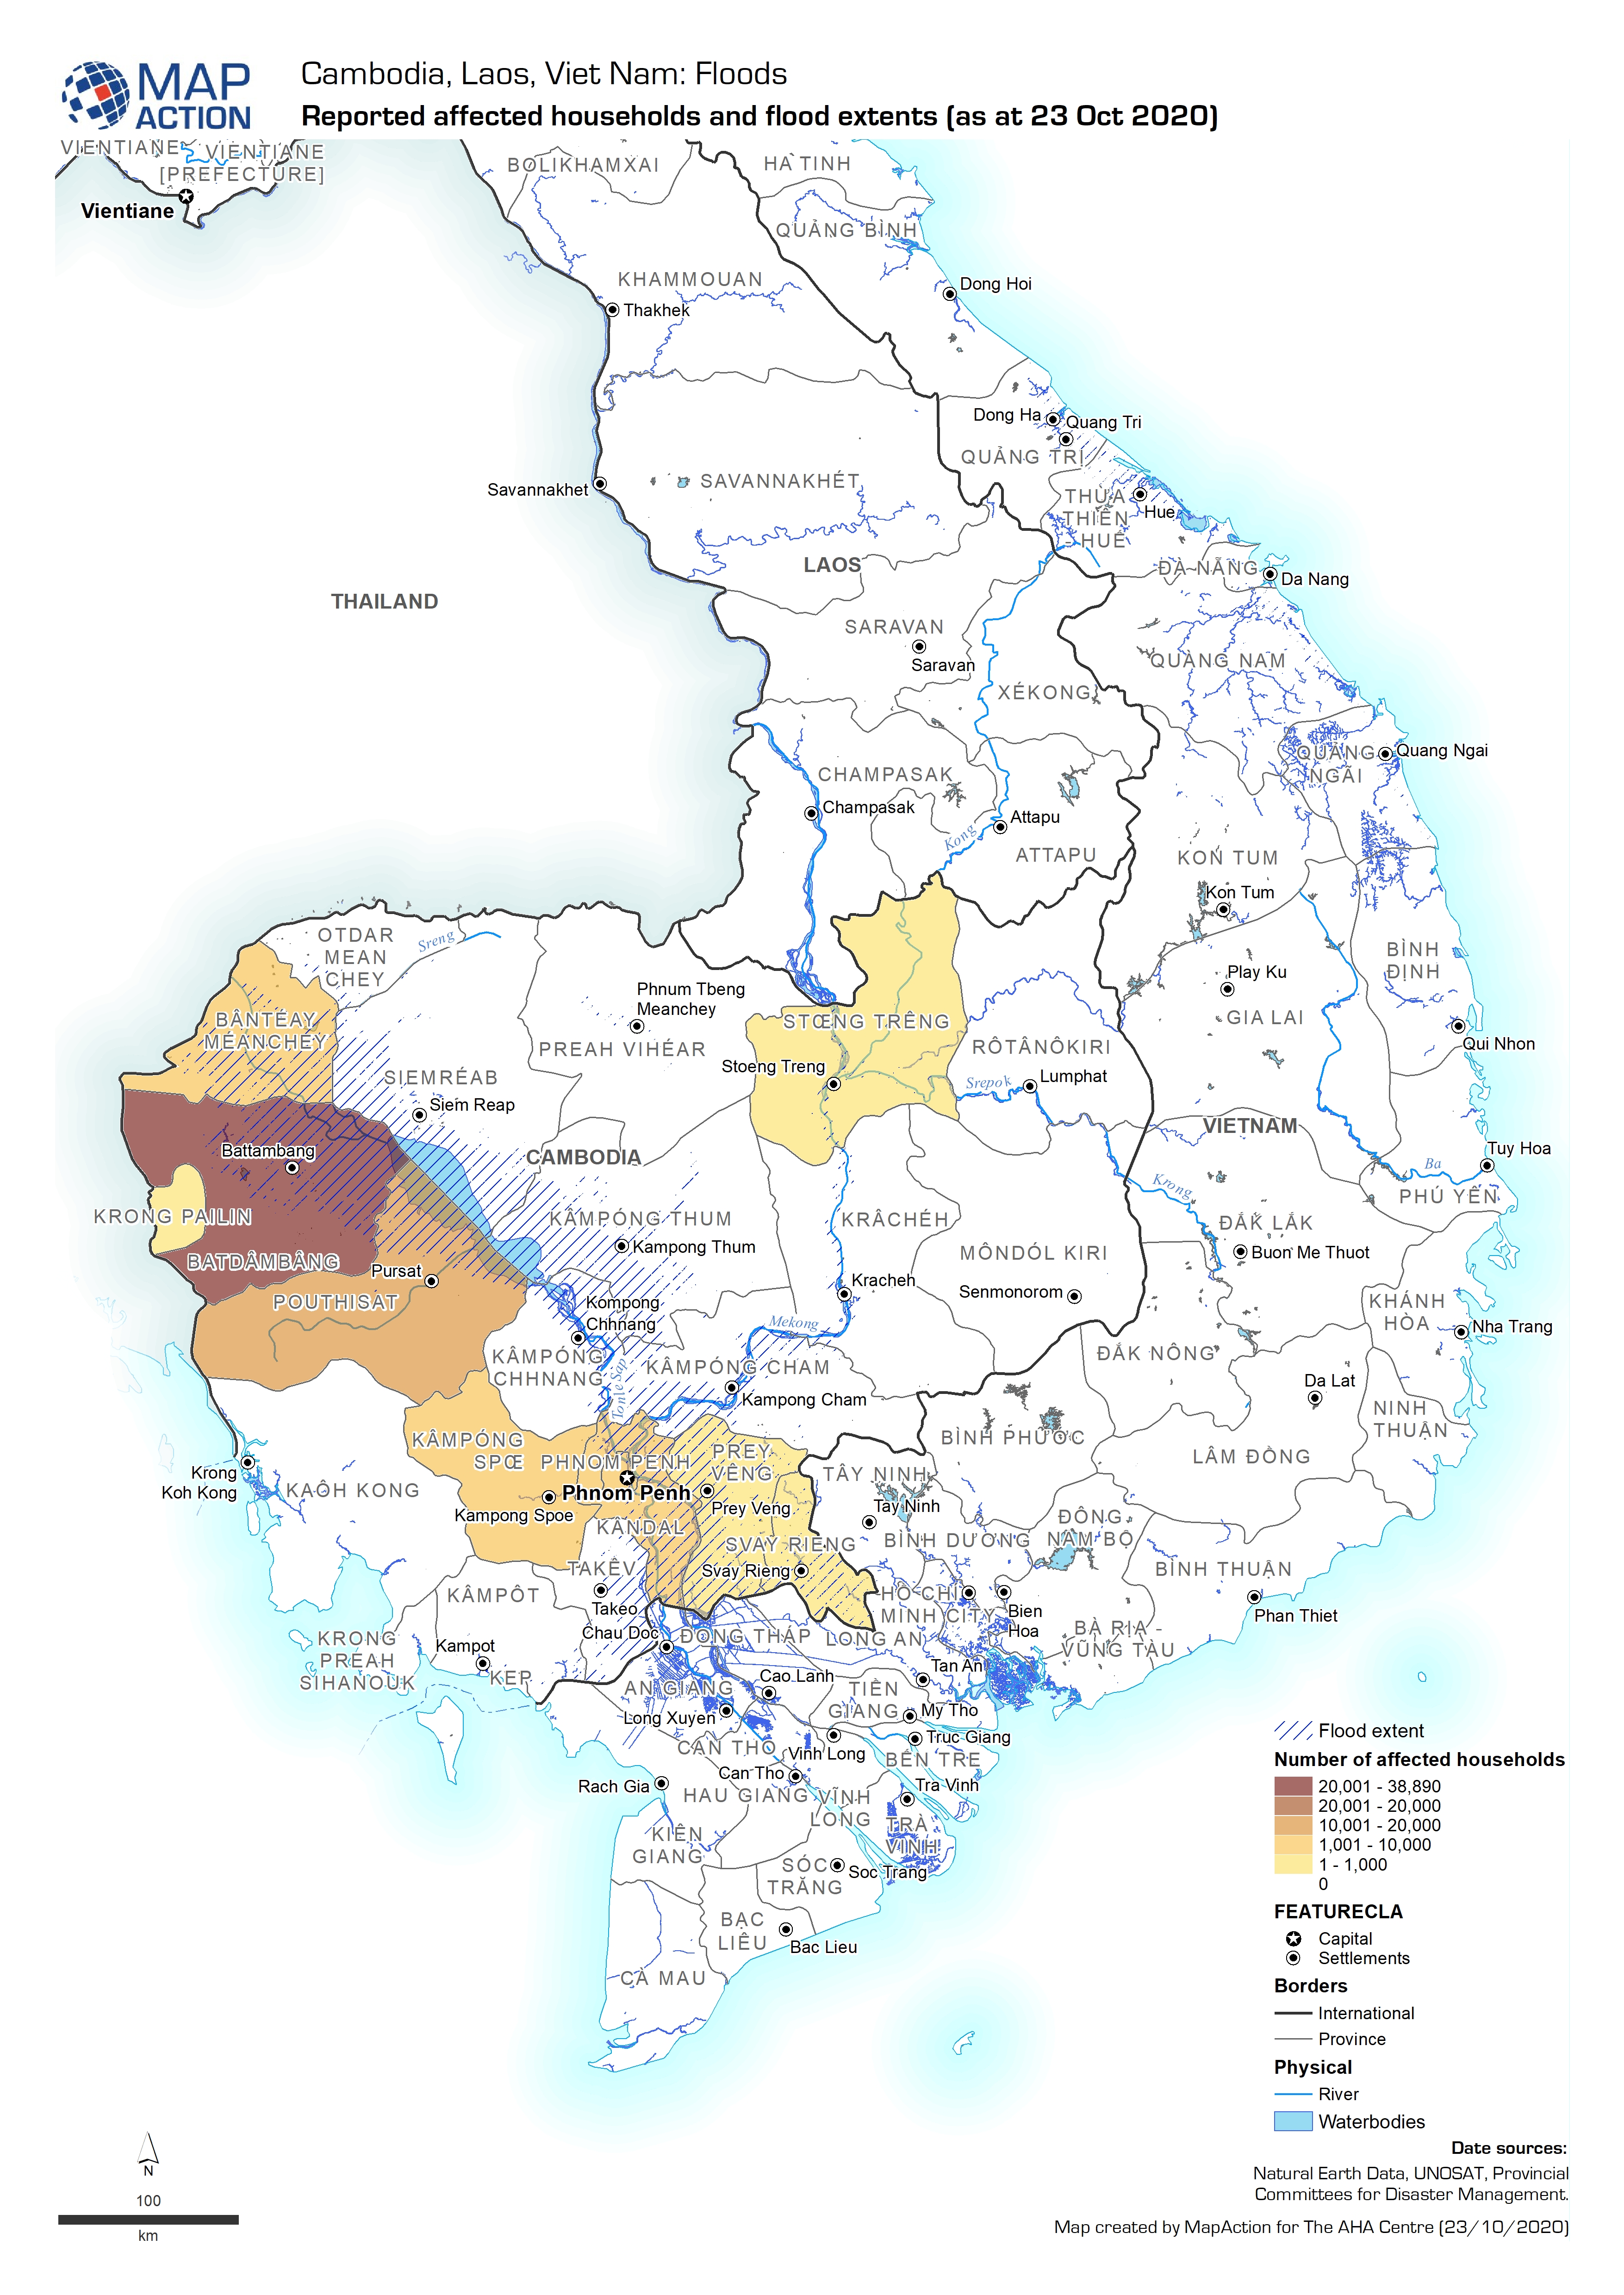
Reported affected households and flood extents (as at 23 Oct 2020)
Map shows the reported number of households affected by flooding in Cambodia.