-
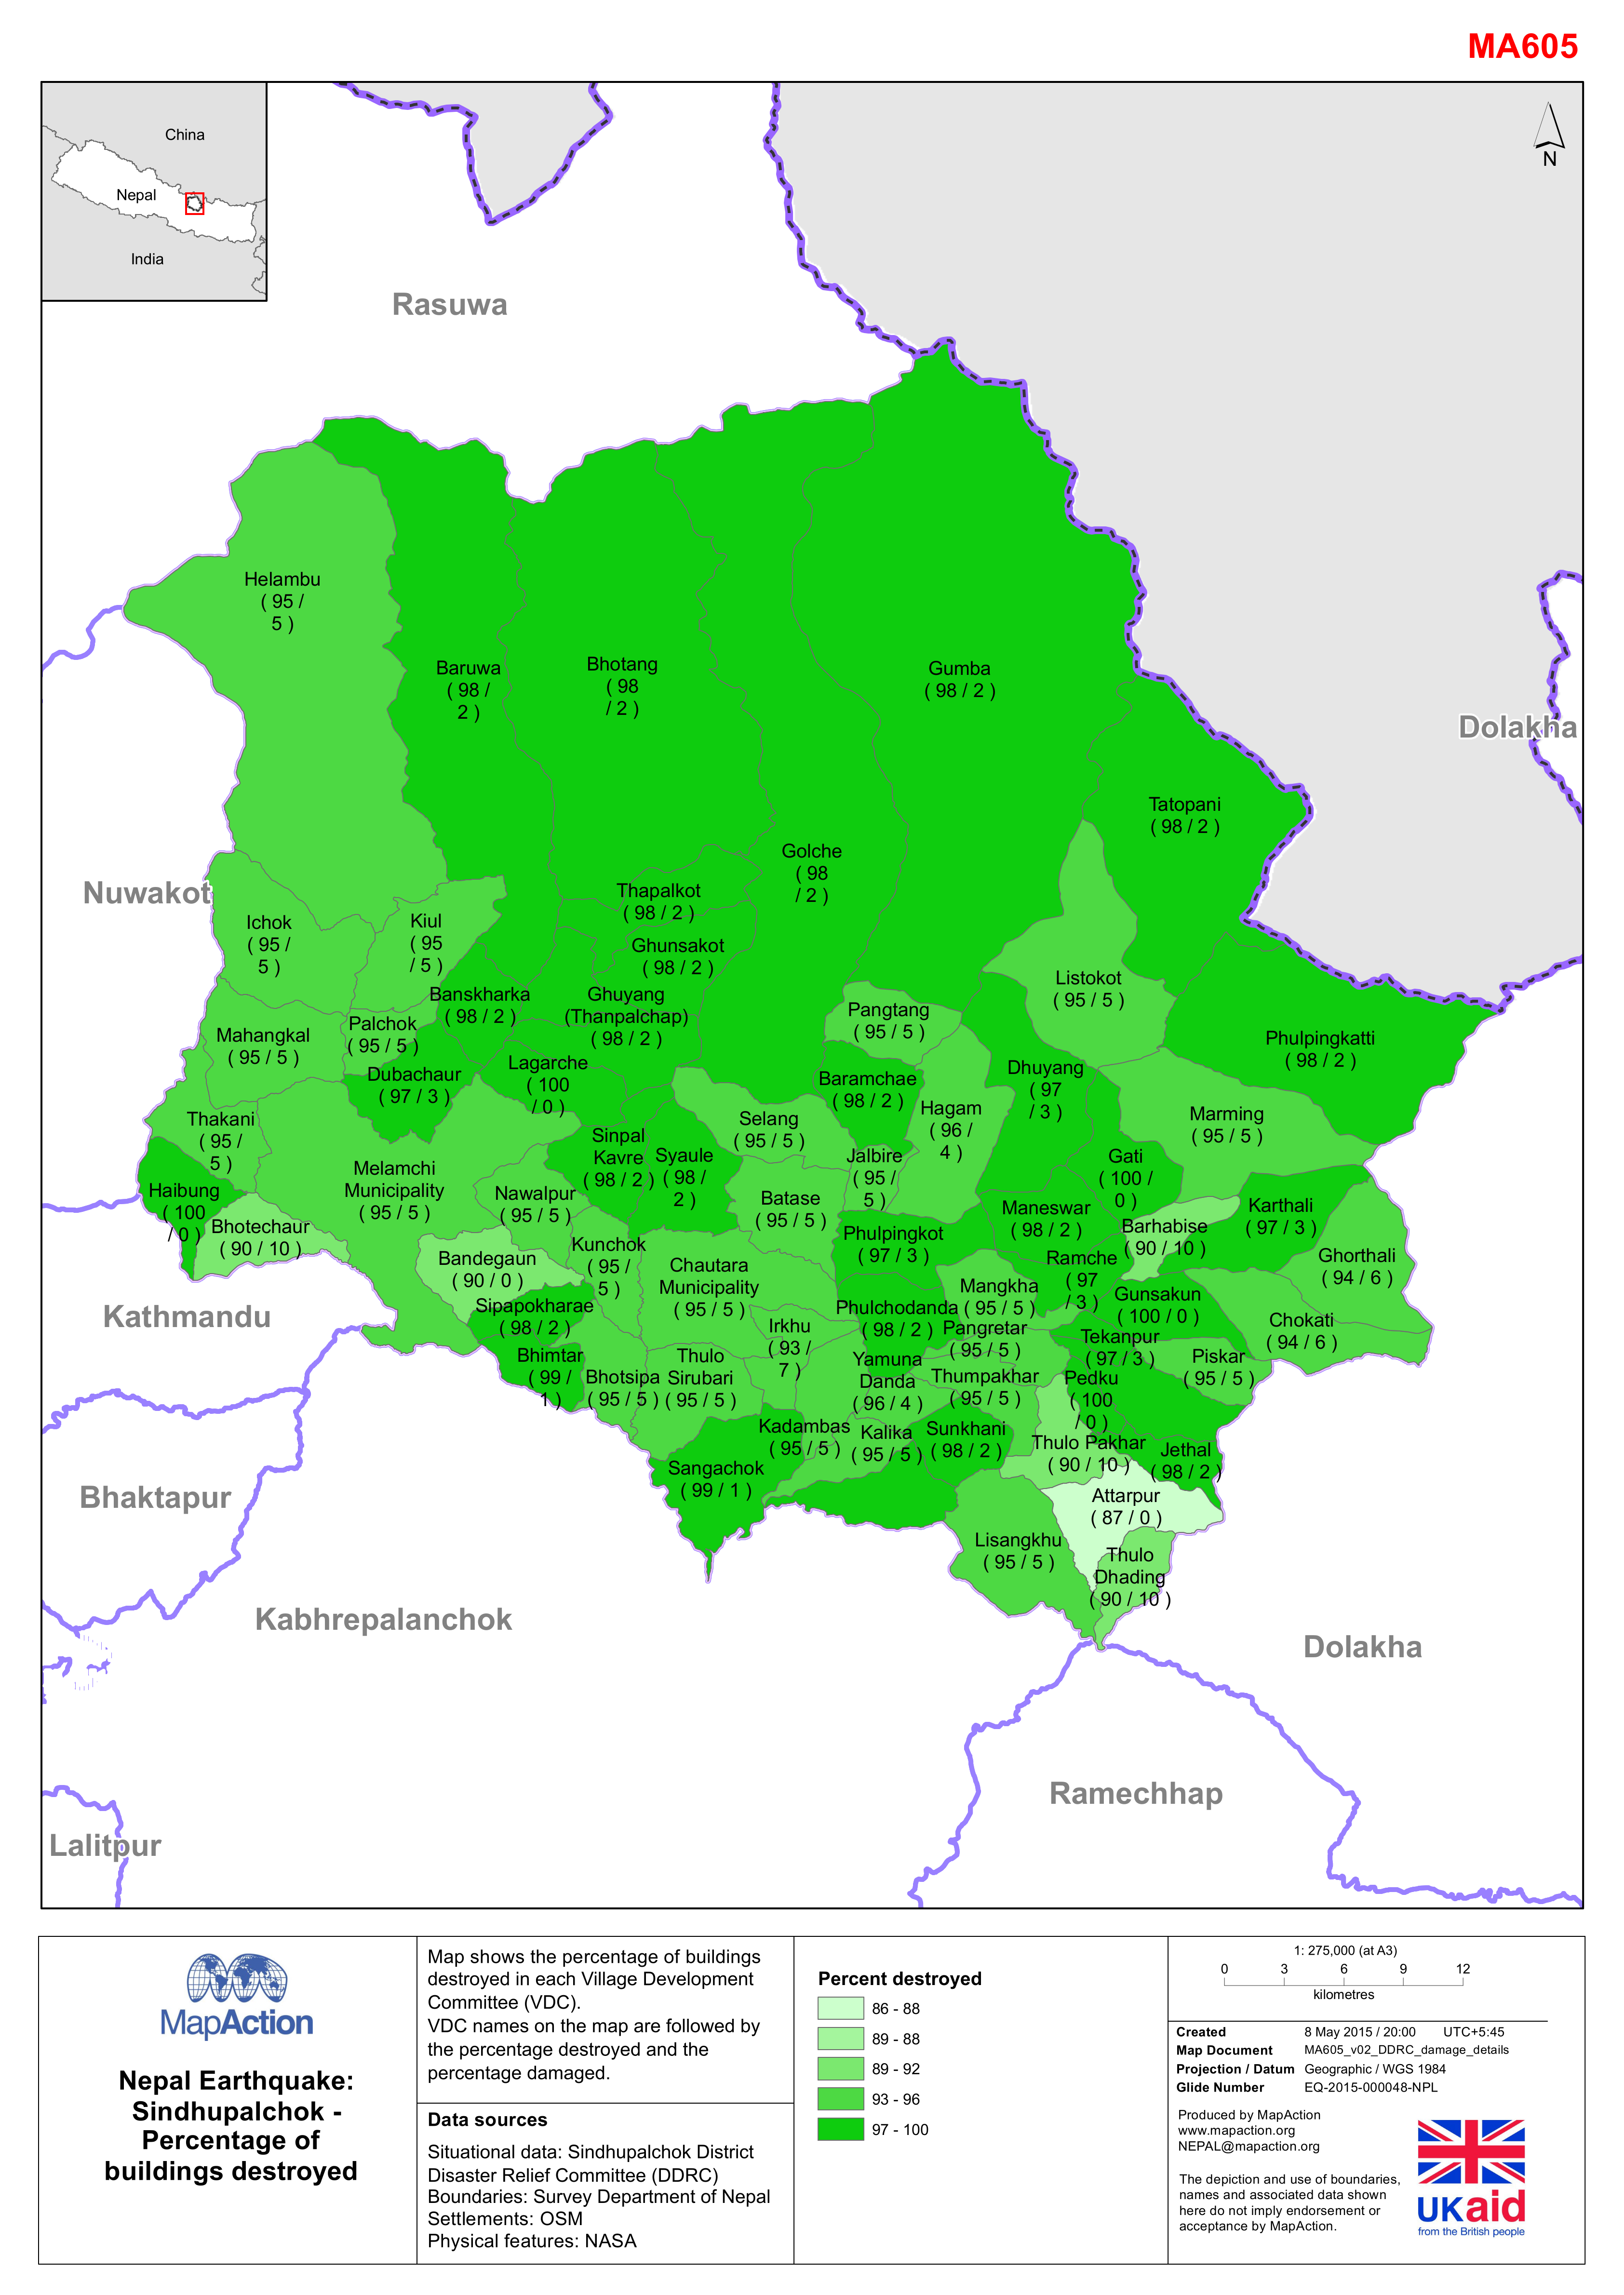
Map shows the percentage of buildings destroyed in each Village Development Committee (VDC). The VDC names on the map are followed by the percentage destroyed and the percentage...
-

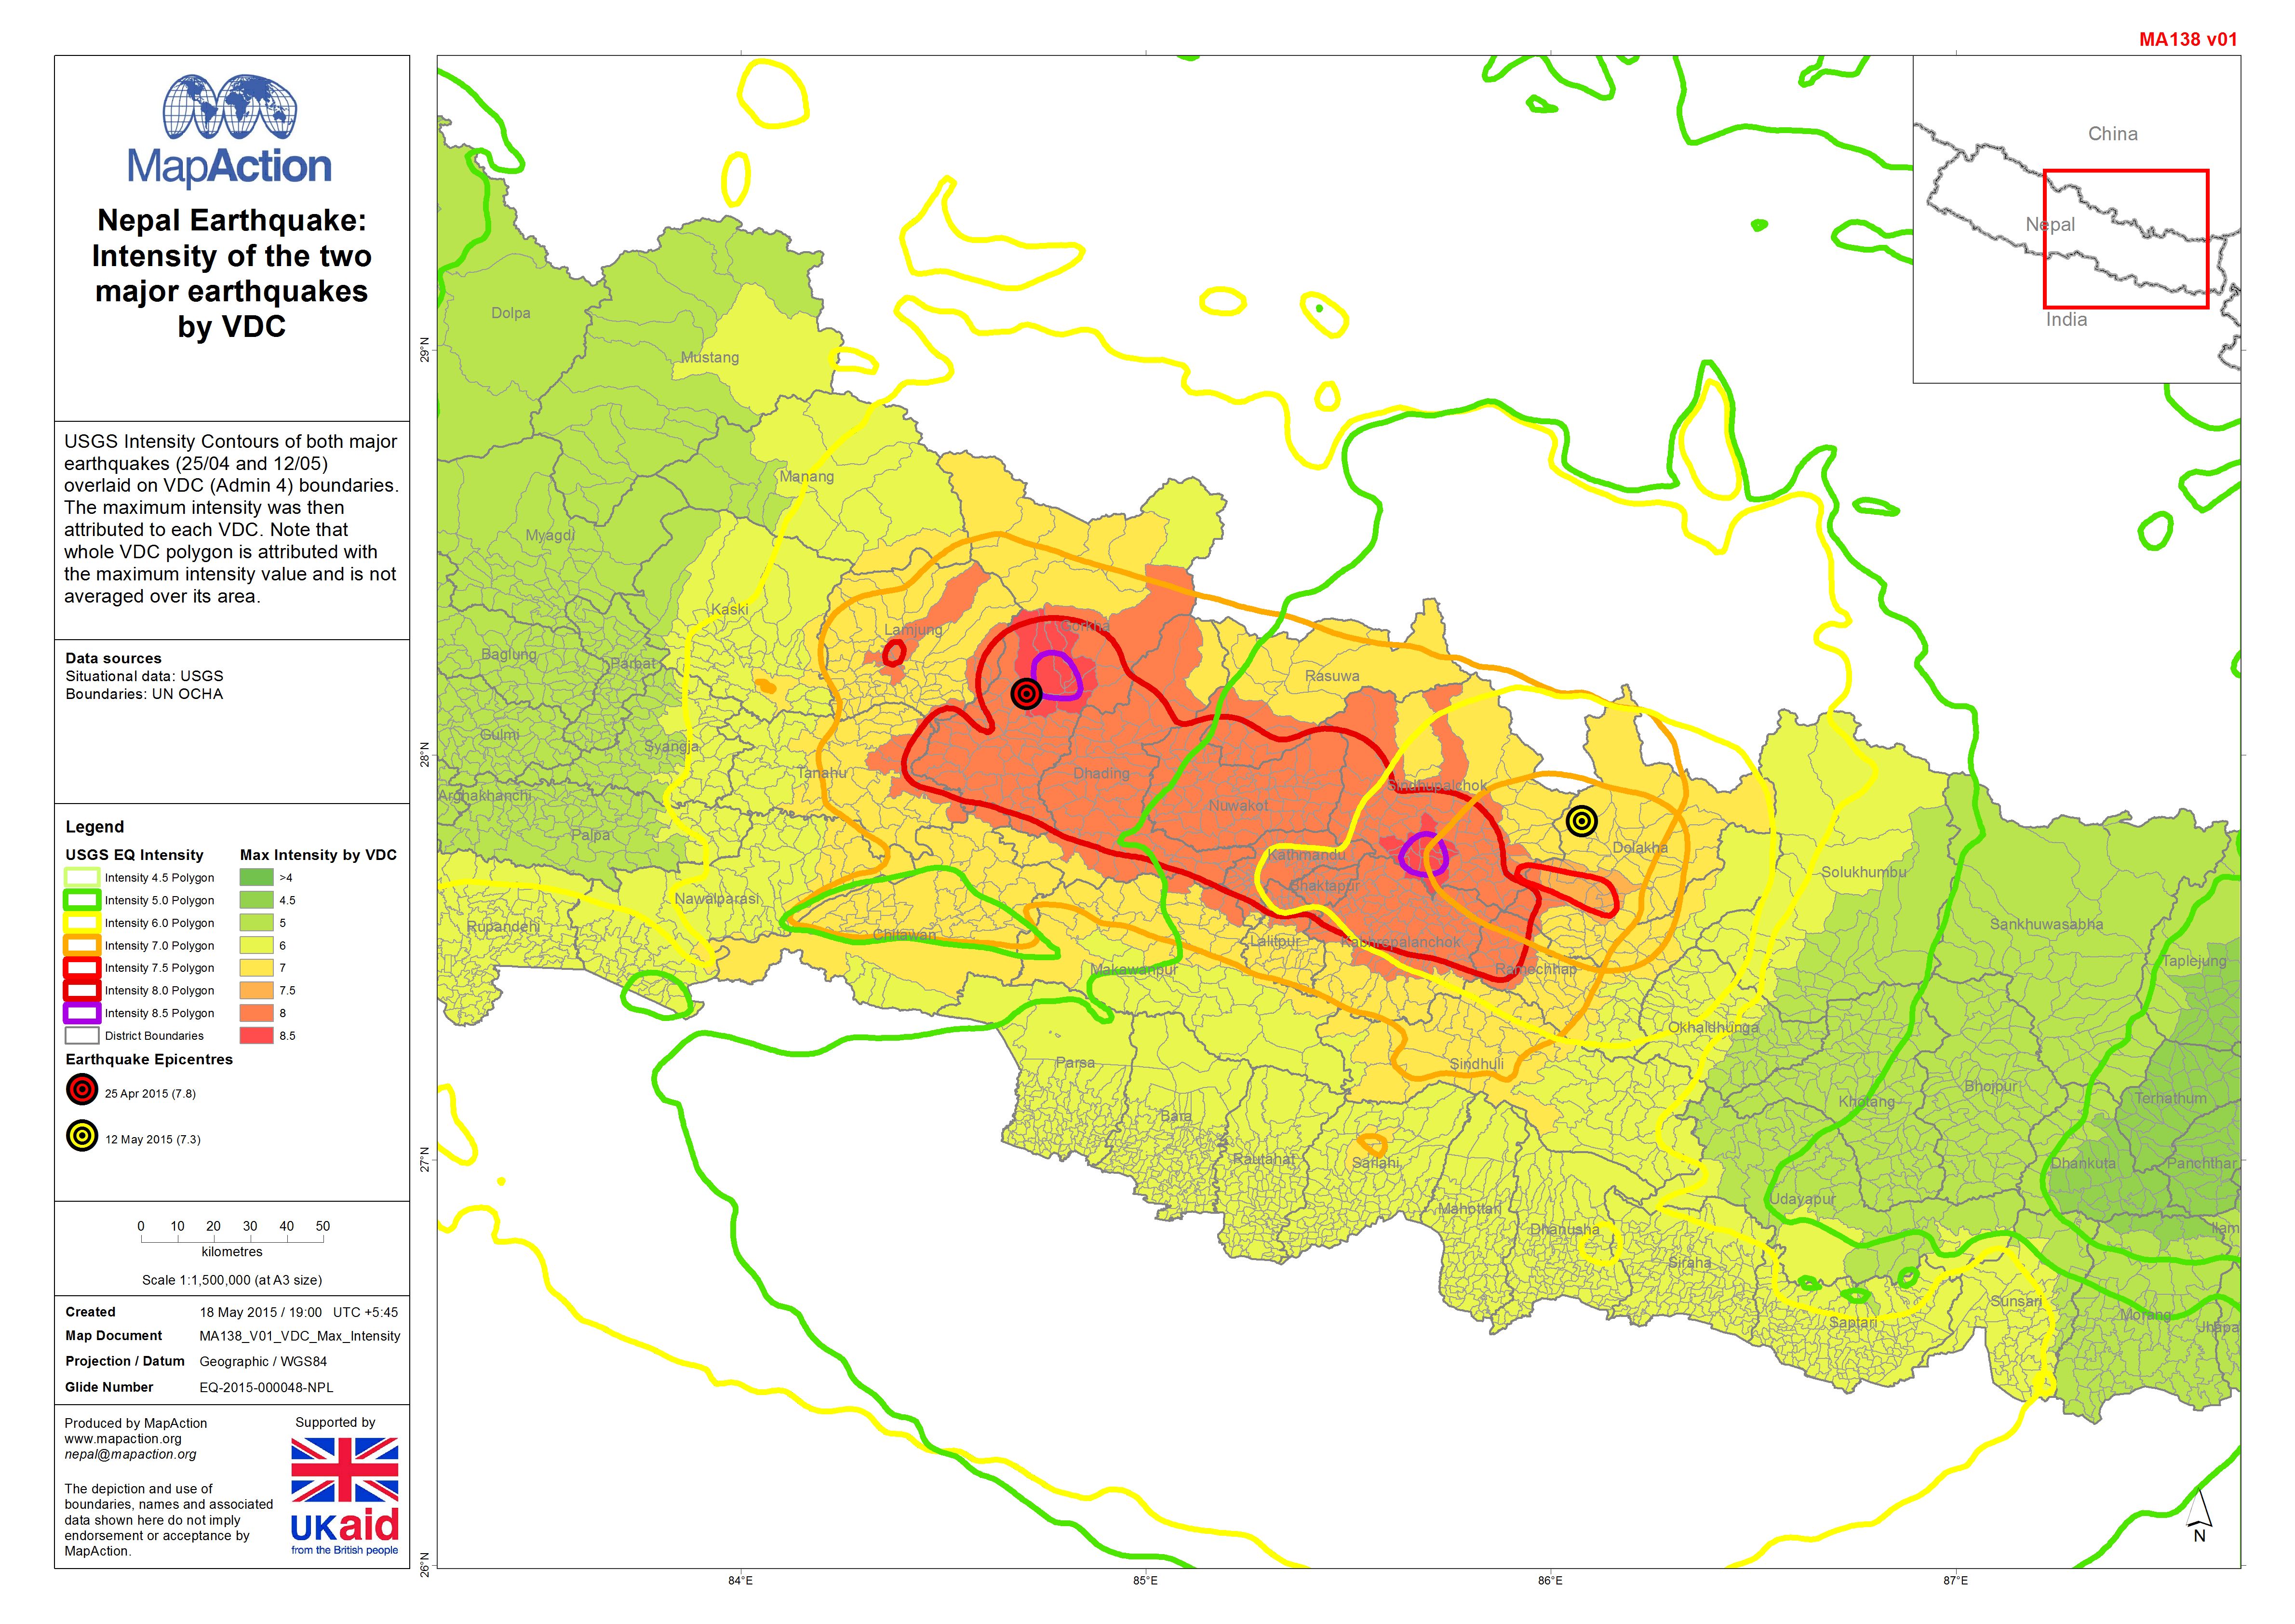
USGS Intensity Contours of both major earthquakes (25/04 and 12/05) overlaid on VDC (Admin 4) boundaries. The maximum intensity was then attributed to each VDC. Note that whole...
-

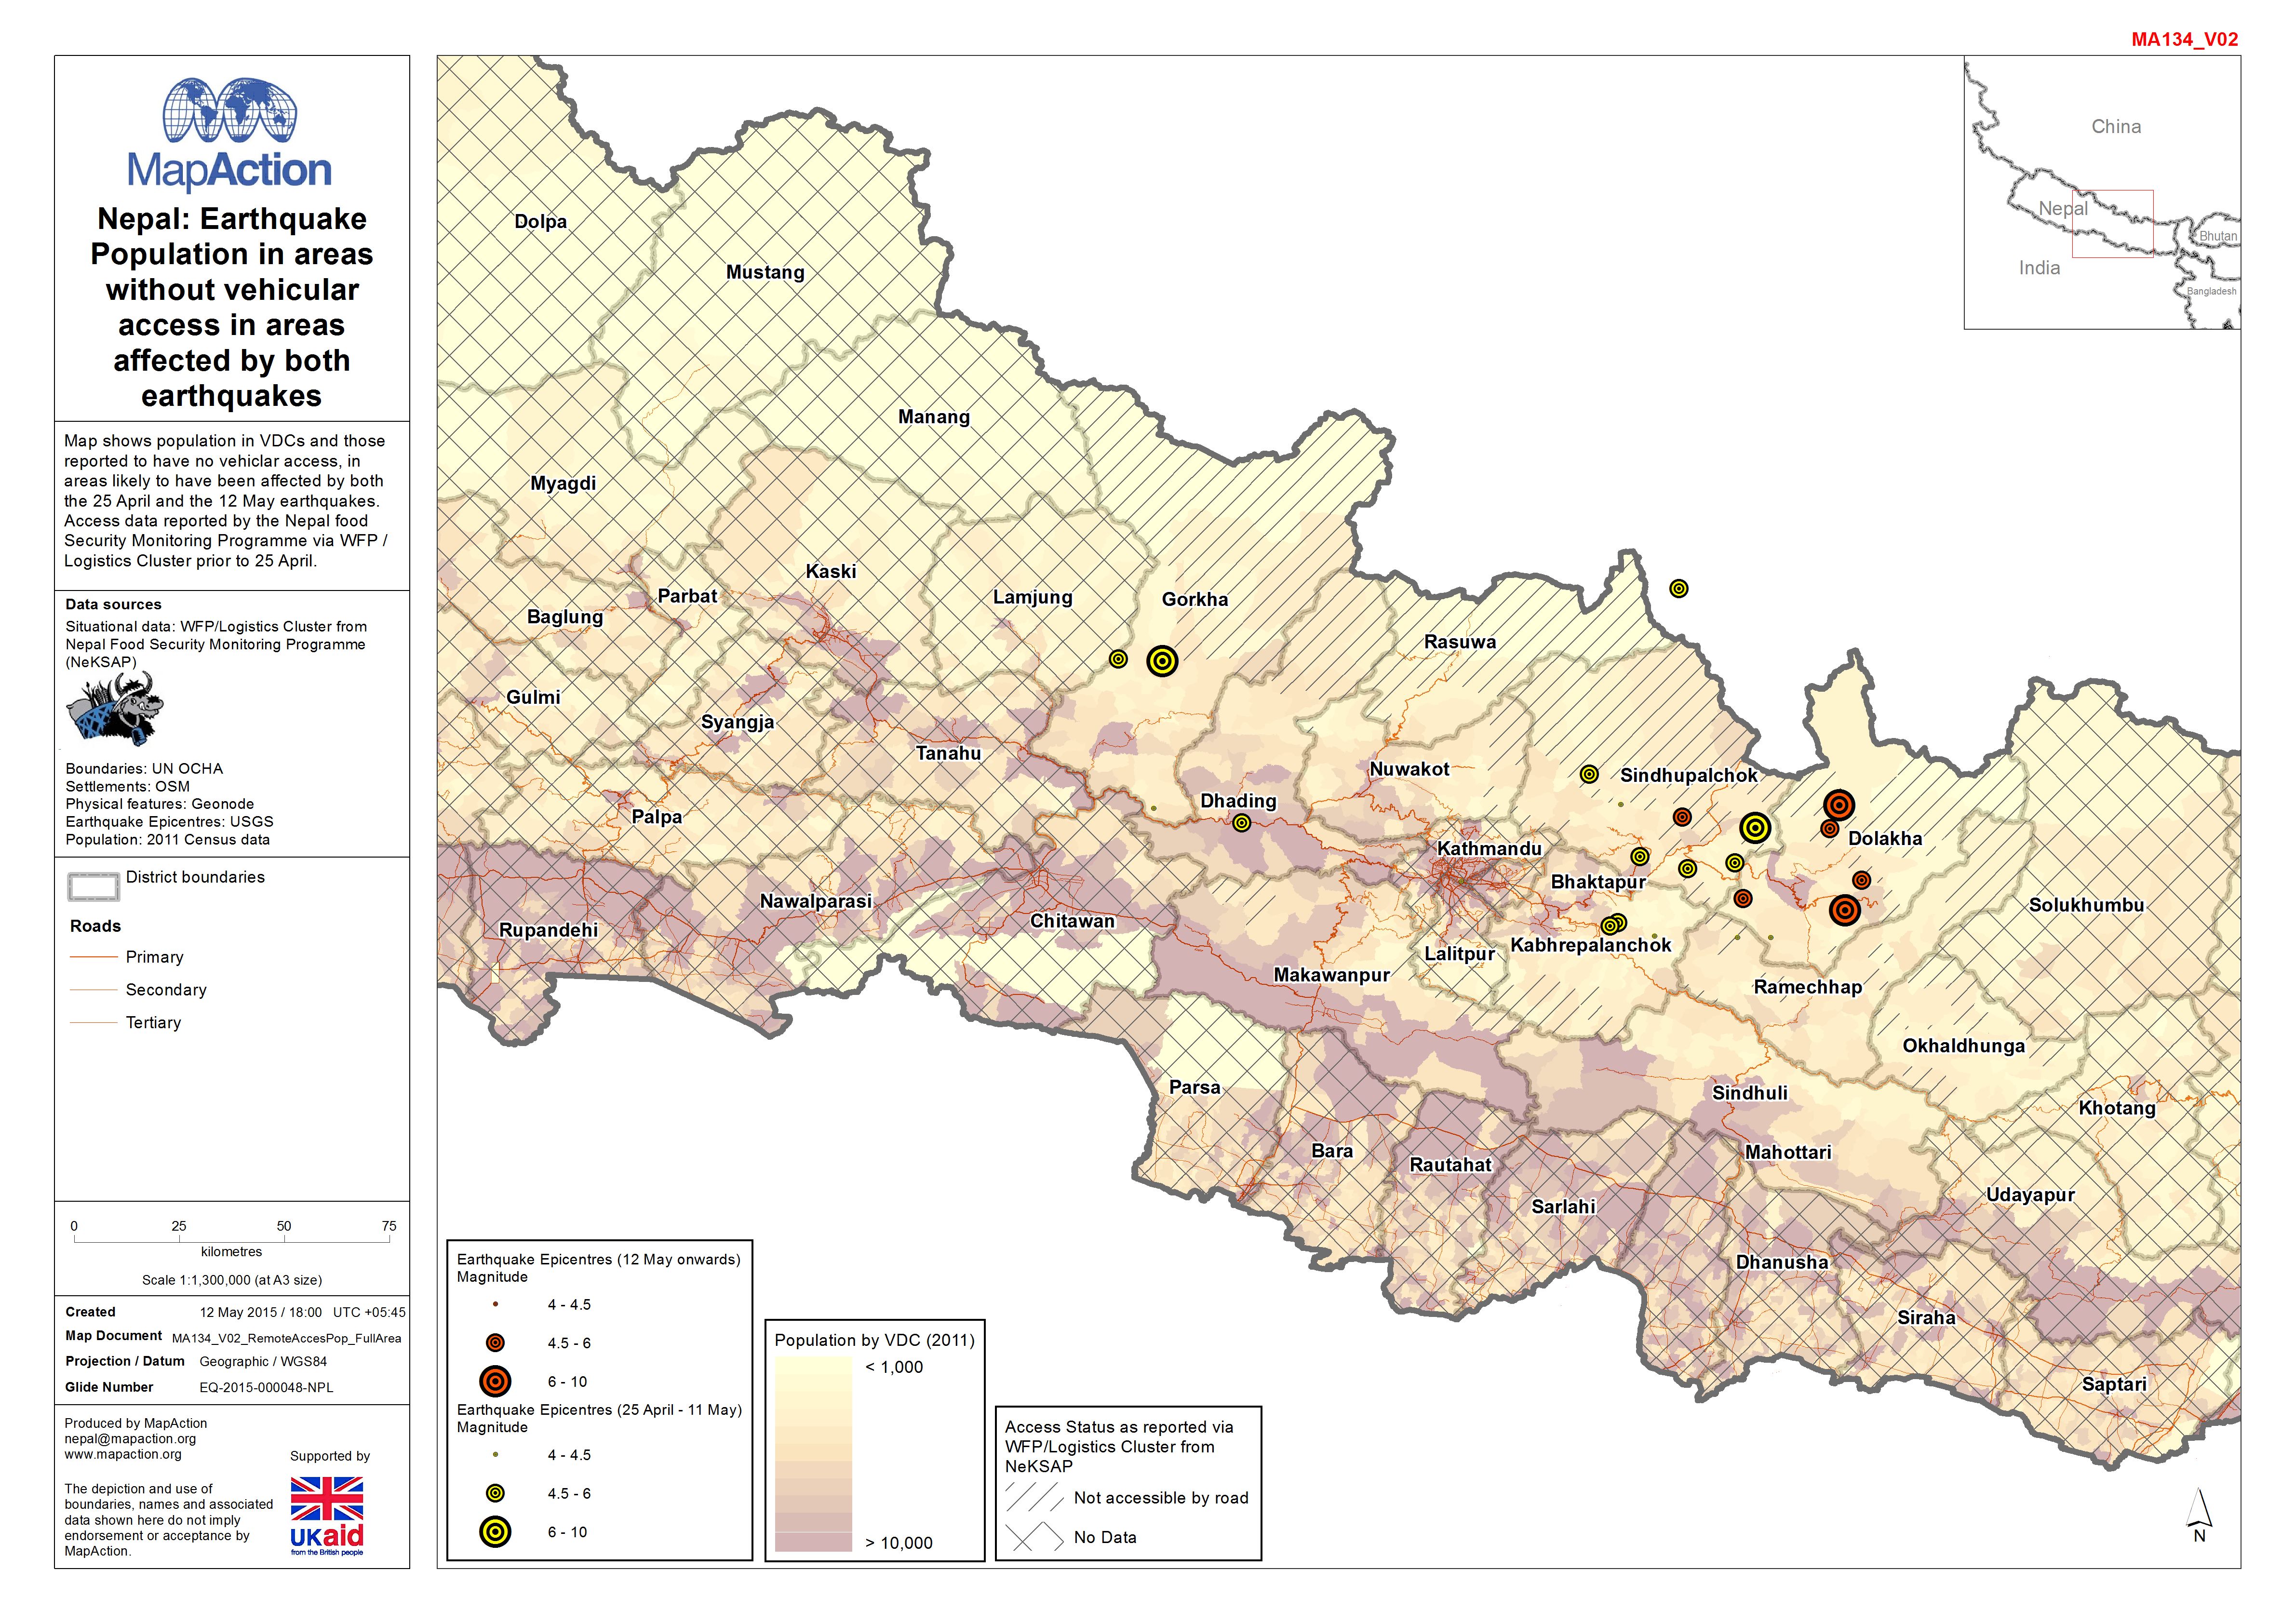
Map shows population in VDCs and those reported to have no vehiclar access, in areas likely to have been affected by both the 25 April and the 12 May earthquakes. Access data...
-

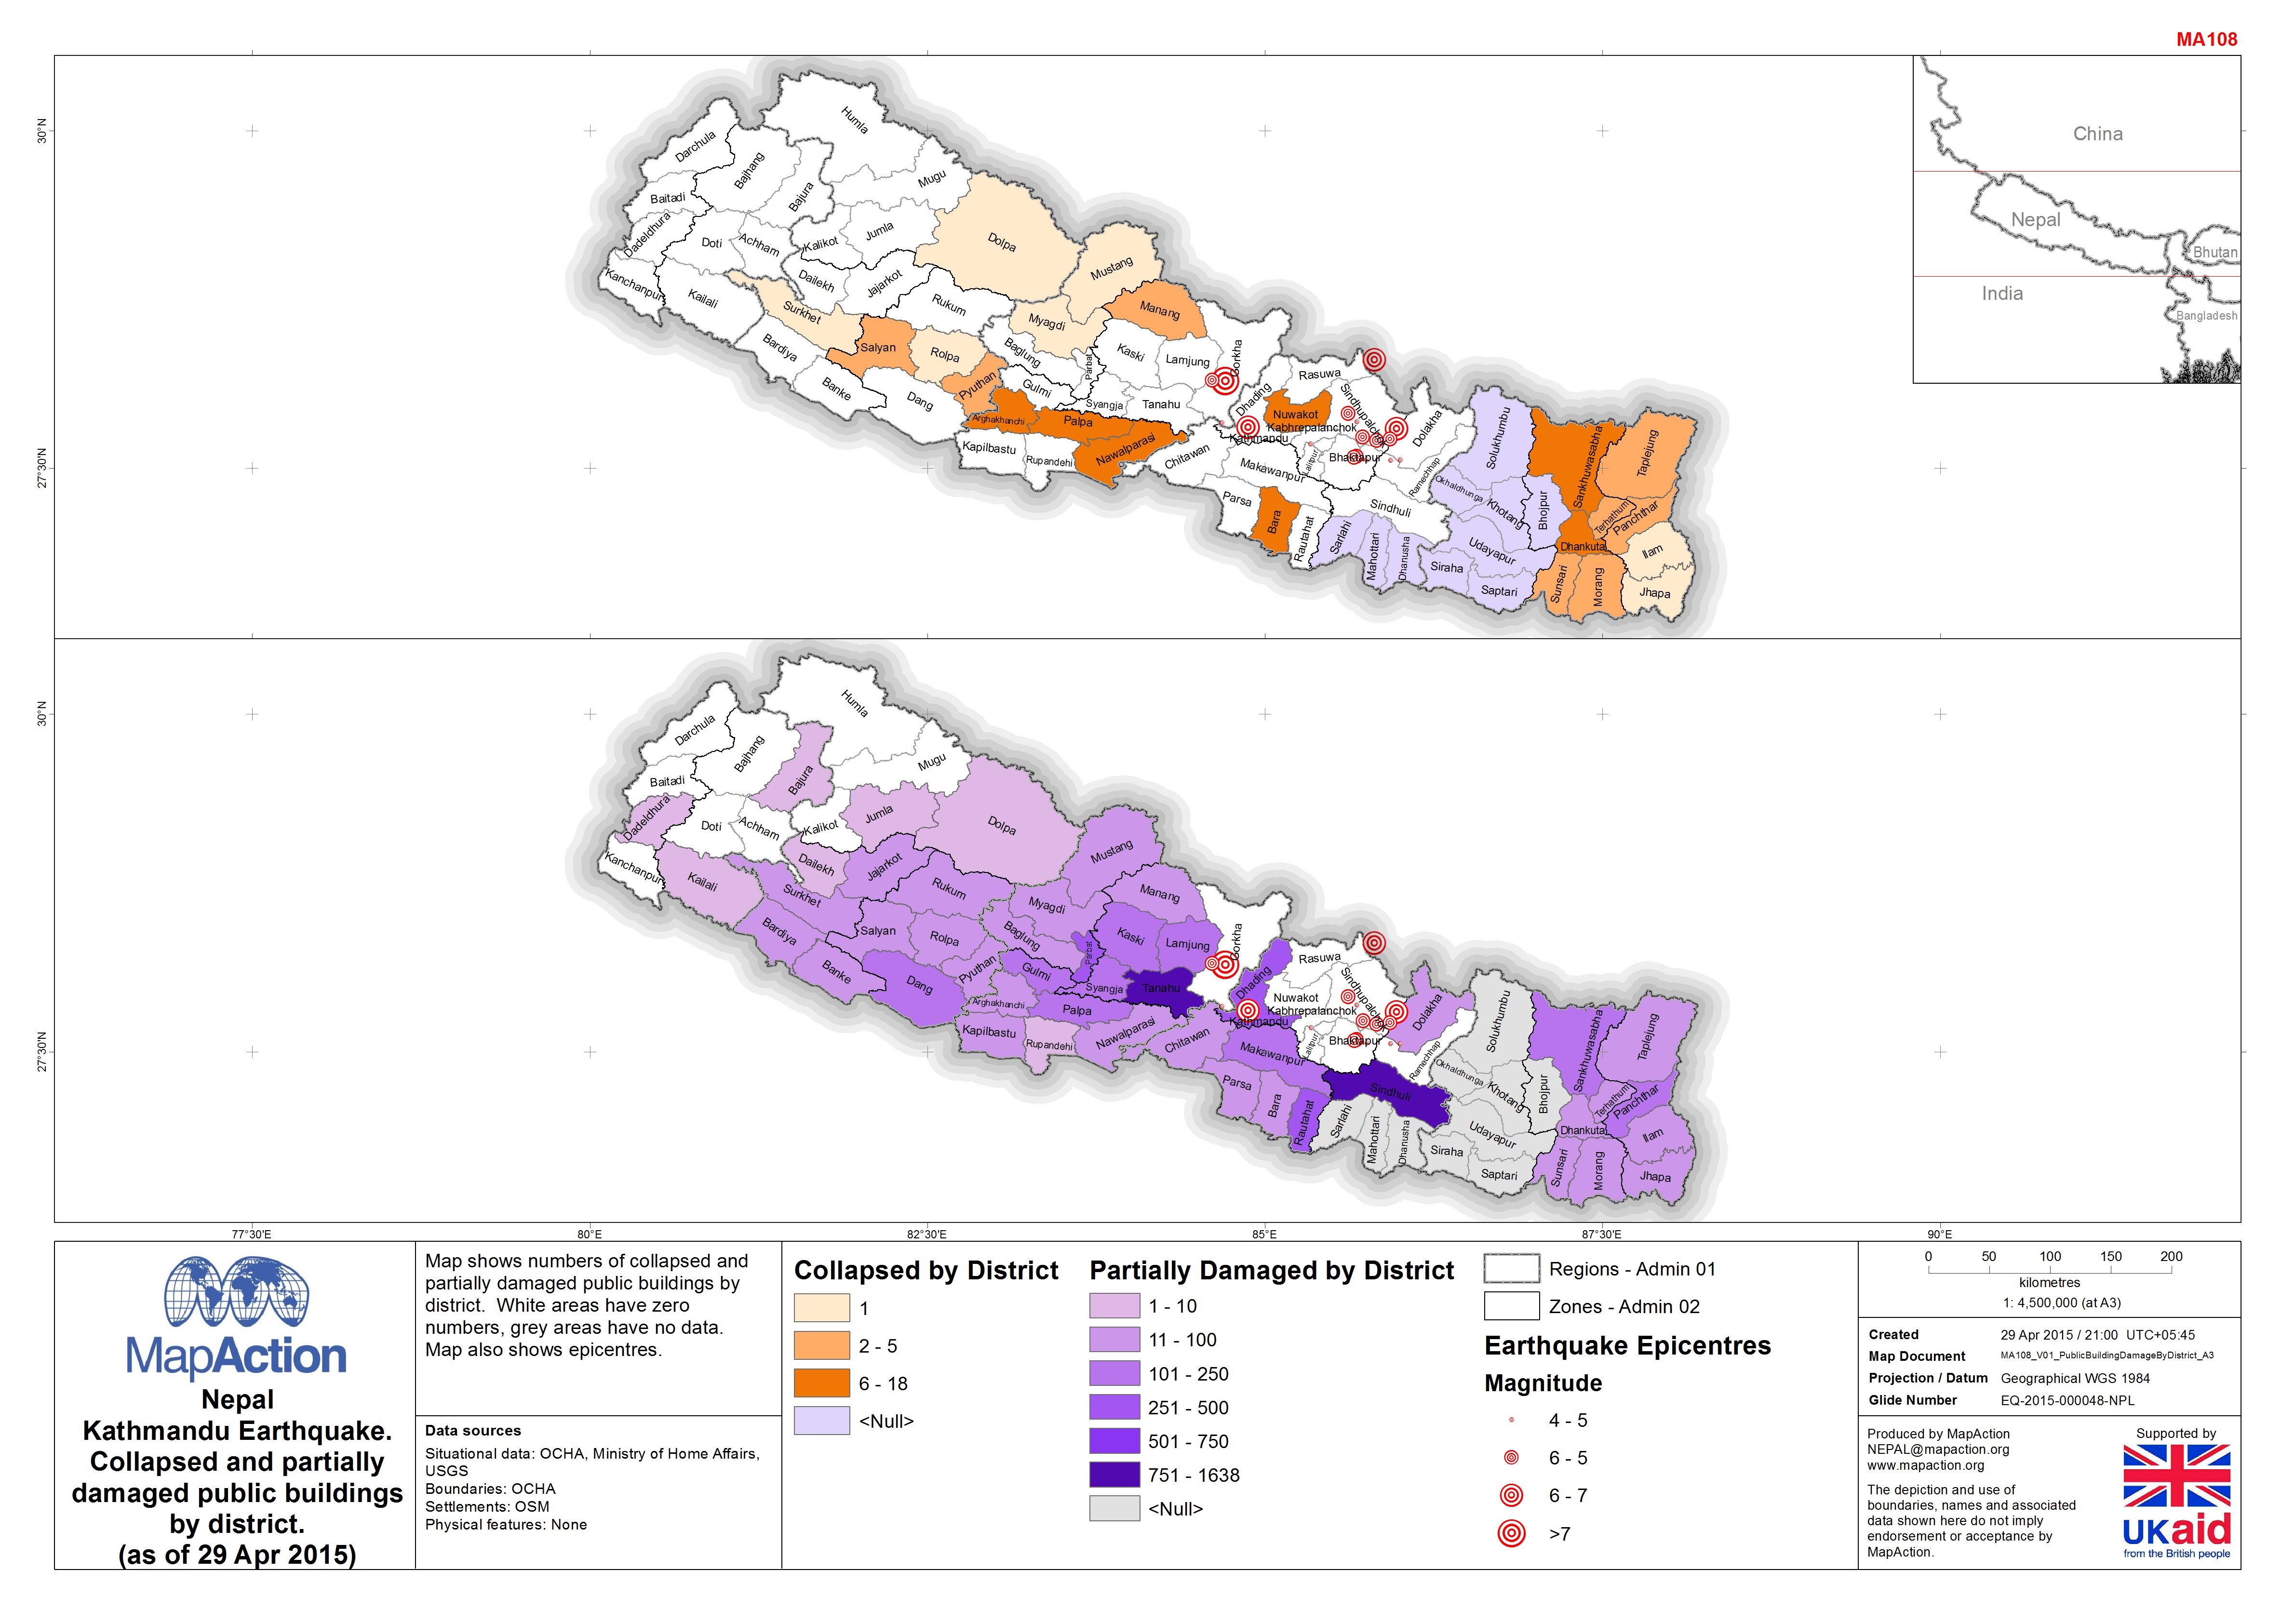
Map shows numbers of collapsed and partially damaged public buildings by district. White areas have zero numbers, grey areas have no data. Map also shows earthquake epicentre.