-

-
-

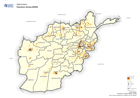
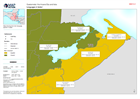
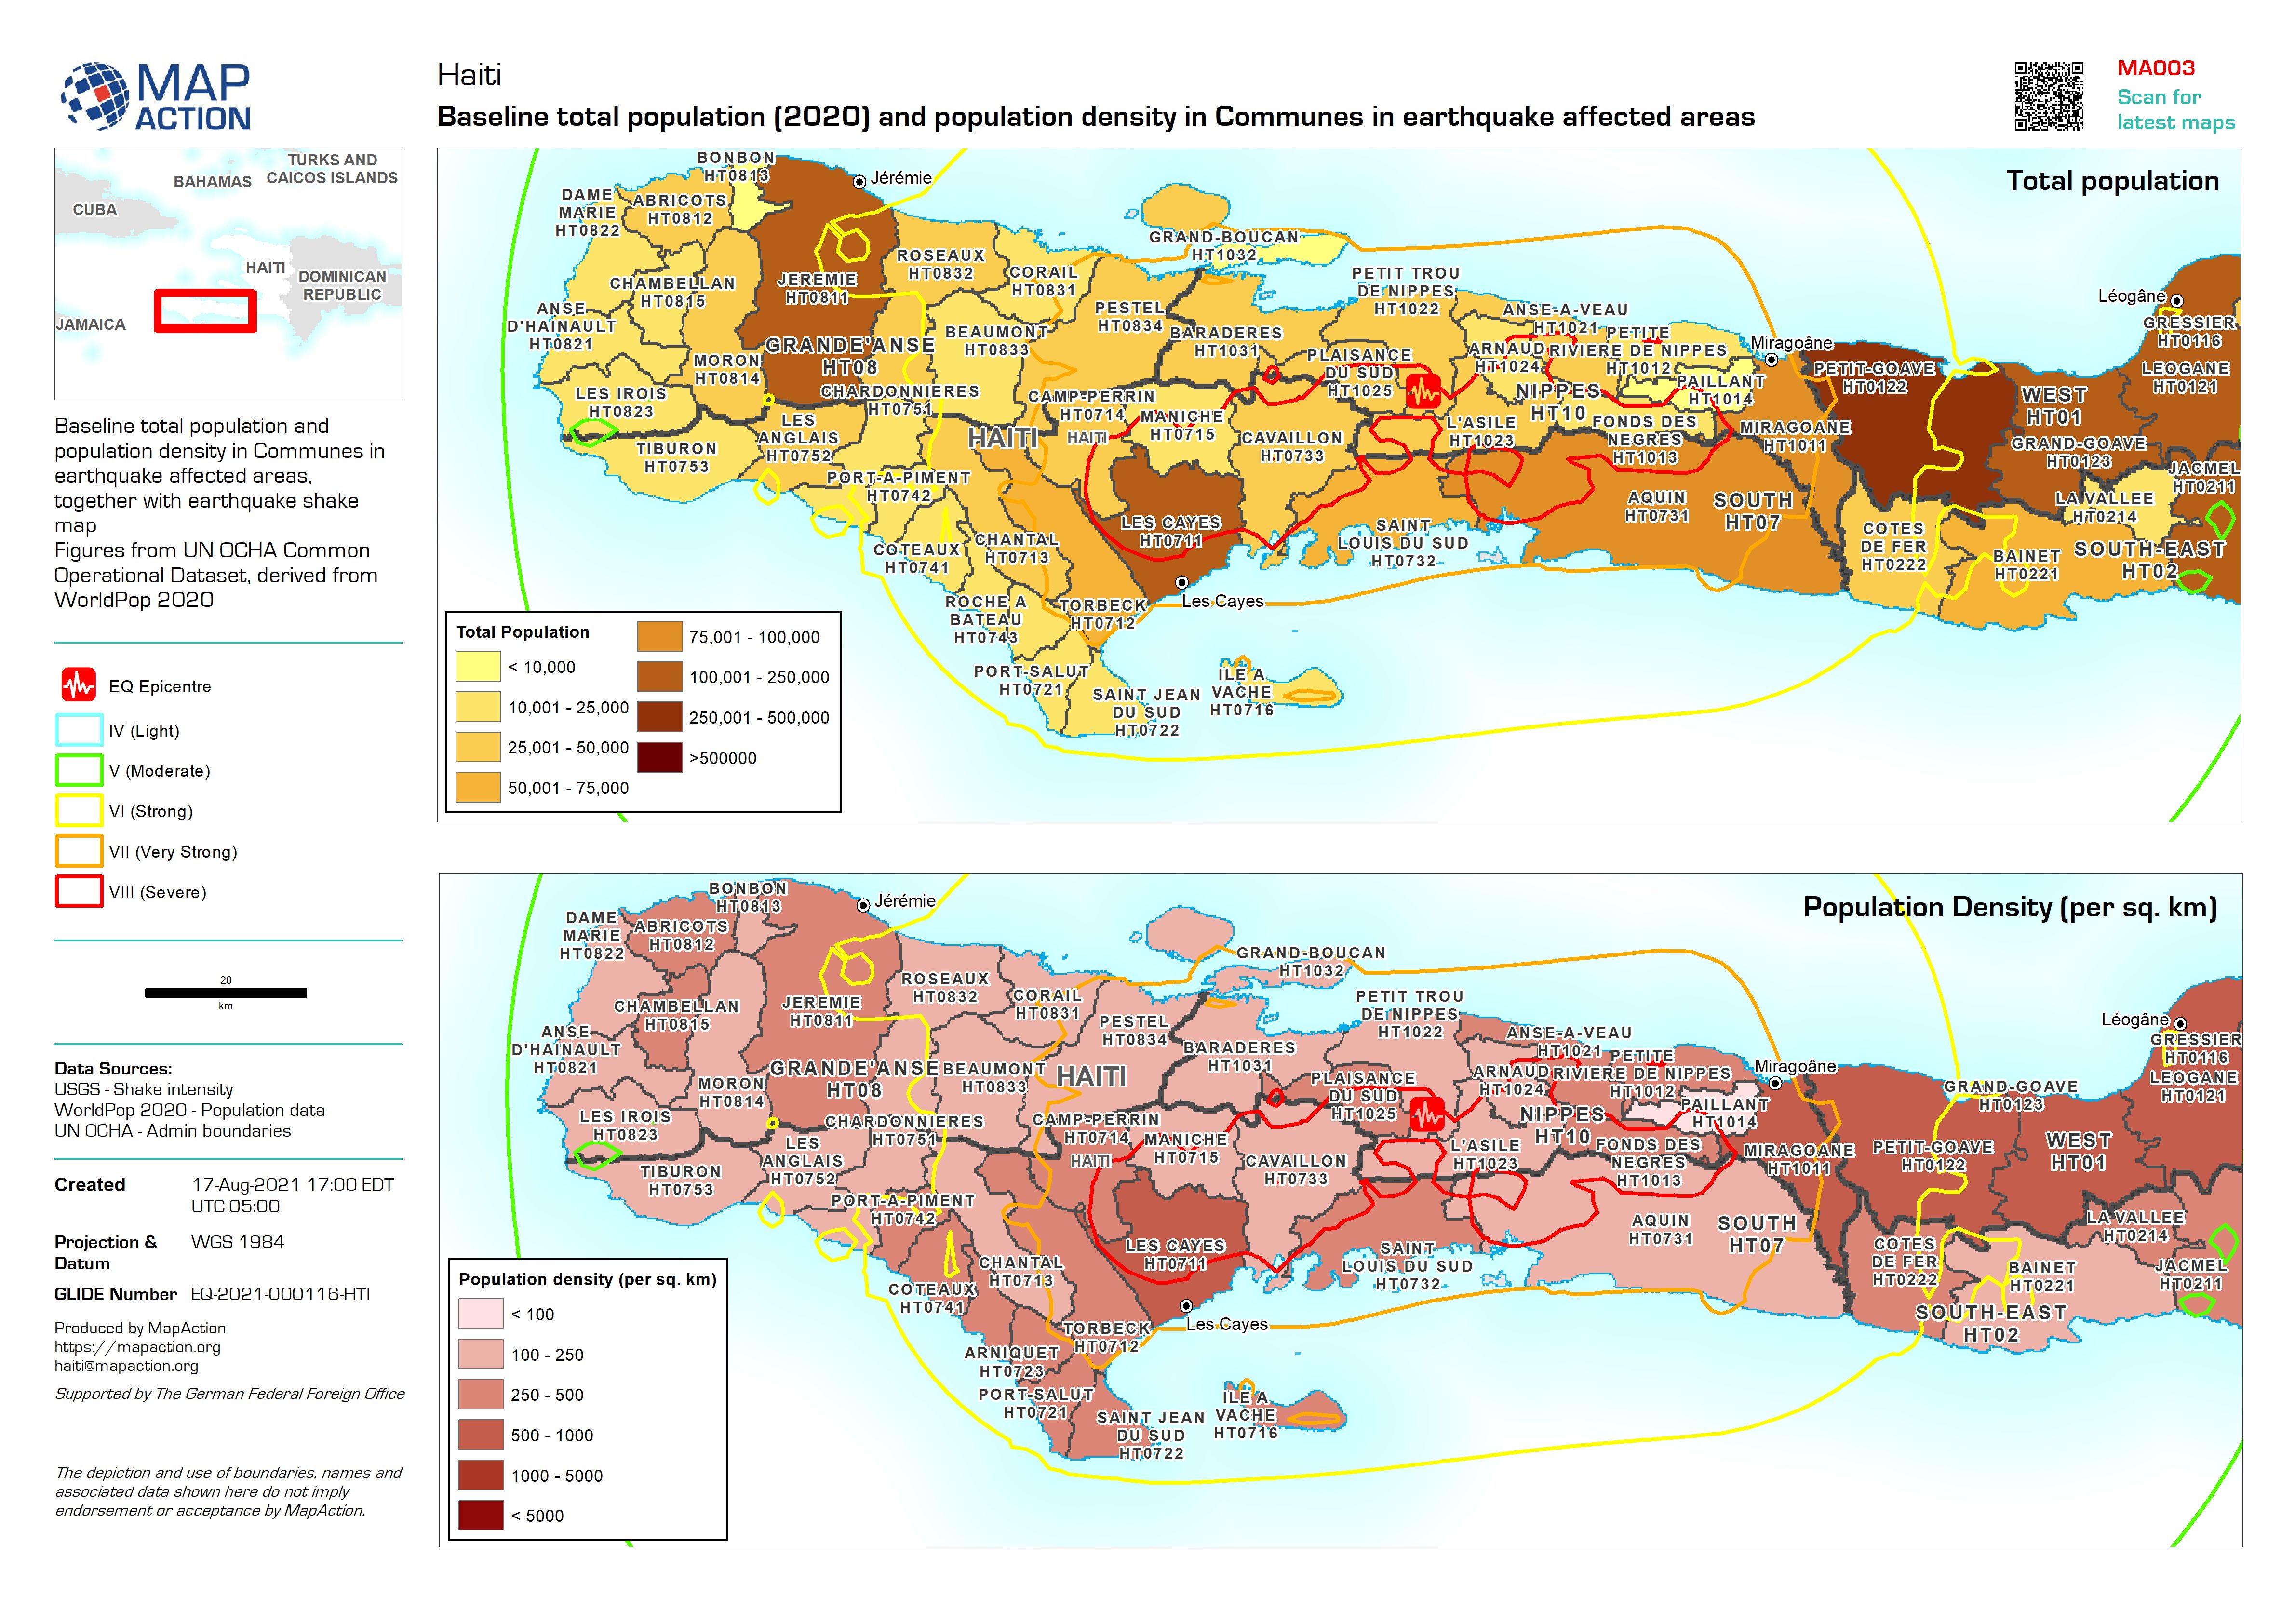
Baseline total population (2020) and population density in Communes in earthq...
Baseline total population and population density in Communes in earthquake affected areas, together with earthquake shake map. Figures from UN OCHA Common Operational Dataset,... -

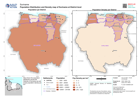
Population Distribution, Density, Households affected and Humanitarian Assist...
Map shows the population distribution across the regions of Guyana as well as the population density per km2. The left map shows the affected households per regions while the... -

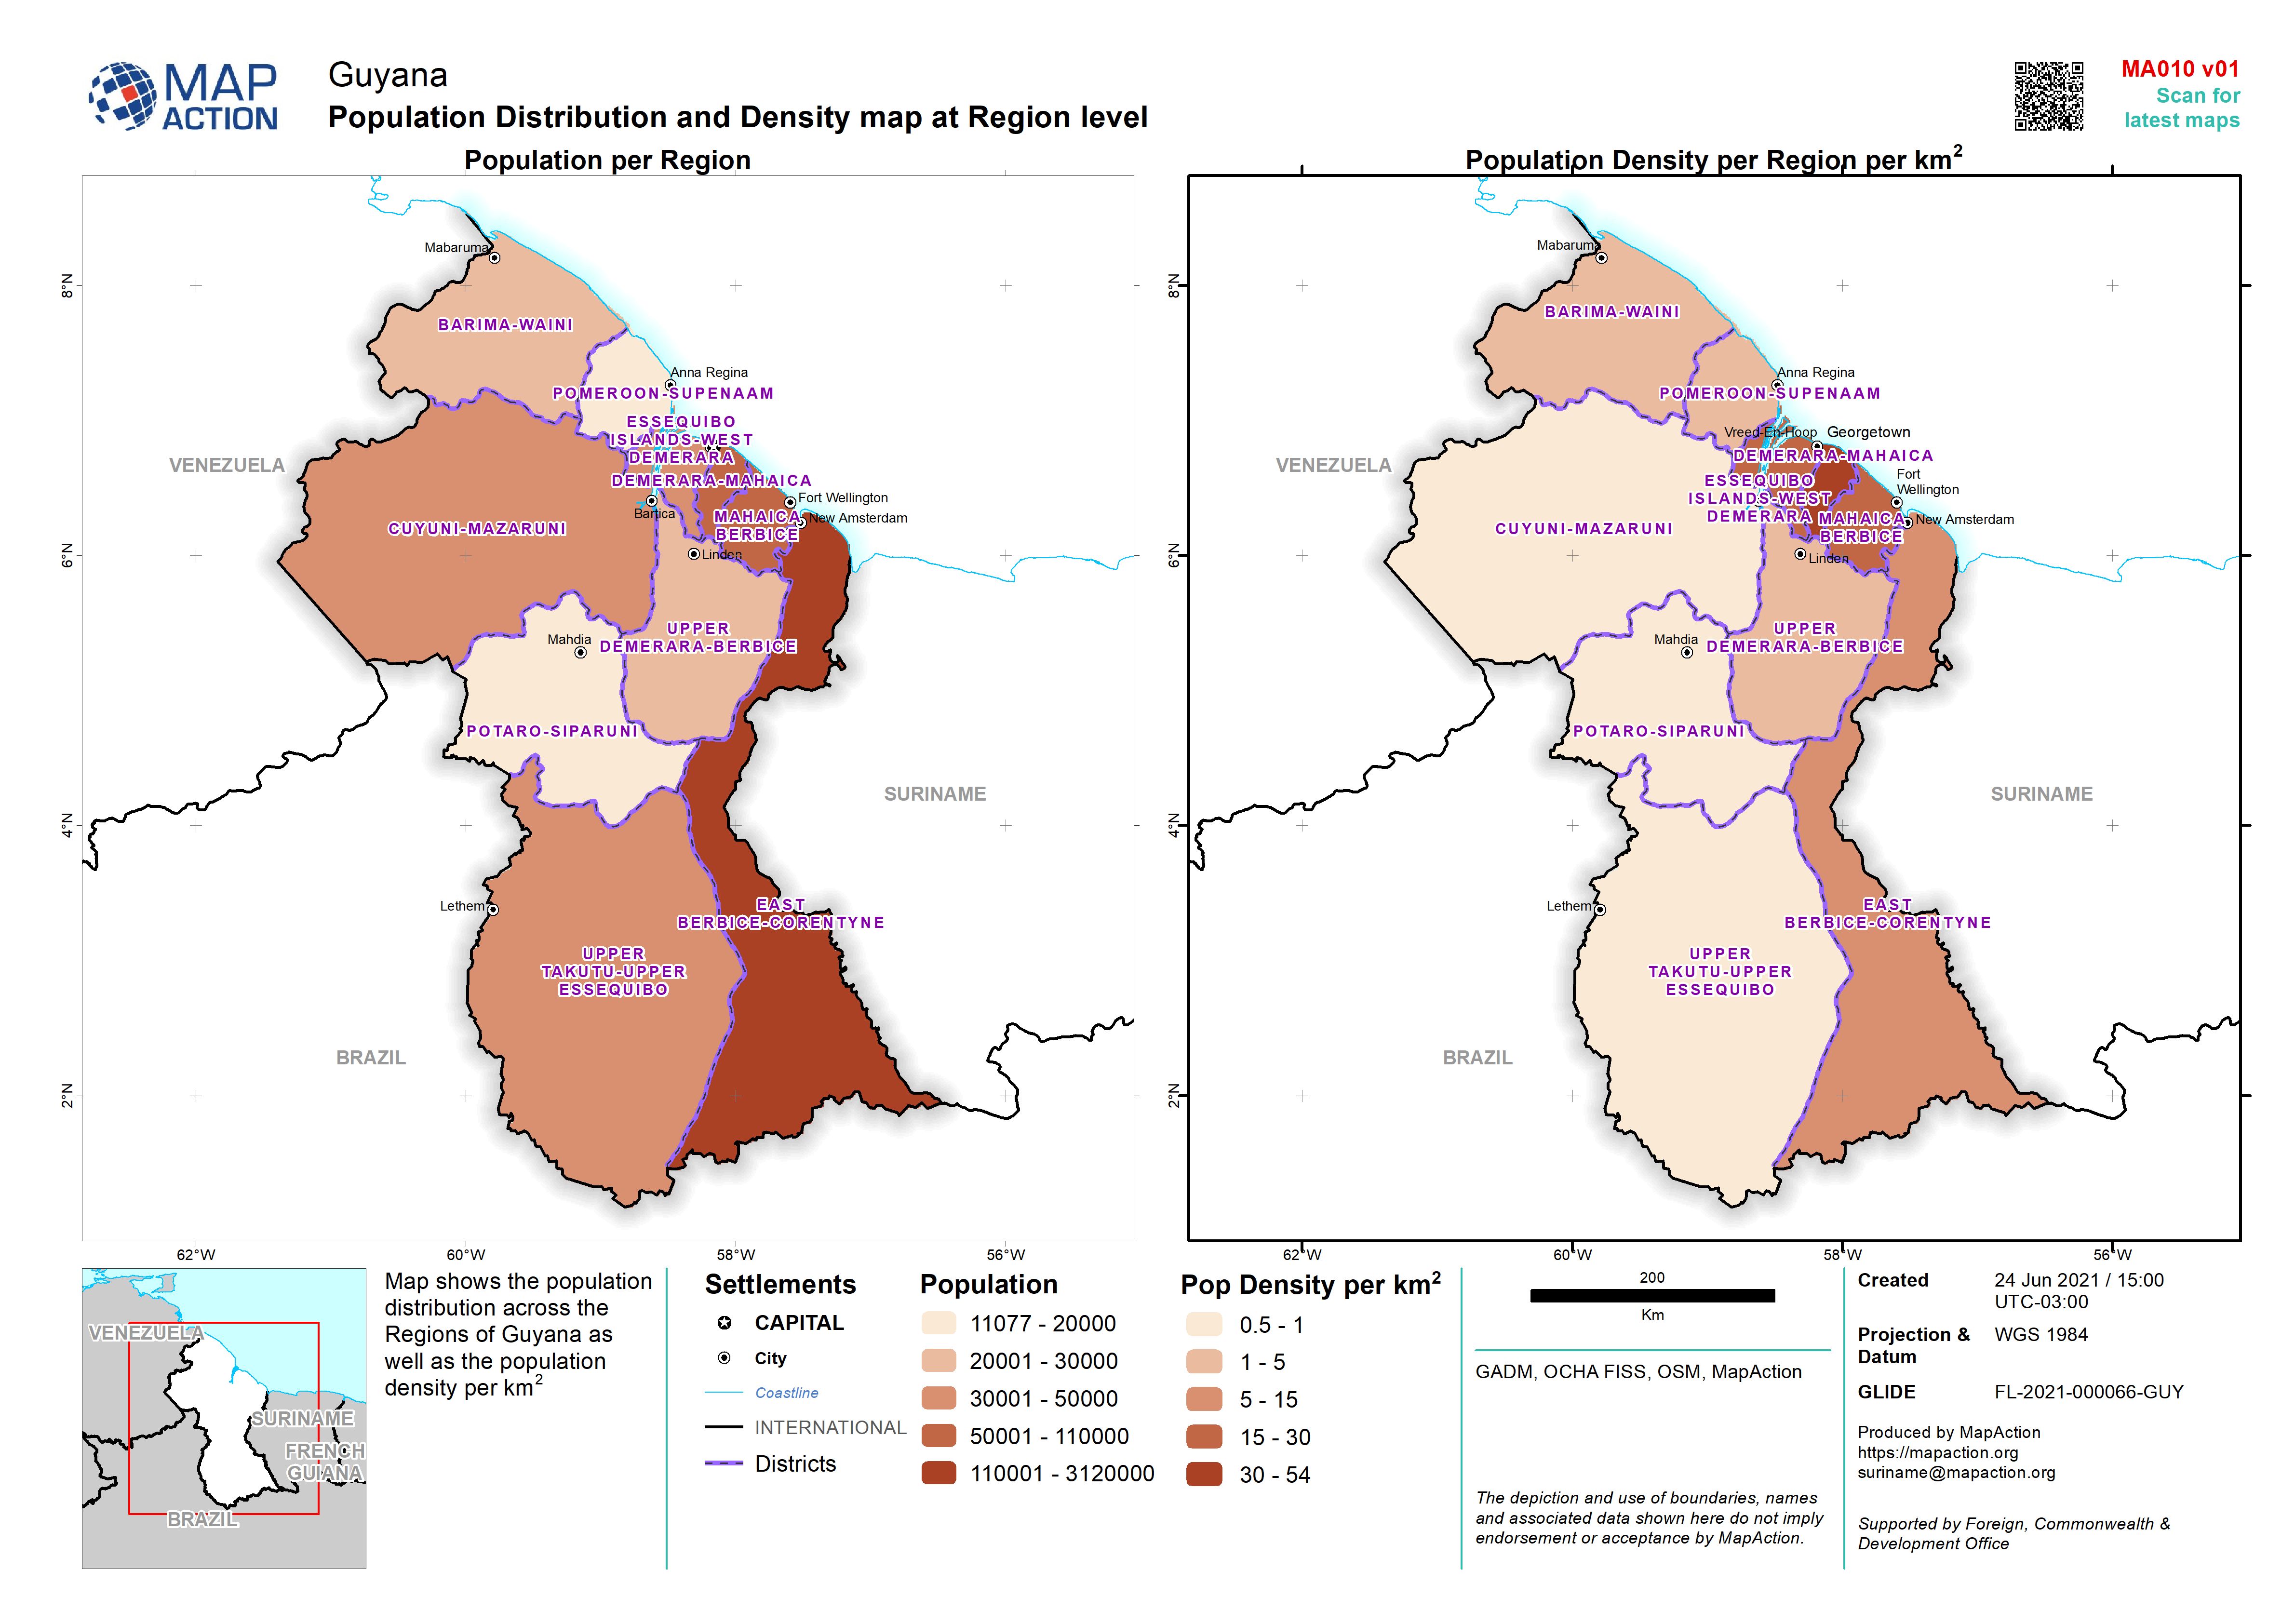
Population Distribution and Density map at Region level
Map shows the population distribution across the Regions of Guyana as well as the population density per km2 -
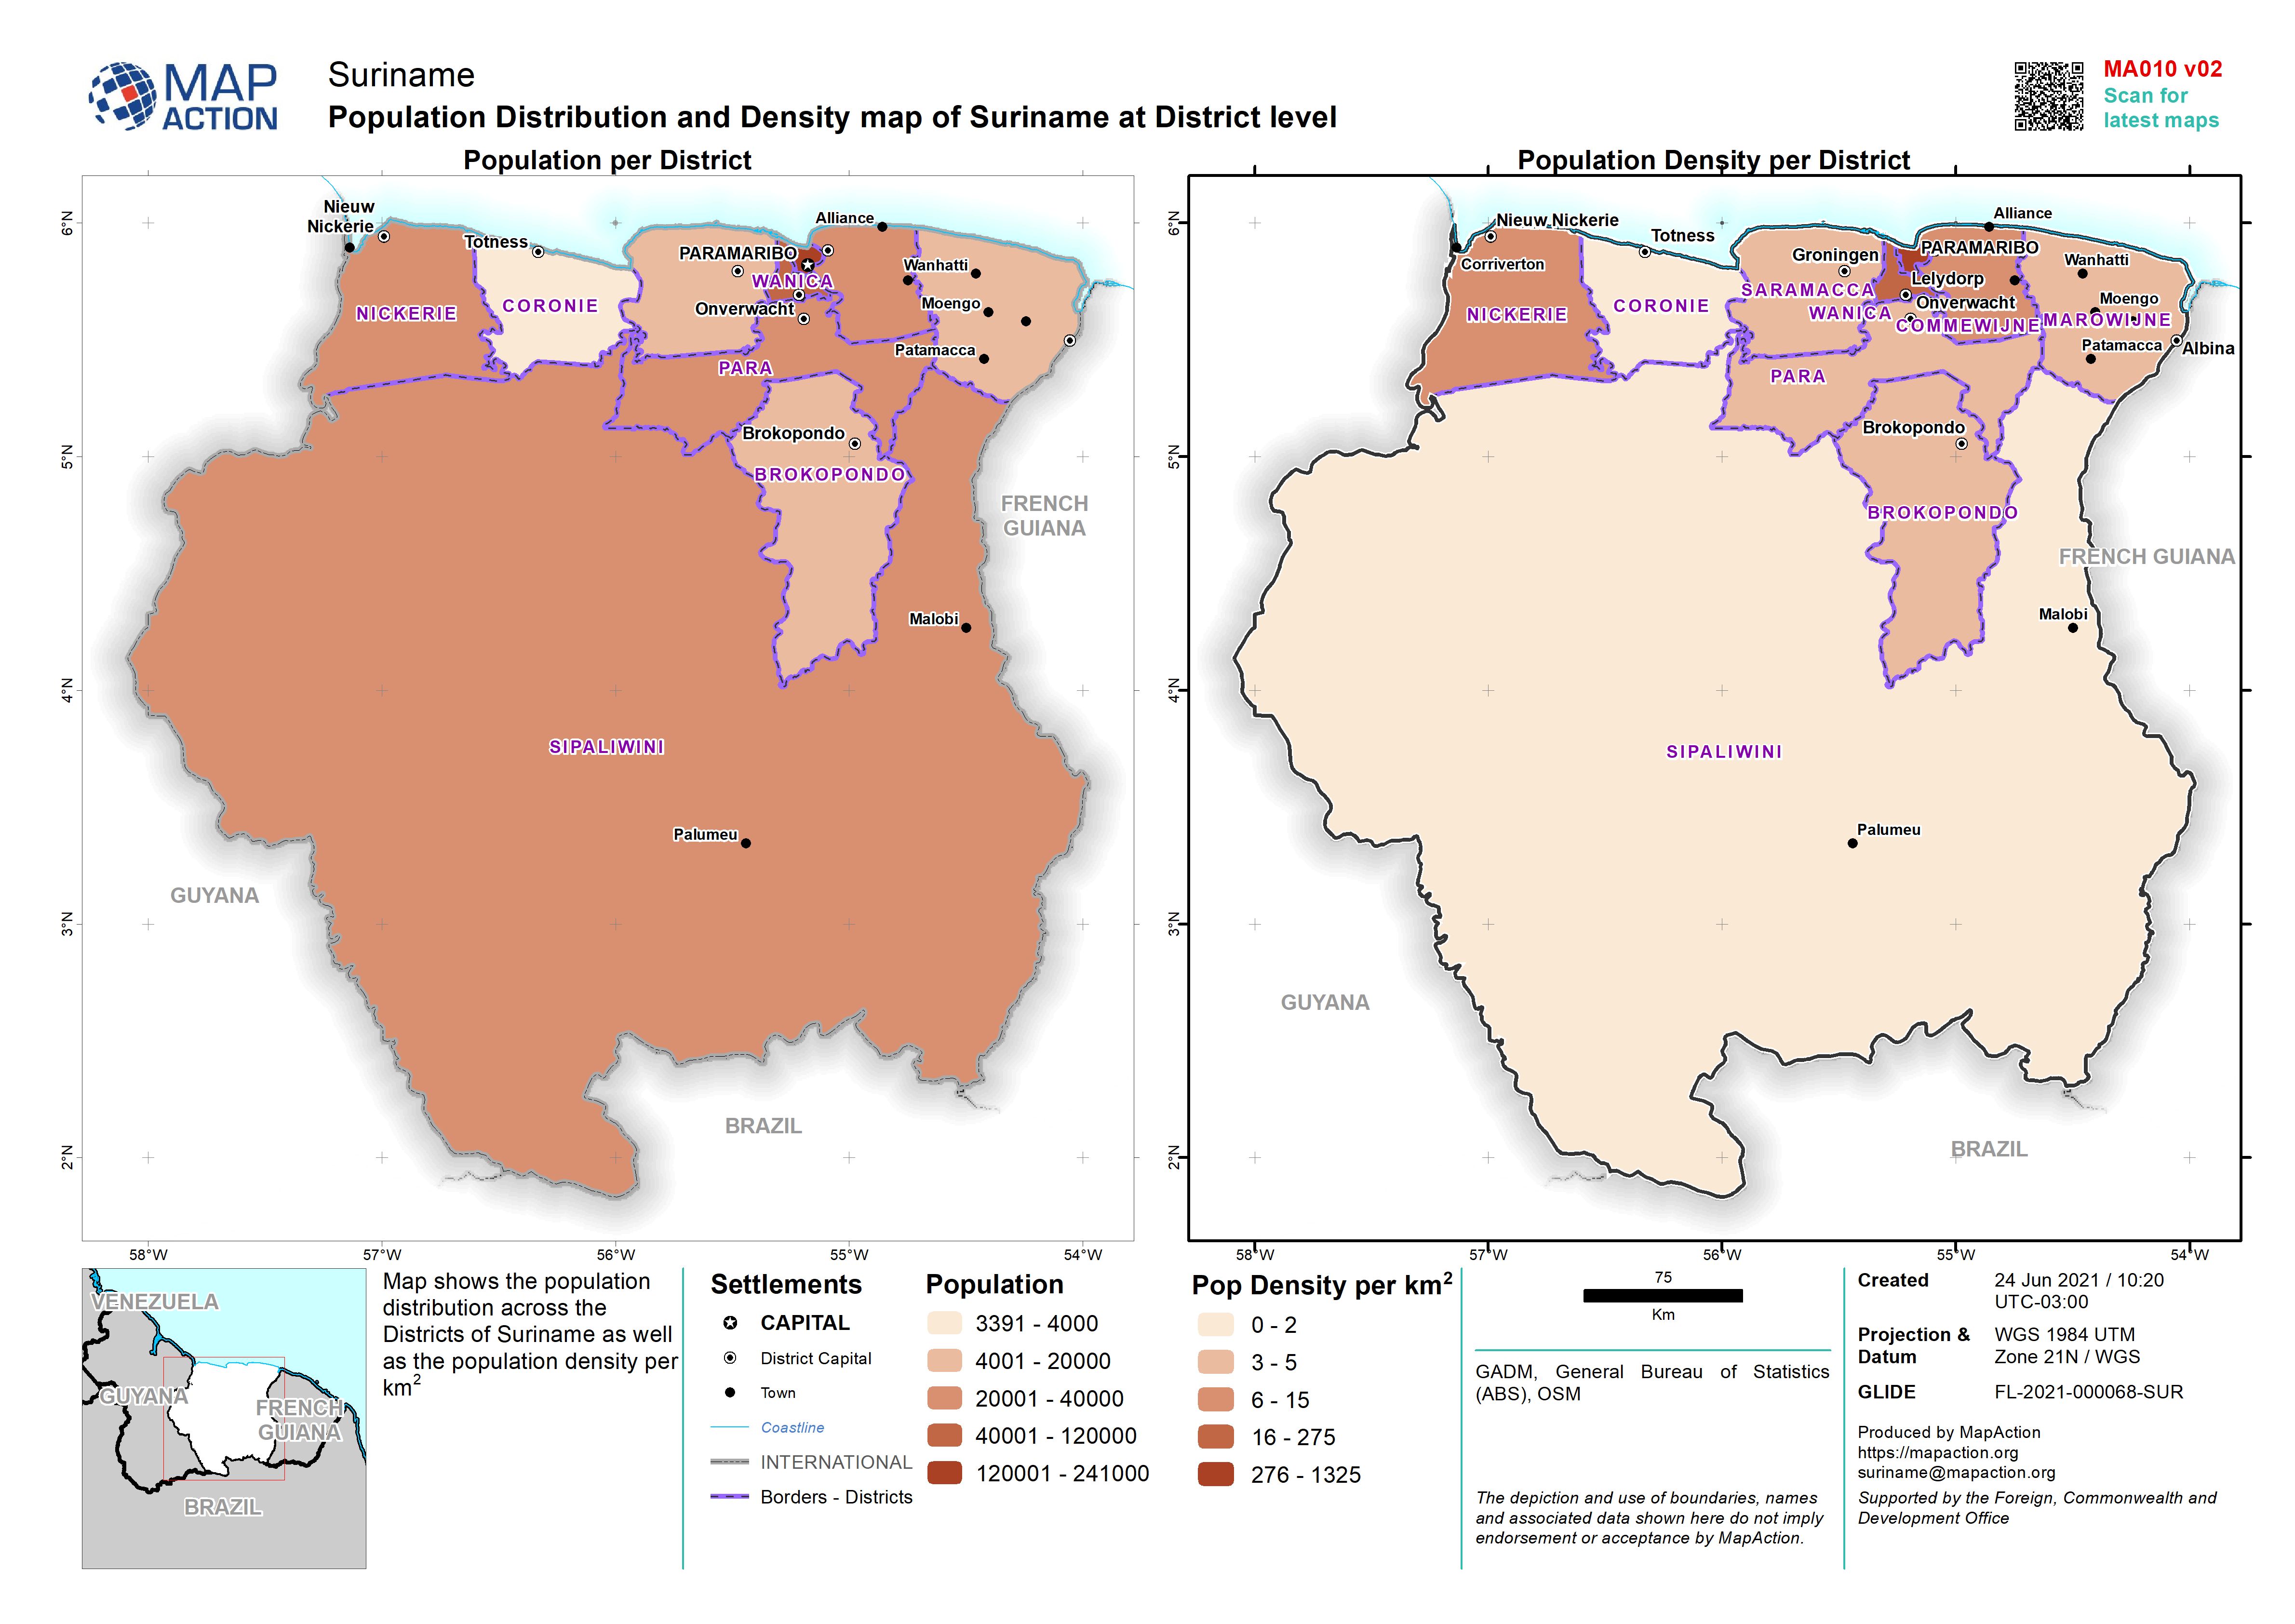
Population Distribution and Density map of Suriname at District level
Map shows the population distribution across the Districts of Suriname as well as the population density per km2 -

Population Distribution and Density map of Suriname at District level
Map shows the population distribution across the Districts of Suriname as well as the population density per km2 -
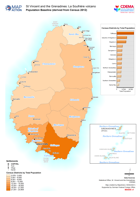
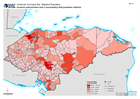
Population Baseline (derived from Census 2012)
Map shows population by census districts. This is on the basis of information obtained from the 2012 Population and Housing Censuses. -

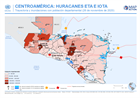
CENTROAMÉRICA: HURACANES ETA E IOTA - Honduras y Guatemala: personas afectada...
This map shows the storm tracks and flood extents for hurricane Eta and Iota. Across Honduras and in the two most highly affected departments in Guatemala the map shows affected... -
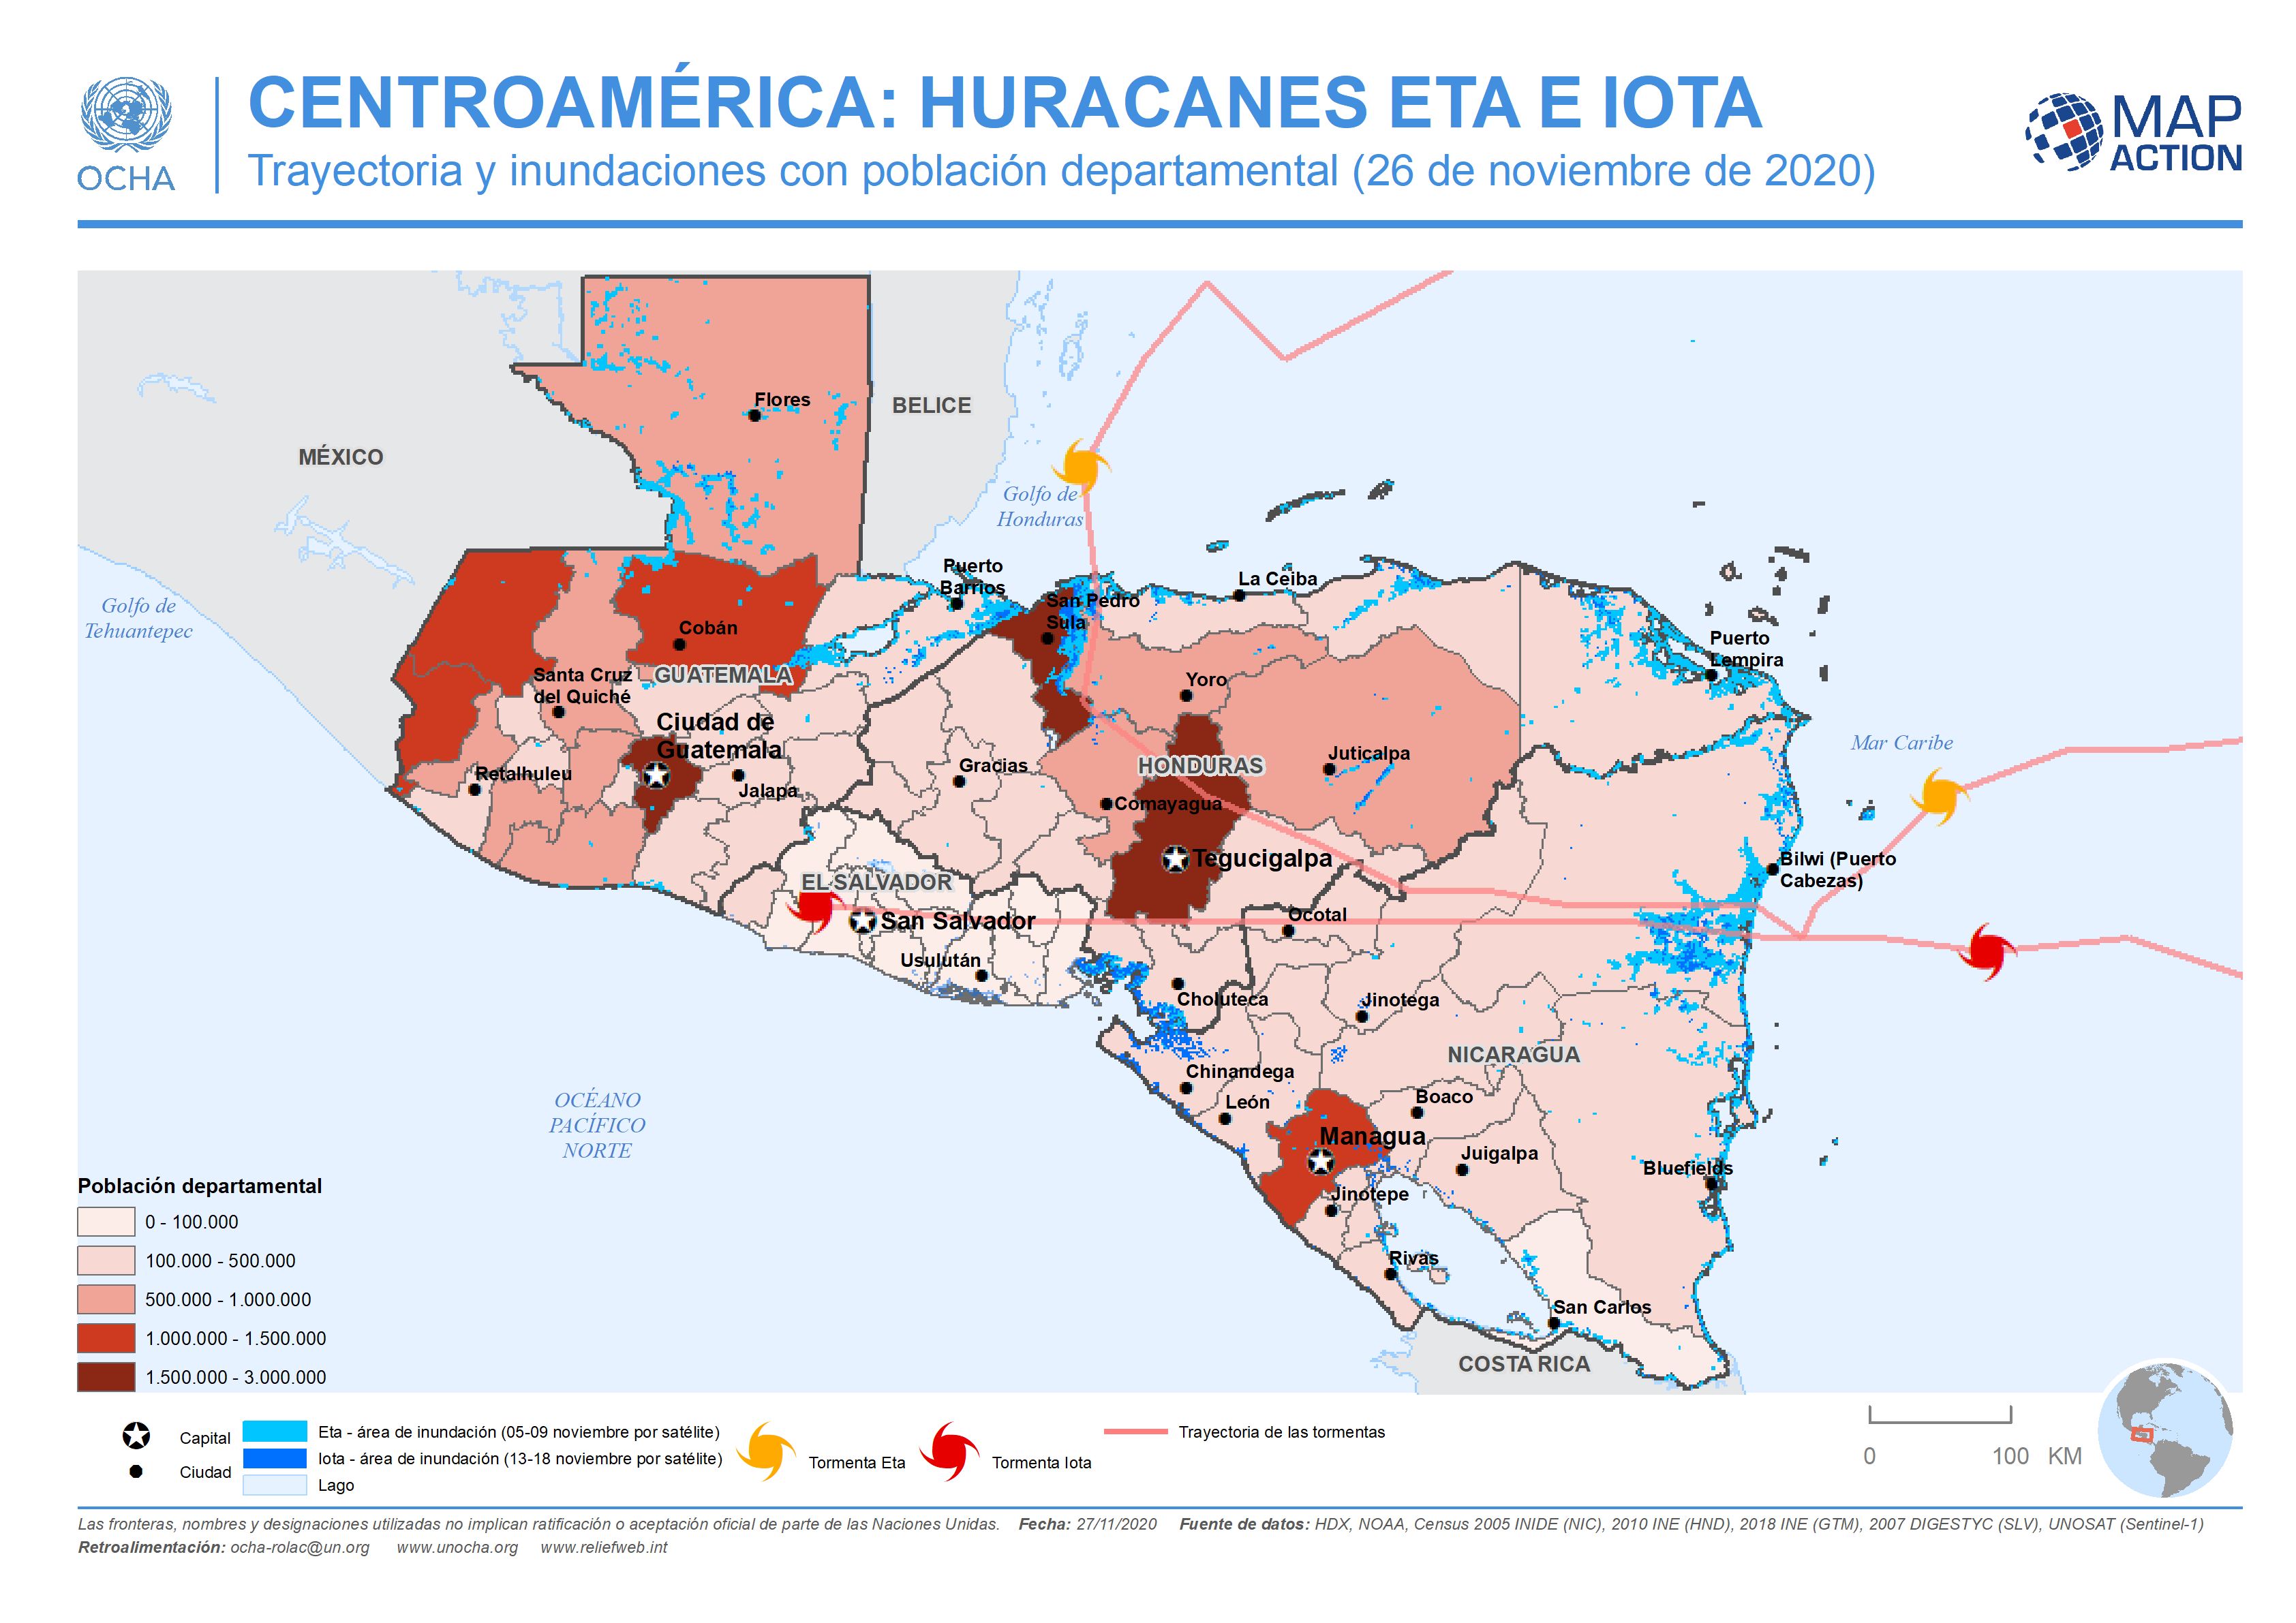
CENTROAMÉRICA: HURACANES ETA E IOTA - Trayectoria y inundaciones con població...
This map shows the storm tracks and flood extents for hurricane Eta and Iota, with baseline administrative 1 level departmental population figures across the affected region... -

CENTROAMÉRICA: HURACÁN IOTA - Trayectoria potencial y poblaciones departament...
This map shows the potentially affected administration level 1 departments, with departmental population for Nicaragua and Honduras, and the predicted hurricane path cone. -
-

-

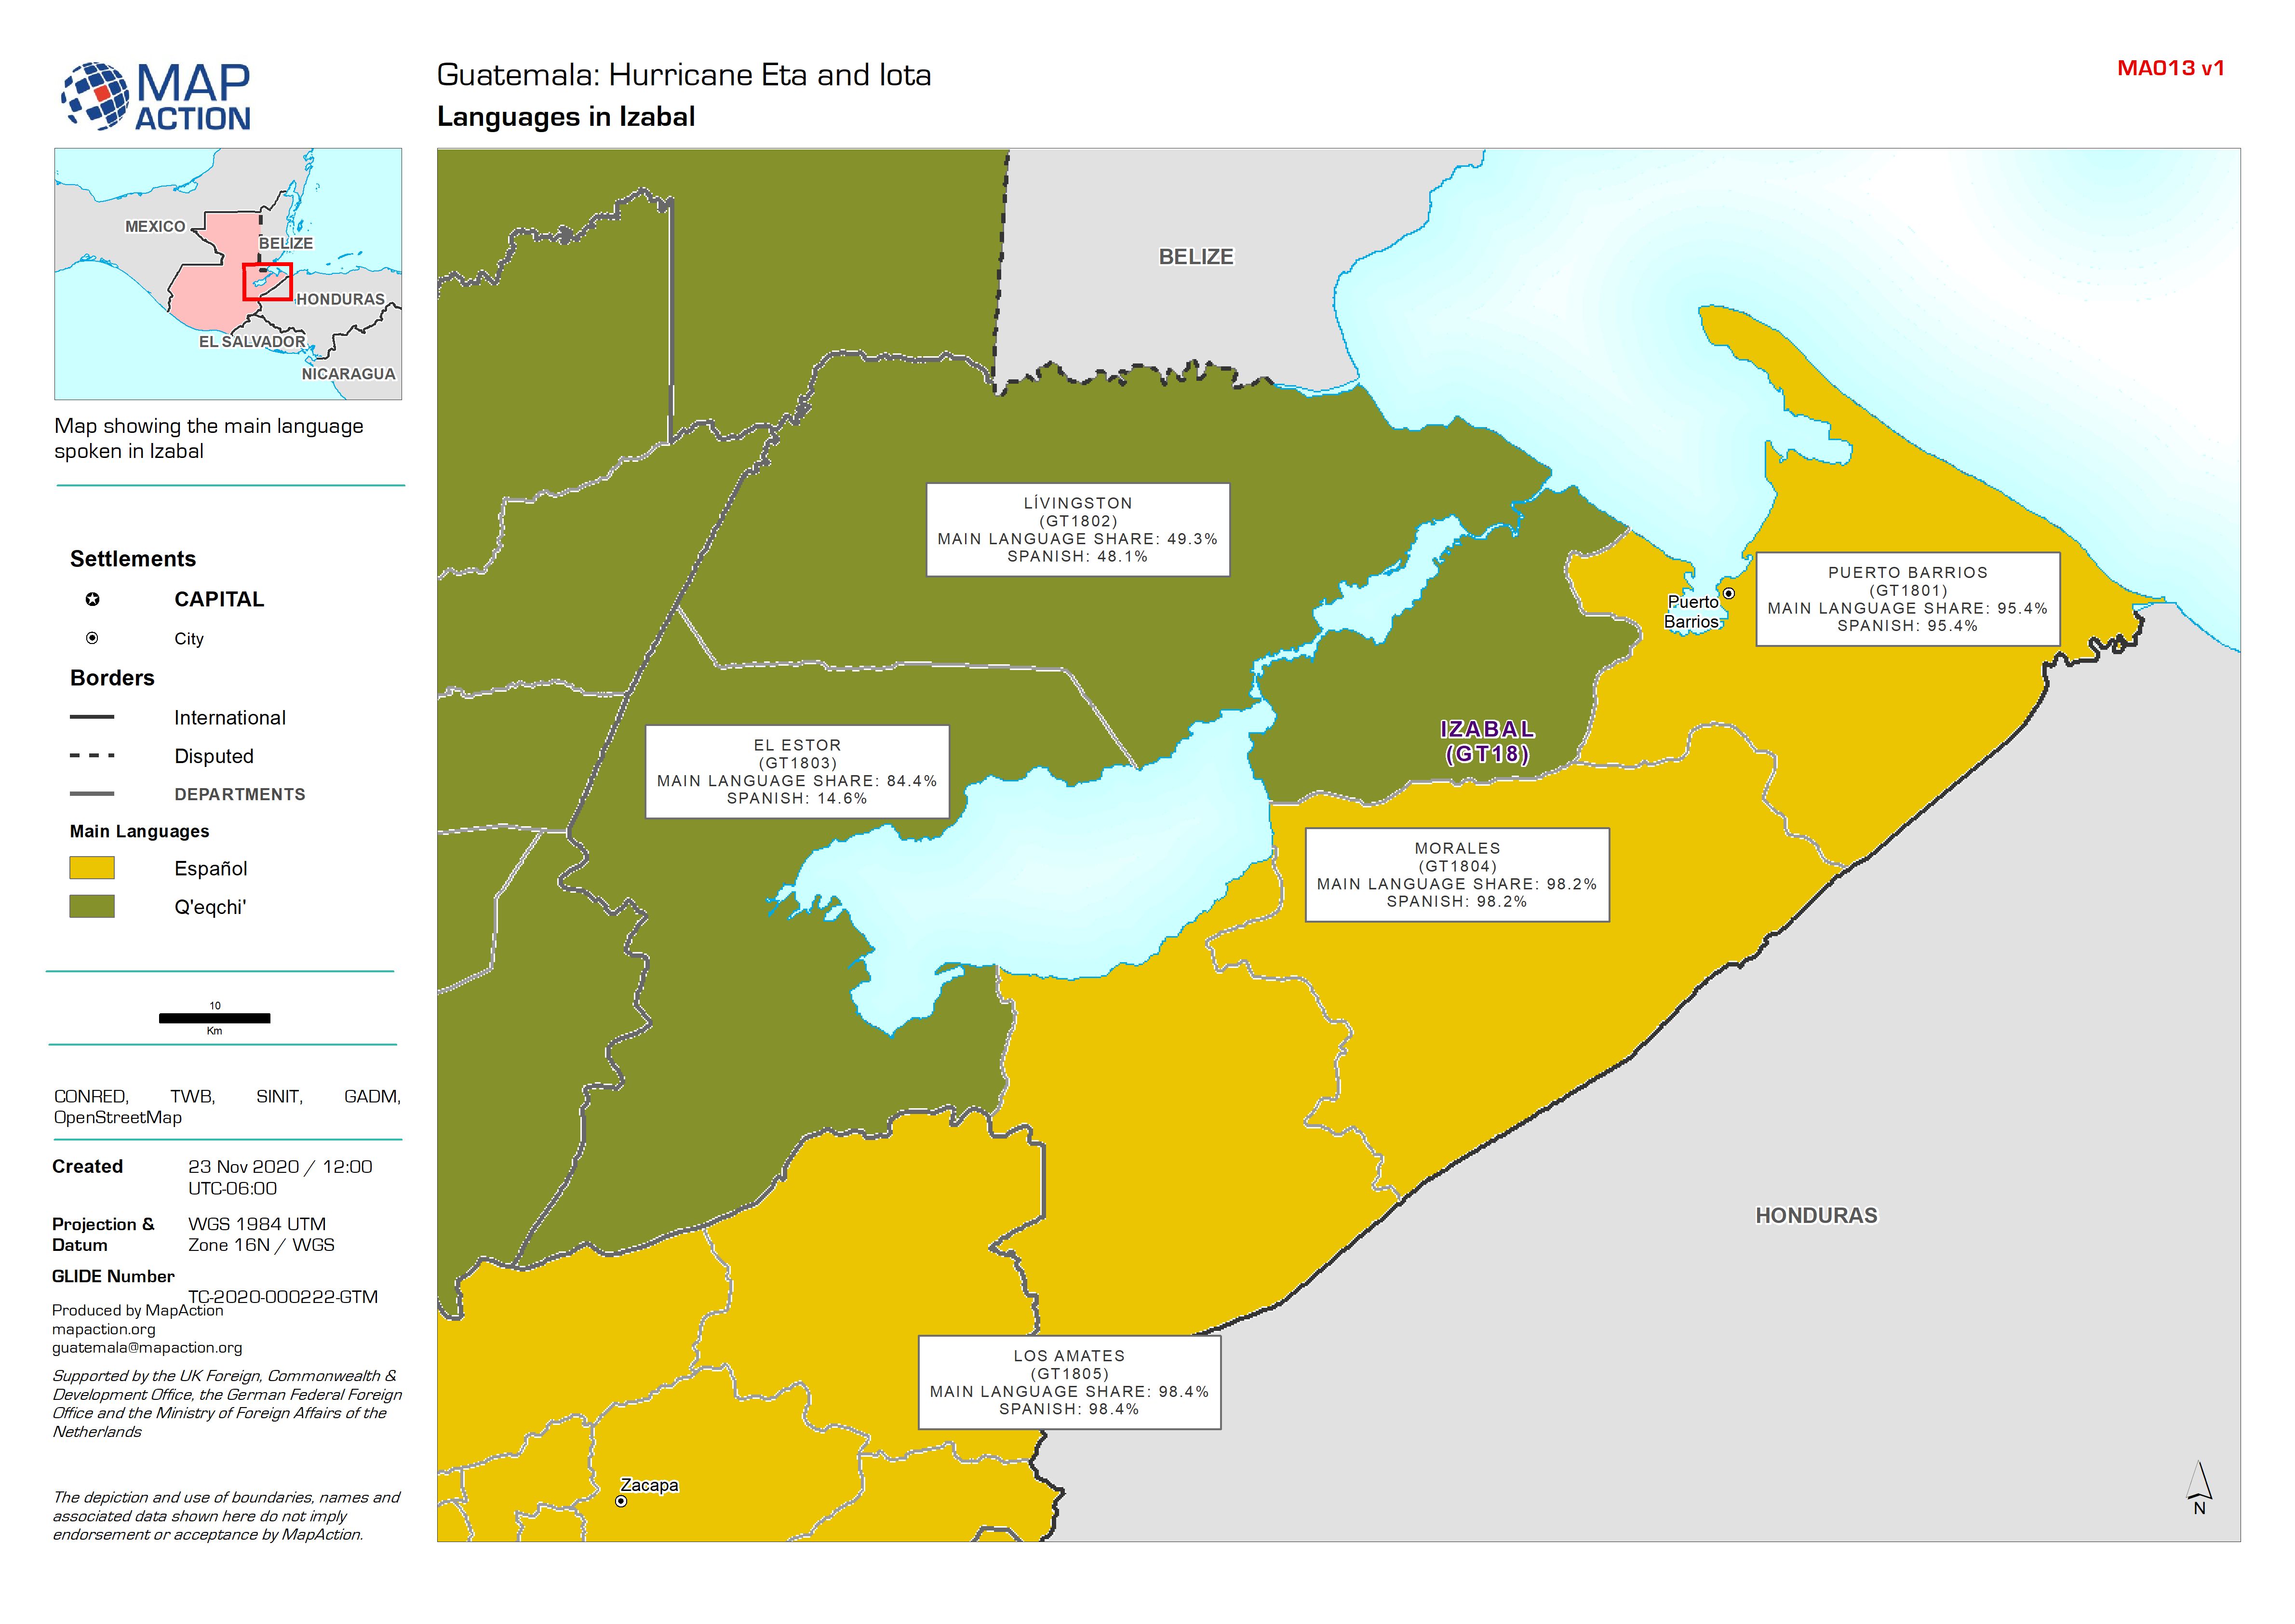
Guatemala: Population Figures (2018) by Municipality in Izabal
Map showing population figures (2018), Department (Admin 1) and Municipality (Admin 2) boundaries, and Pcodes. -

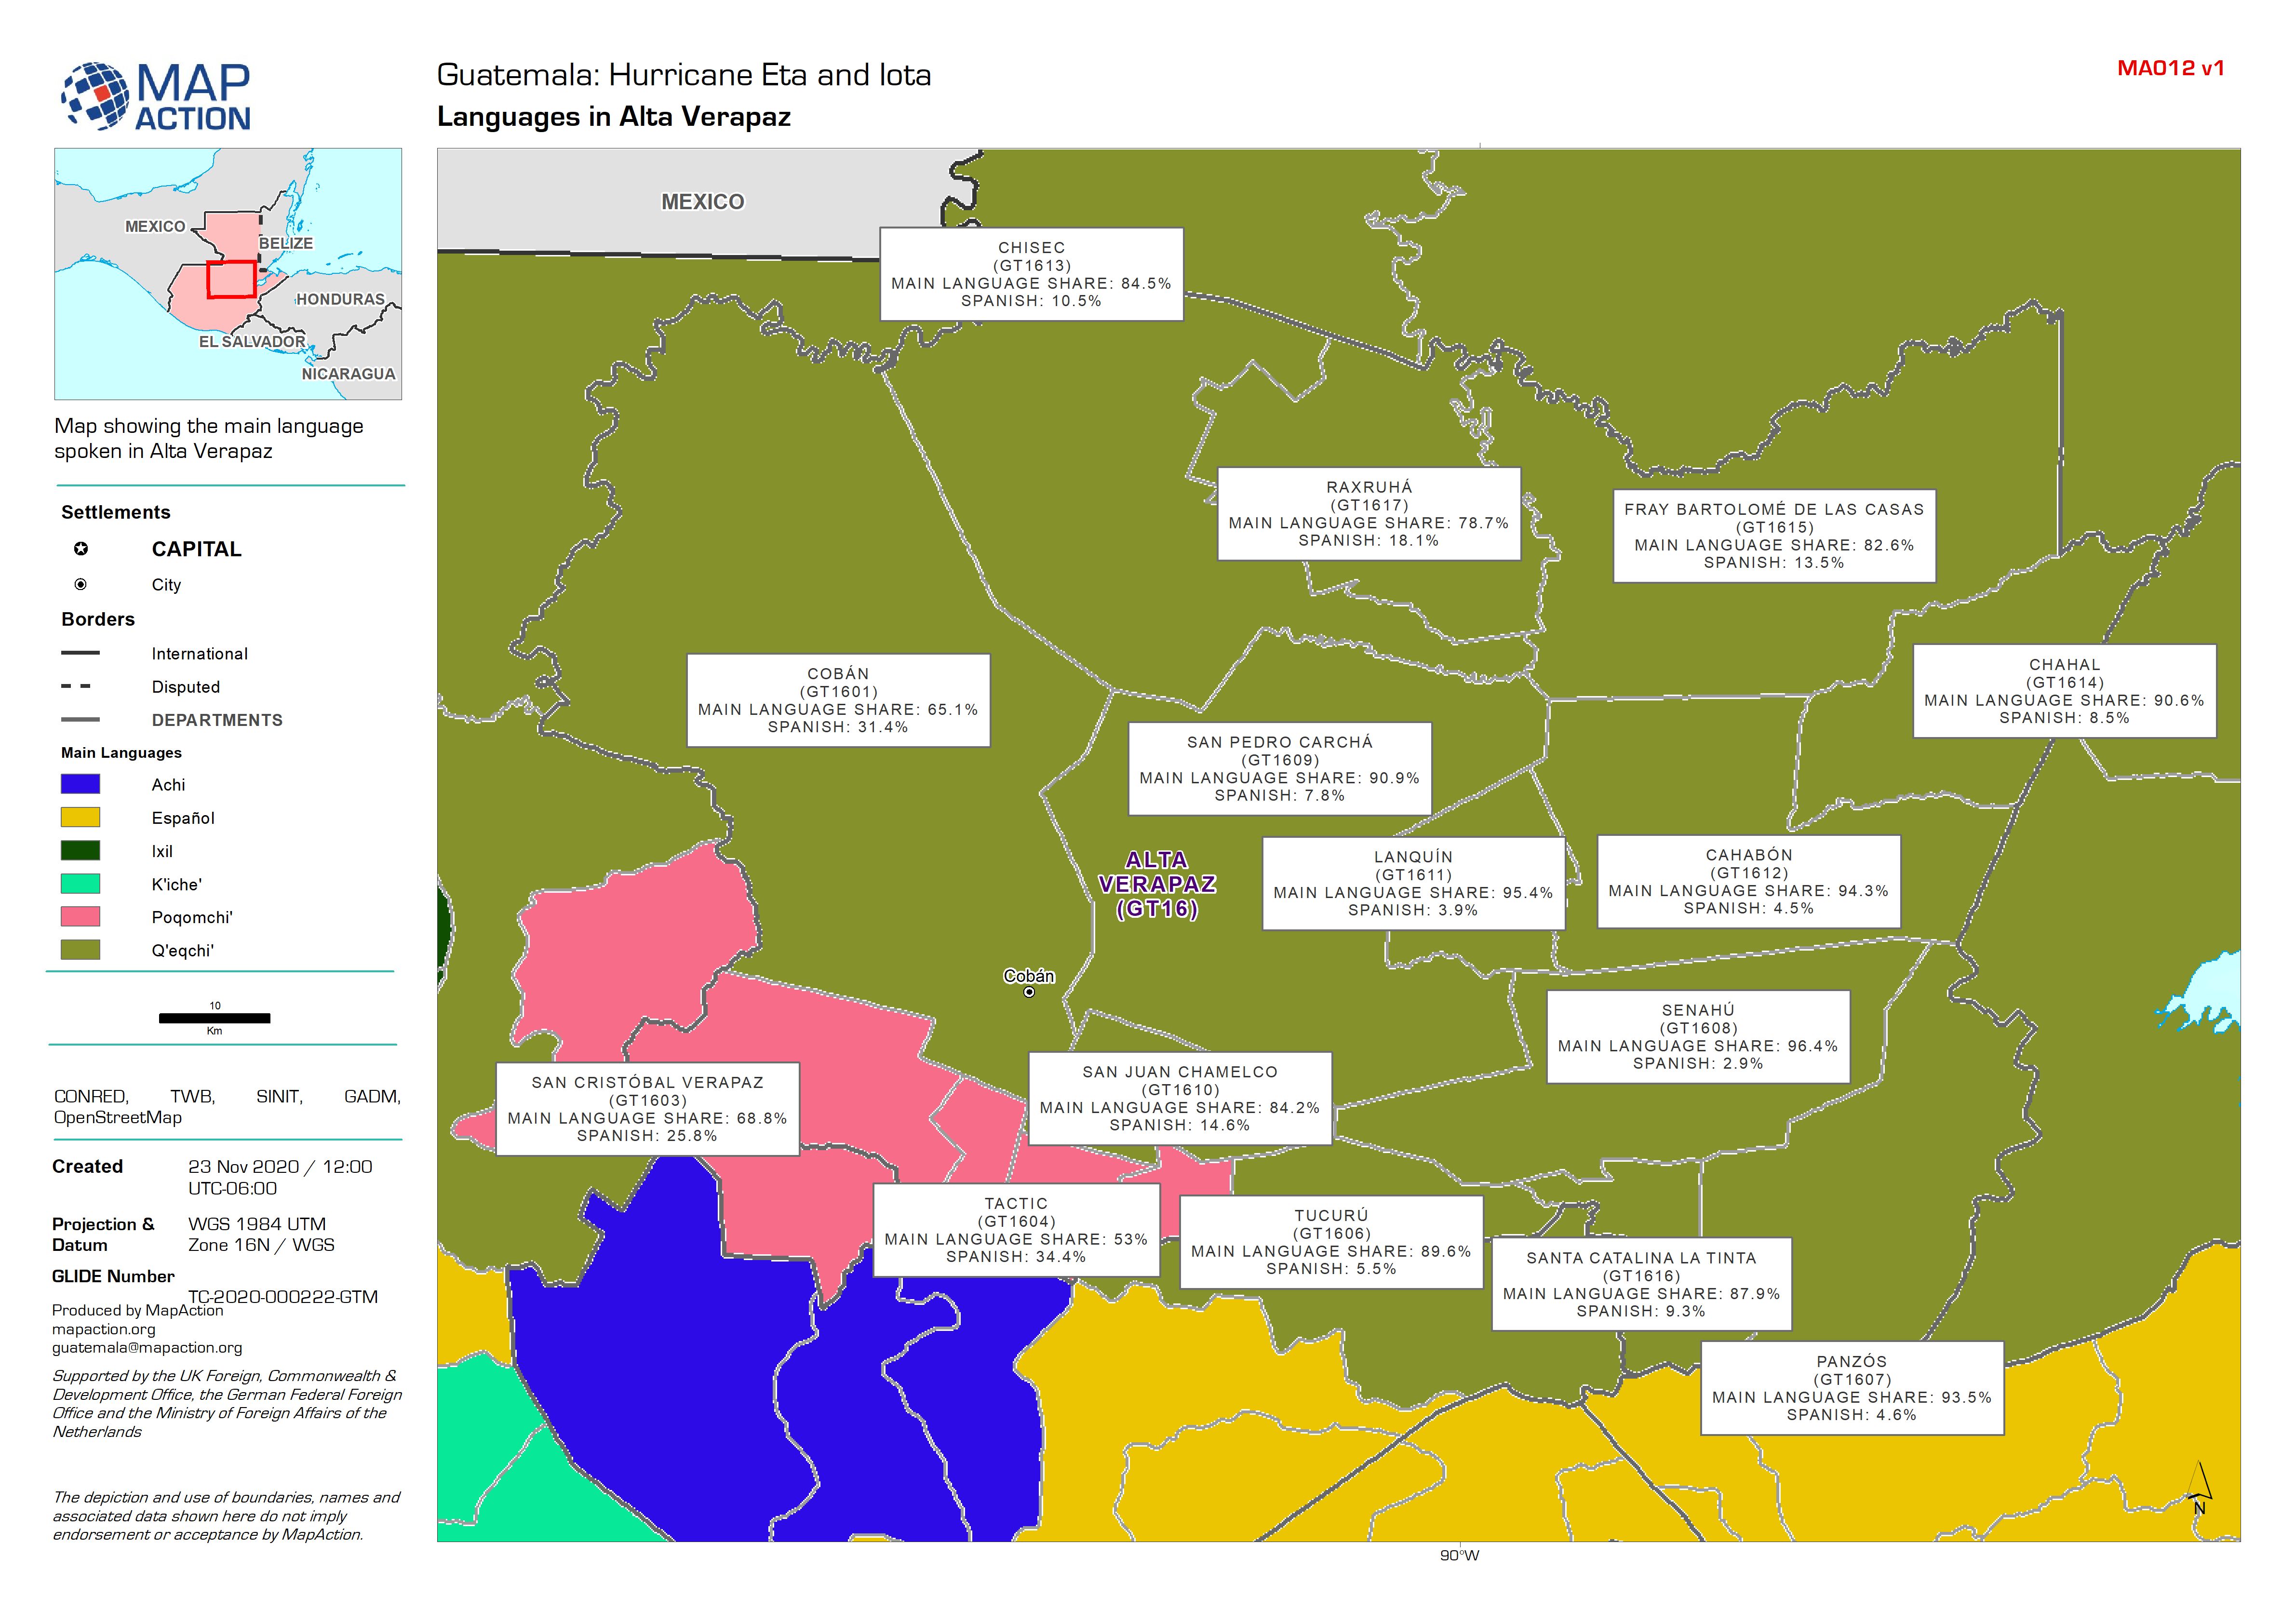
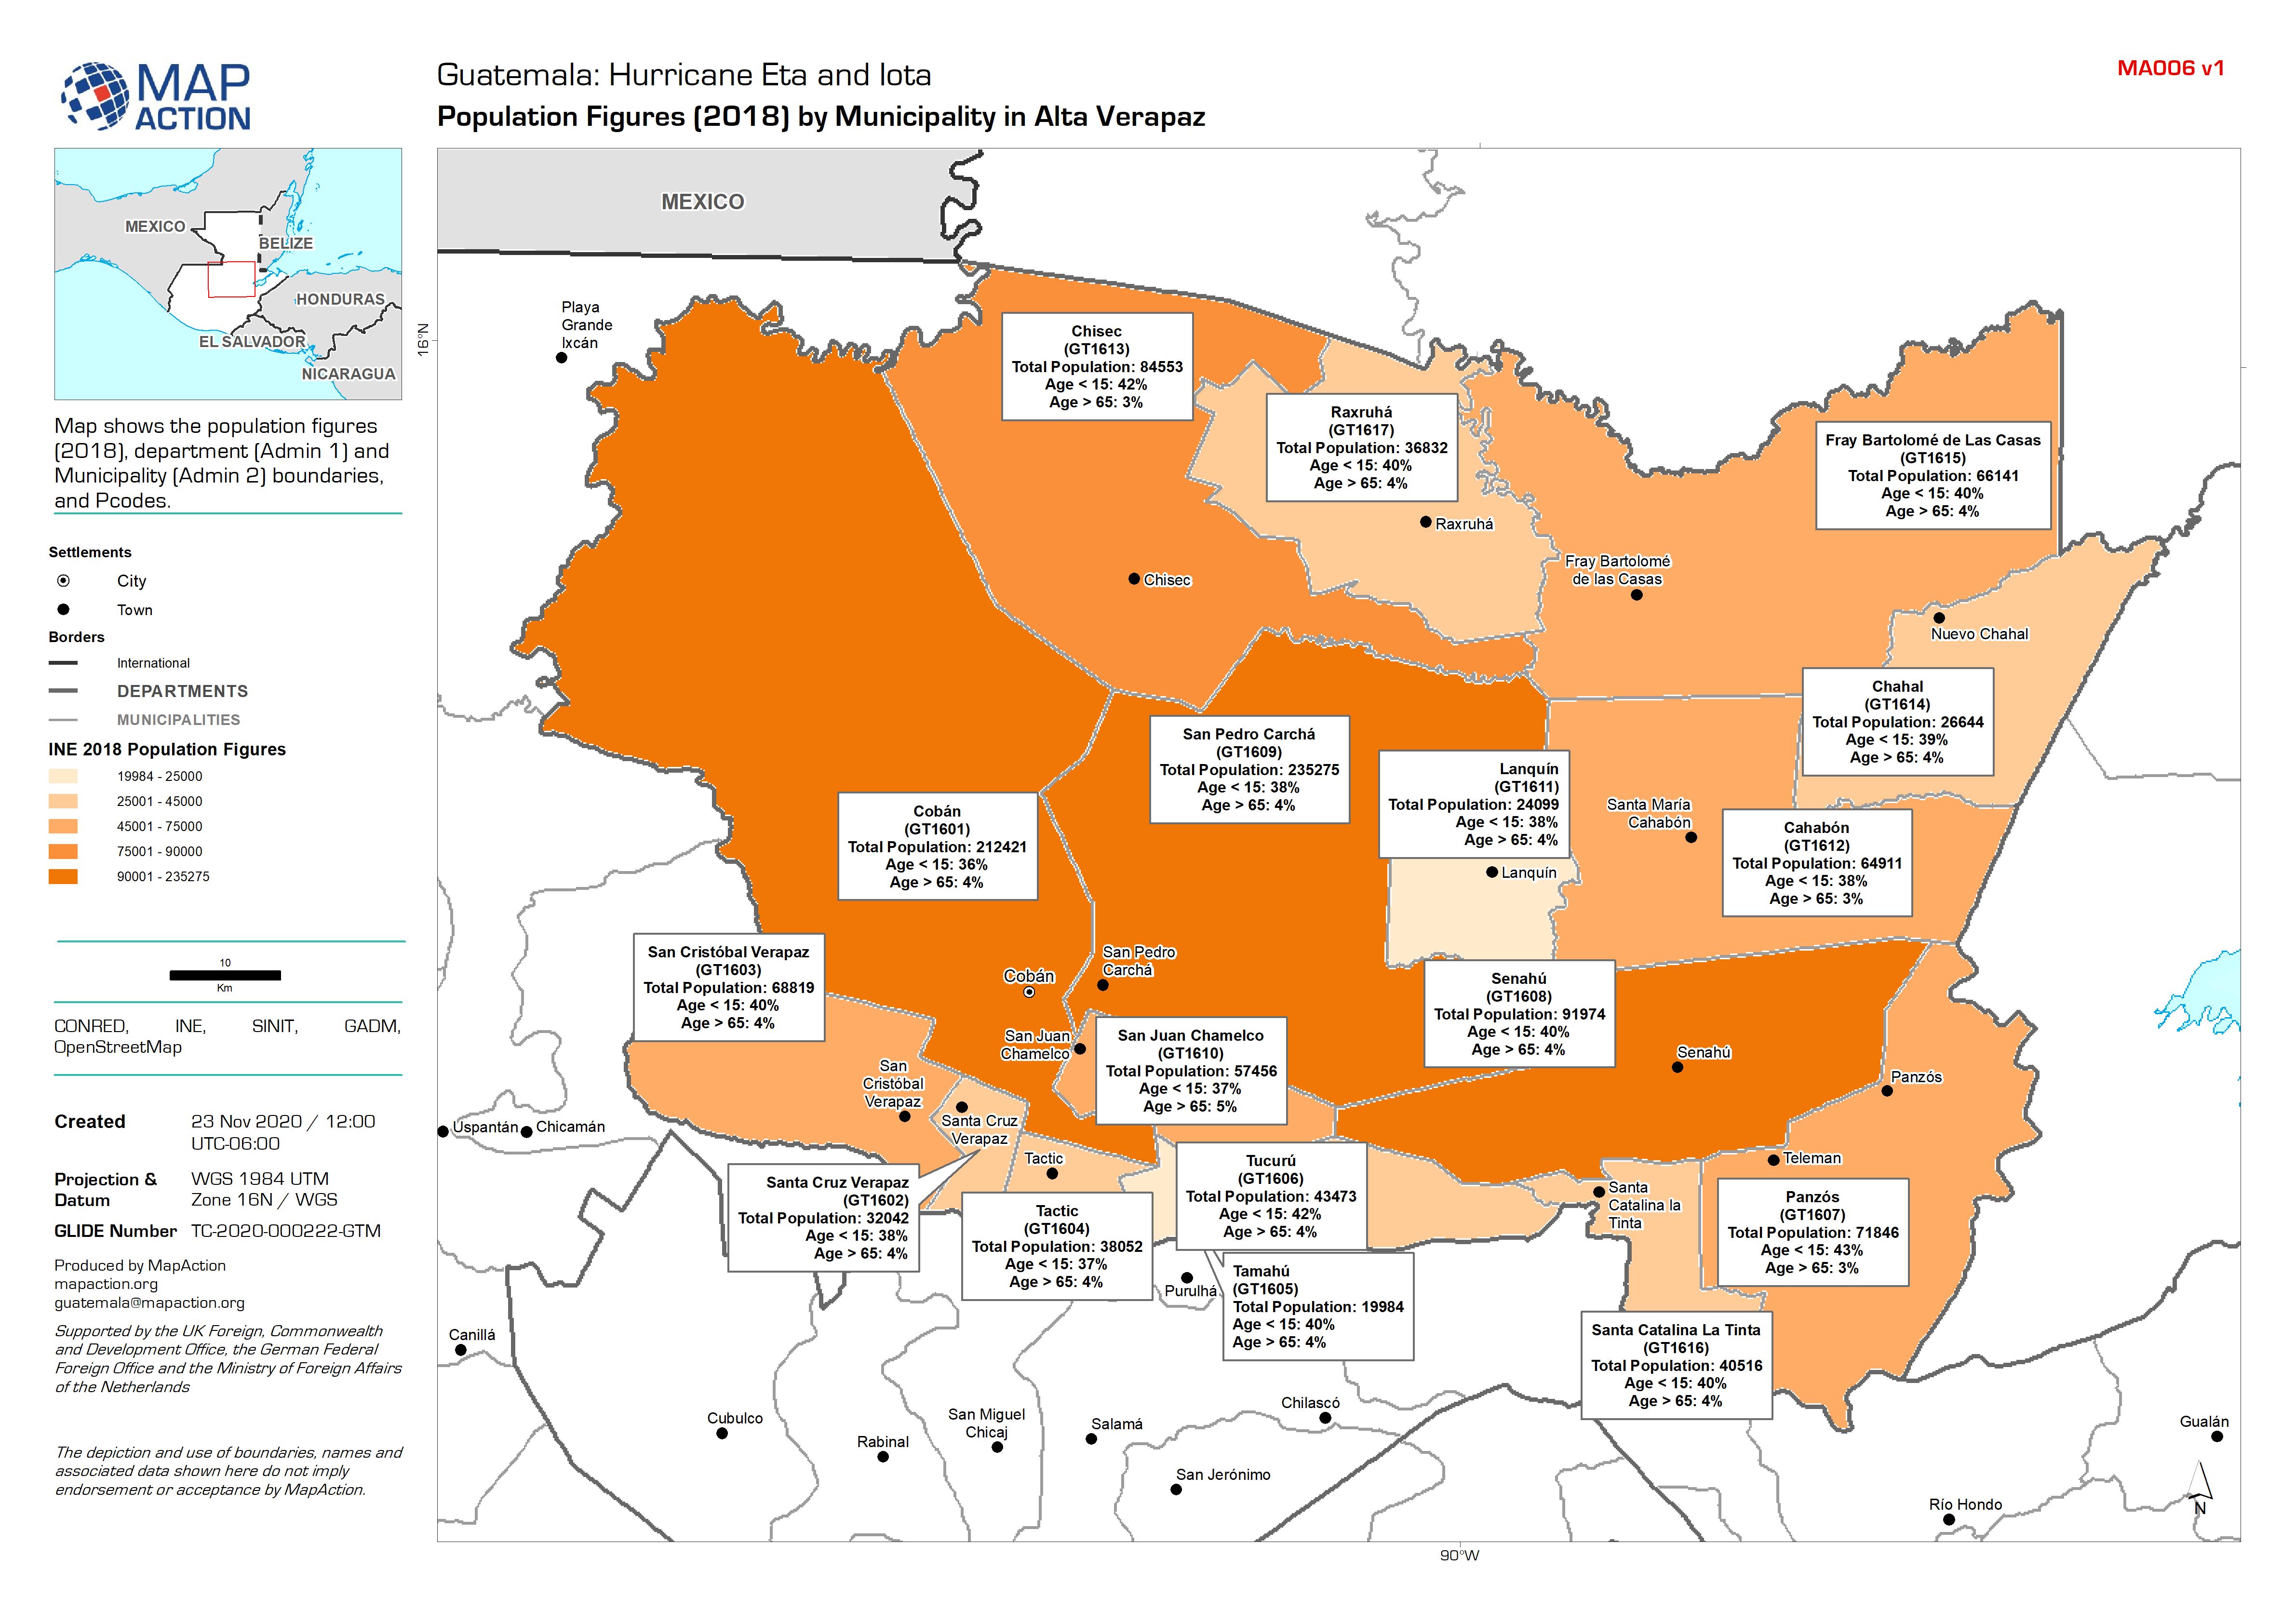
Guatemala: Population Figures (2018) by Municipality in Alta Verapaz
Map shows the population figures (2018), department (Admin 1) and Municipality (Admin 2) boundaries, and Pcodes. -

Guatemala: Administrative level 2 (Municipality) 2018 population statistics
Baseline population for Guatemala -

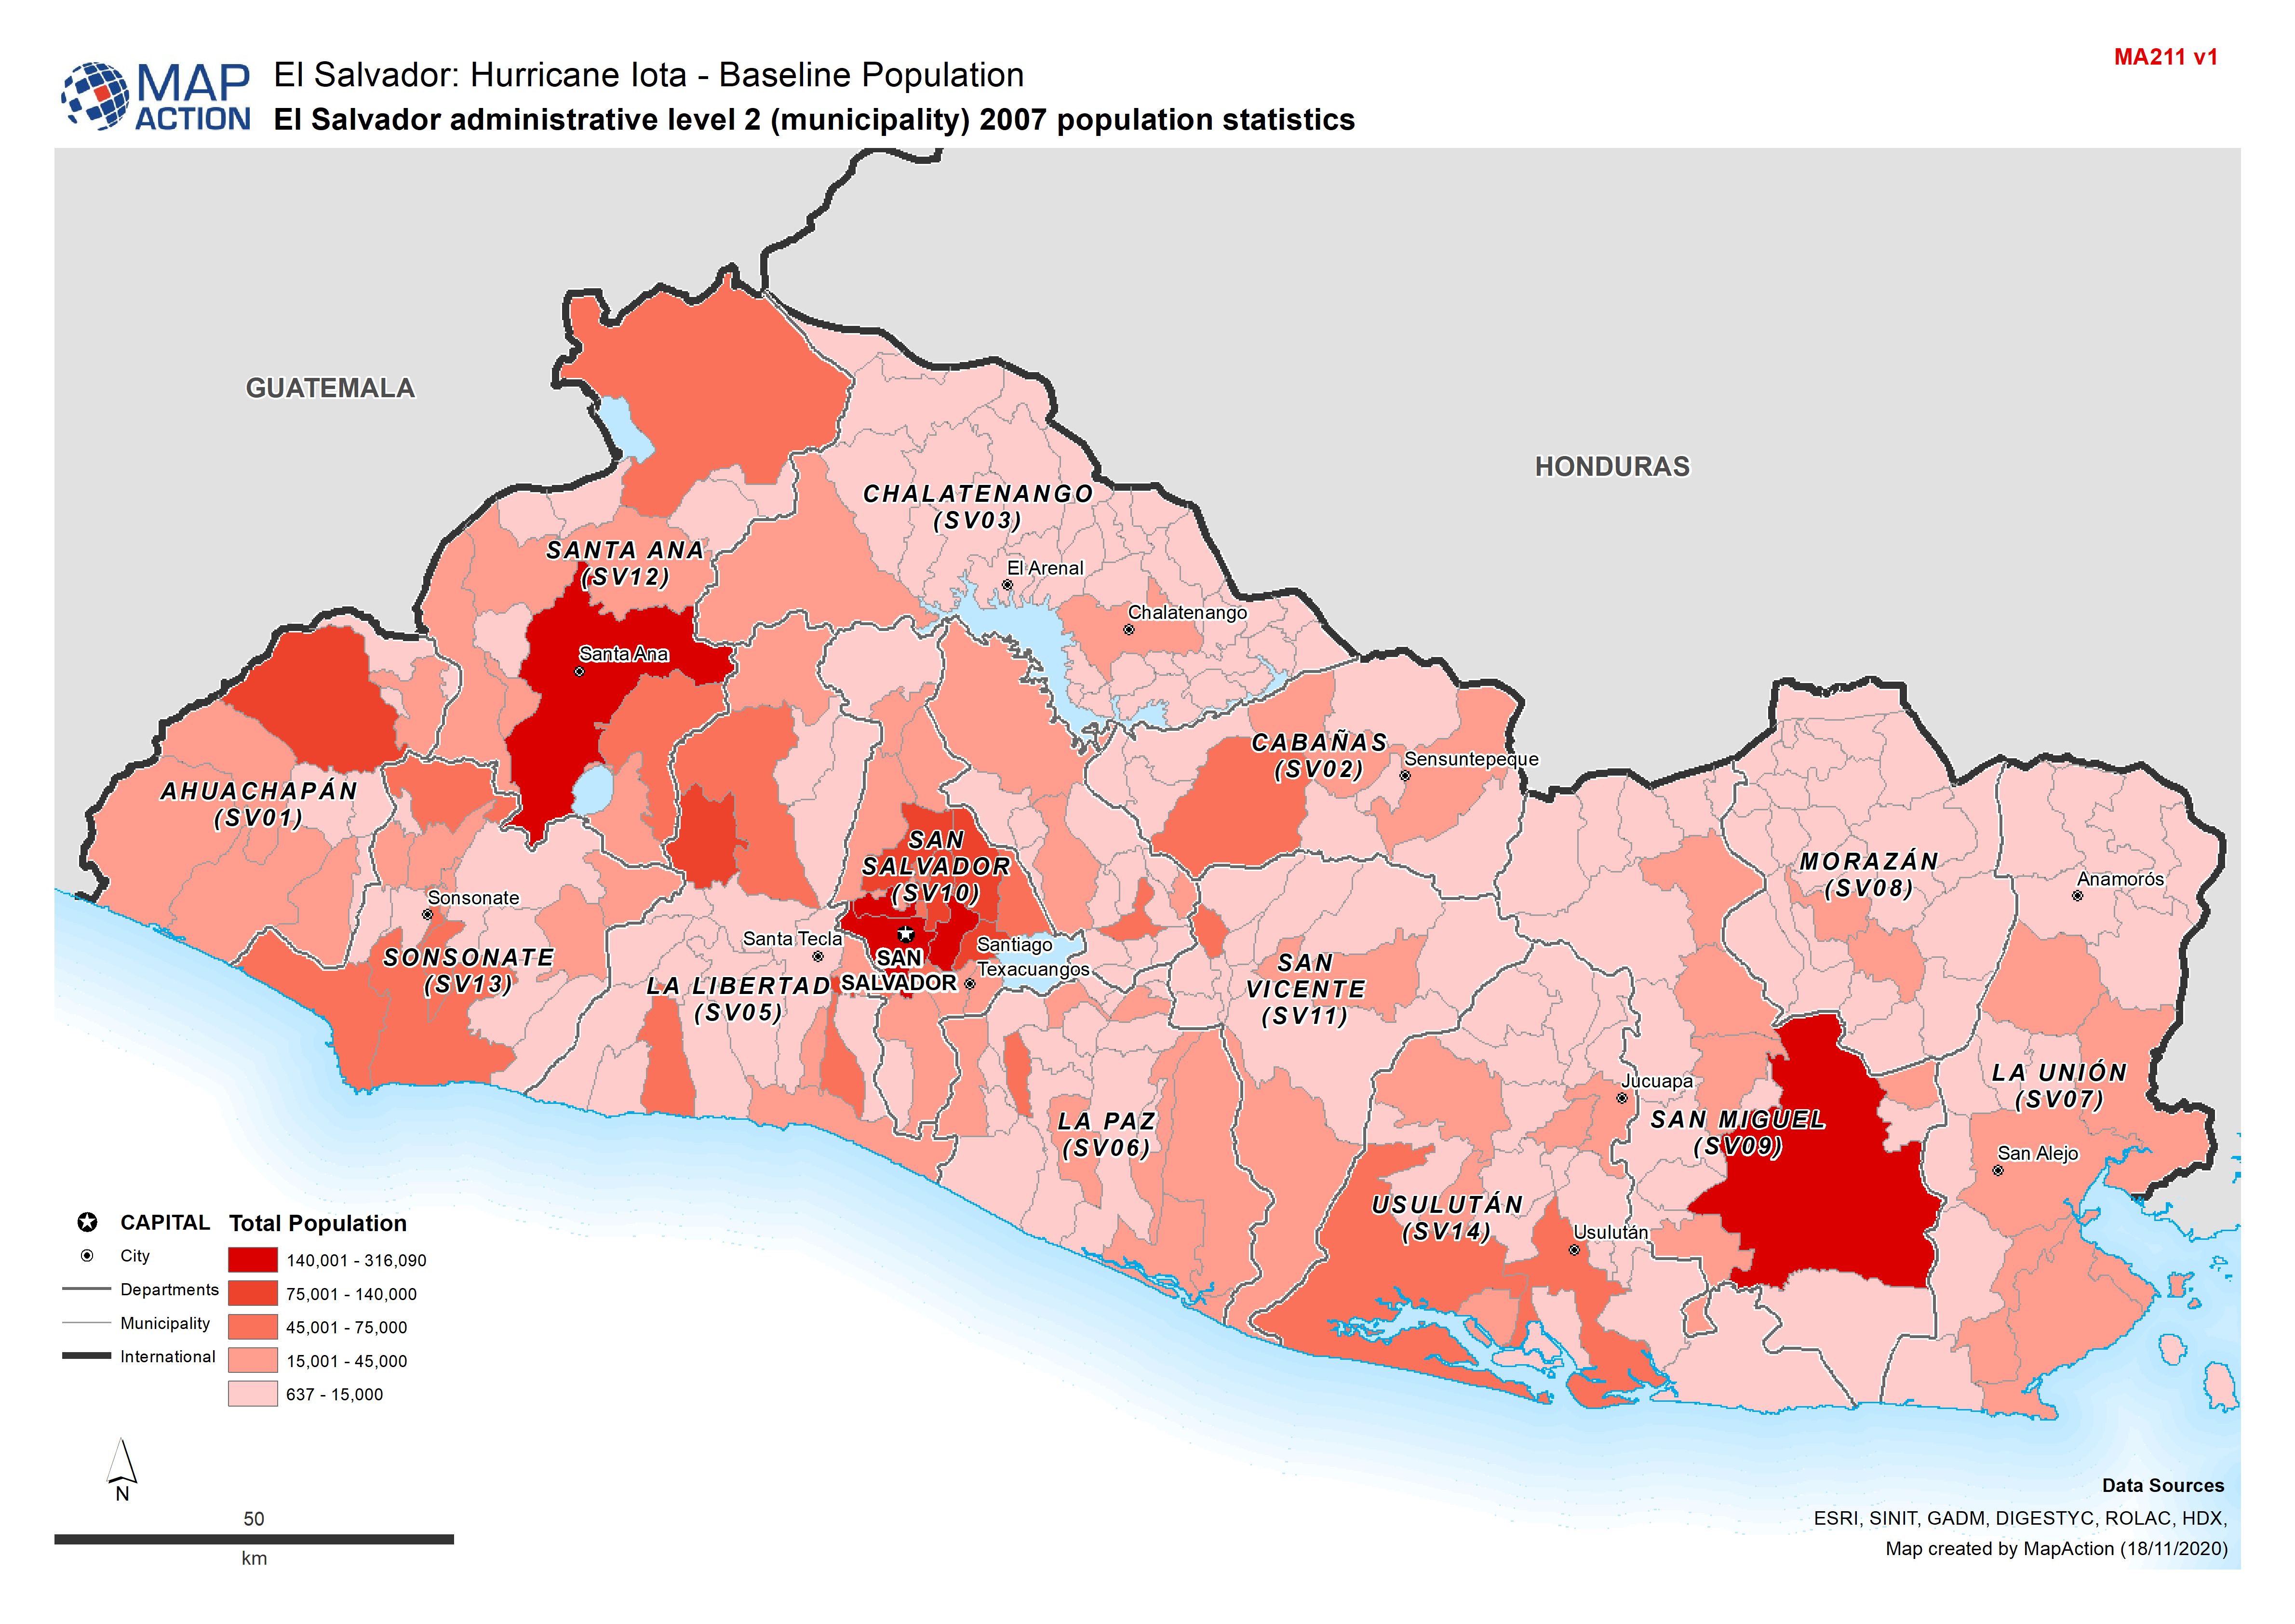
El Salvador: Administrative level 2 (Municipality) 2007 population statistics
Baseline population for El Salvador -

Nicaragua and Honduras: Potential storm track, population and municipalities:...
This map shows the potentially affected administration level 2 municipalities for Nicaragua, with departmental population for Nicaragua and Honduras, and predicted wind speed... -
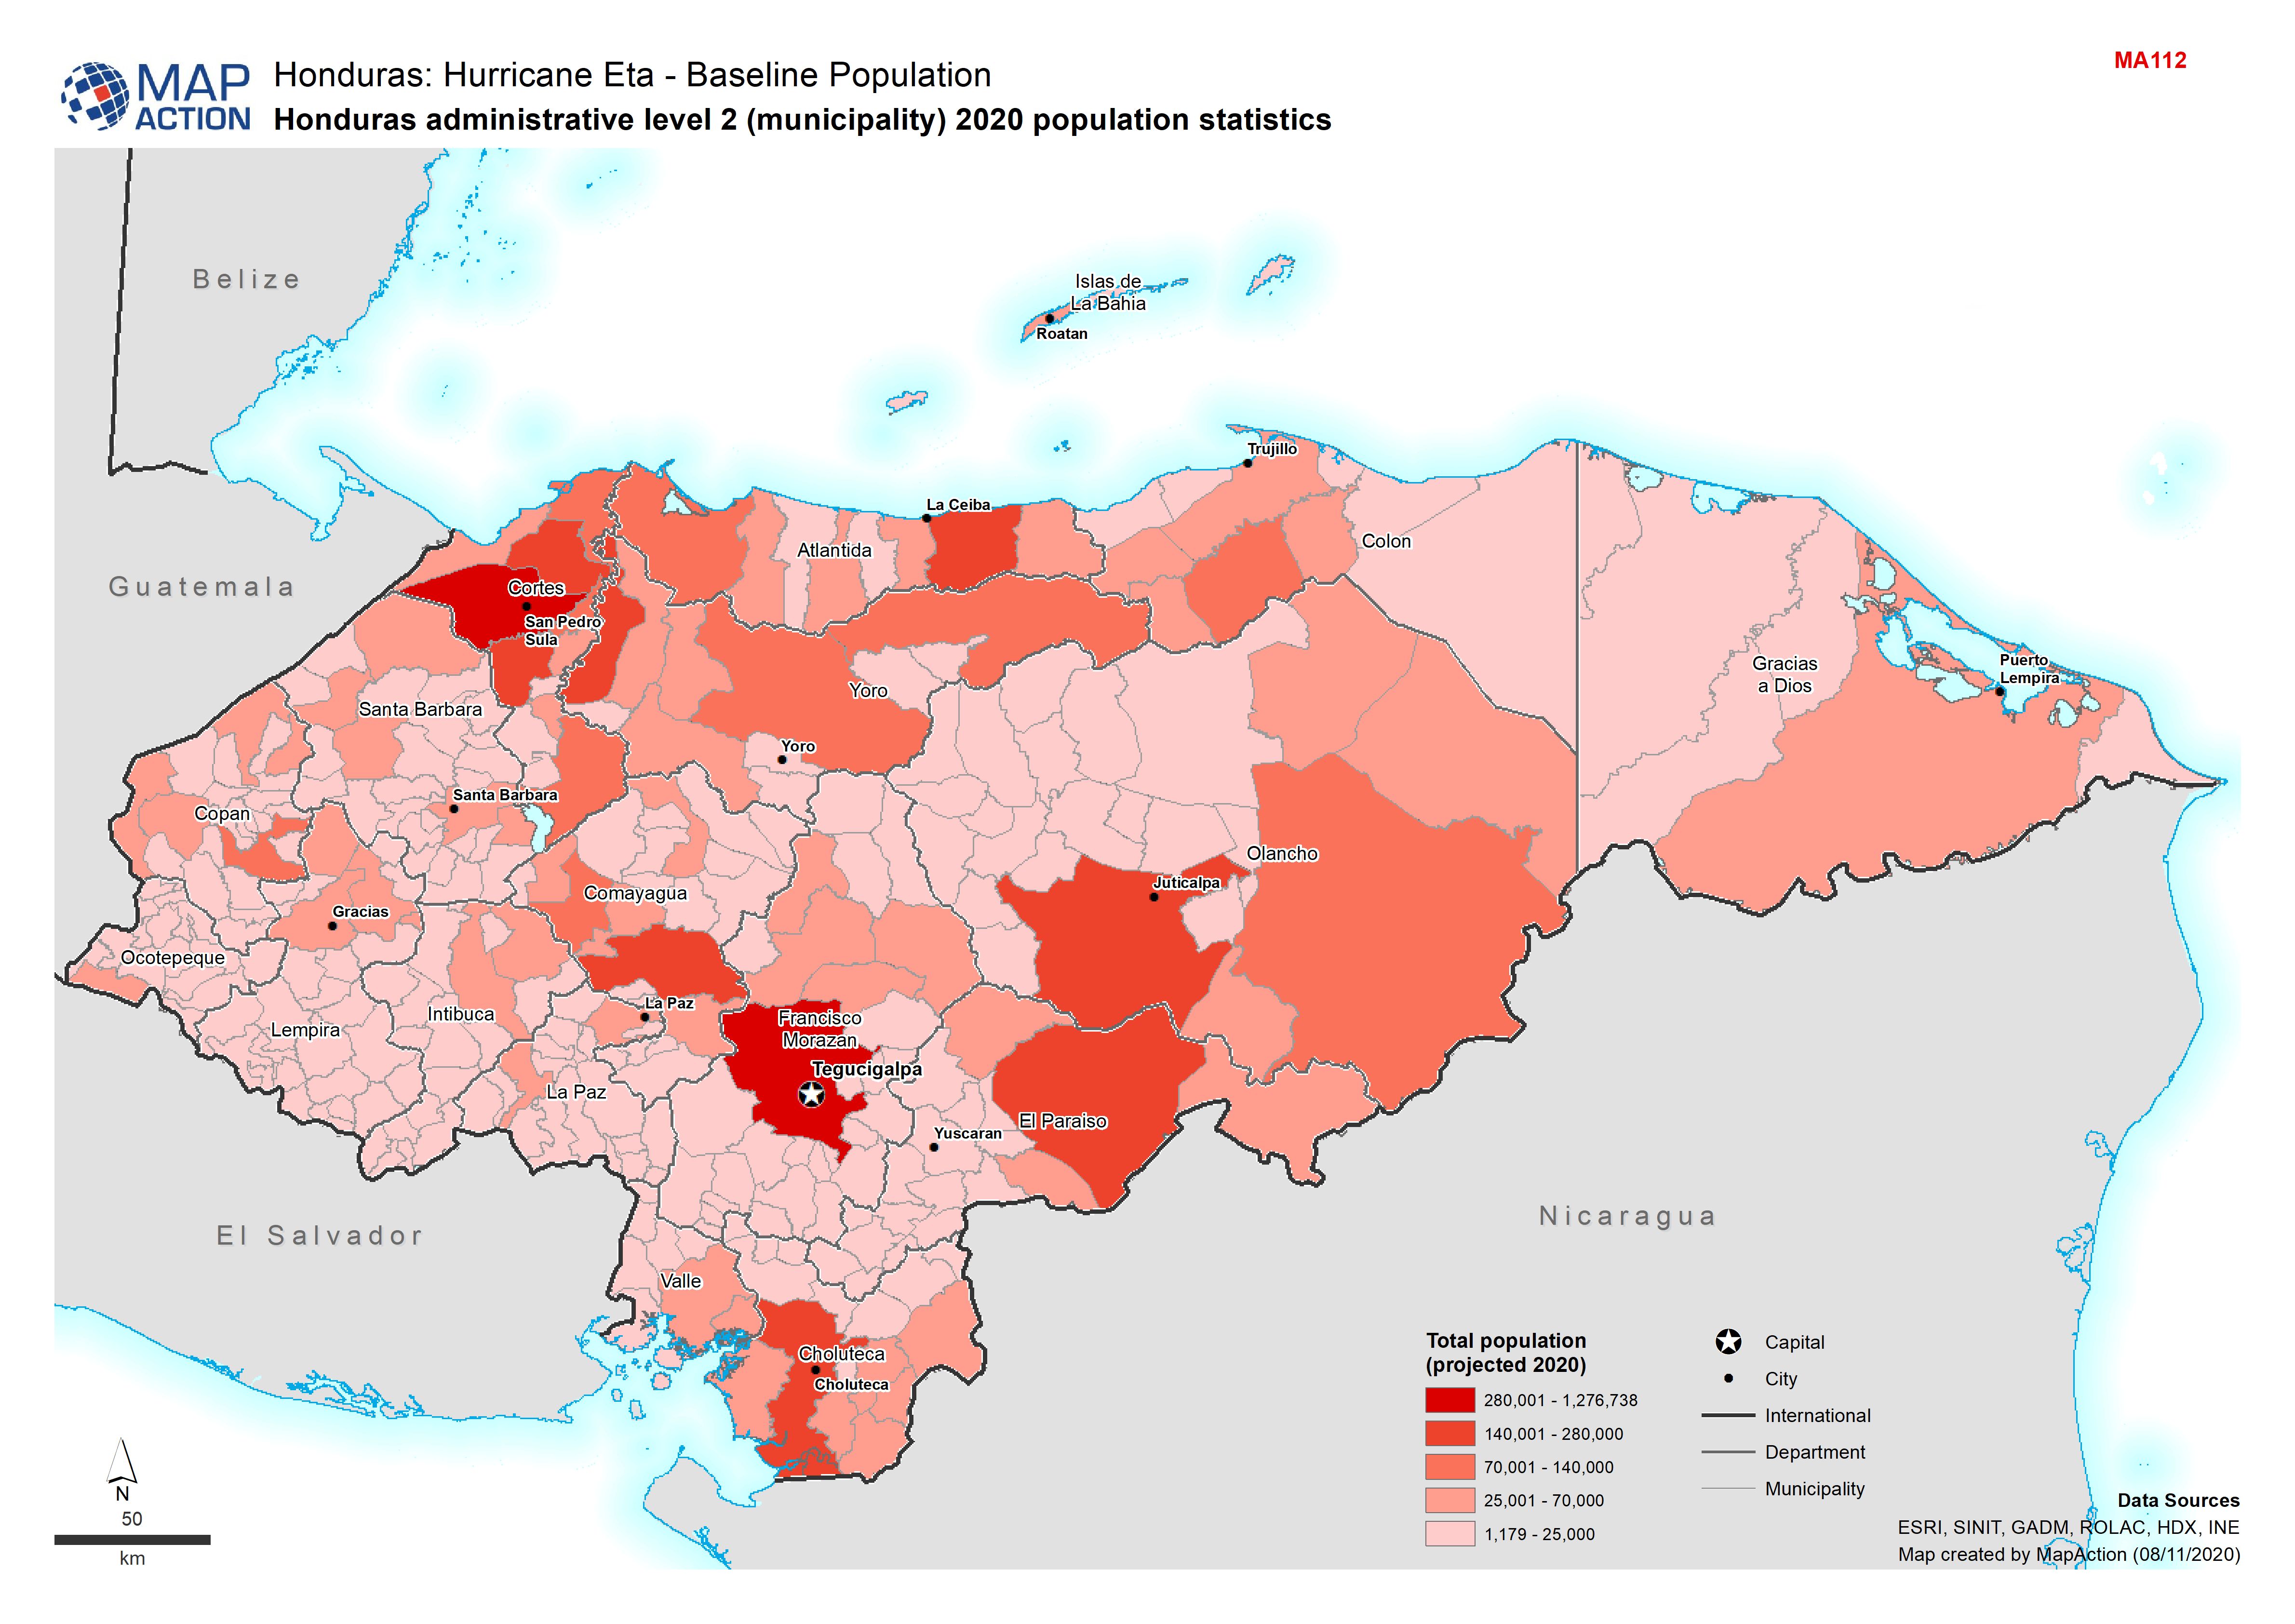
Honduras: administrative level 2 (municipality) 2020 population statistics
Baseline population for Honduras -

The Philippines: Typhoon Goni - Baseline population (2020 estimate) in storm ...
Map shows the path of the storm and the population density.